Copyright
©The Author(s) 2020.
World J Gastroenterol. Sep 28, 2020; 26(36): 5474-5483
Published online Sep 28, 2020. doi: 10.3748/wjg.v26.i36.5474
Published online Sep 28, 2020. doi: 10.3748/wjg.v26.i36.5474
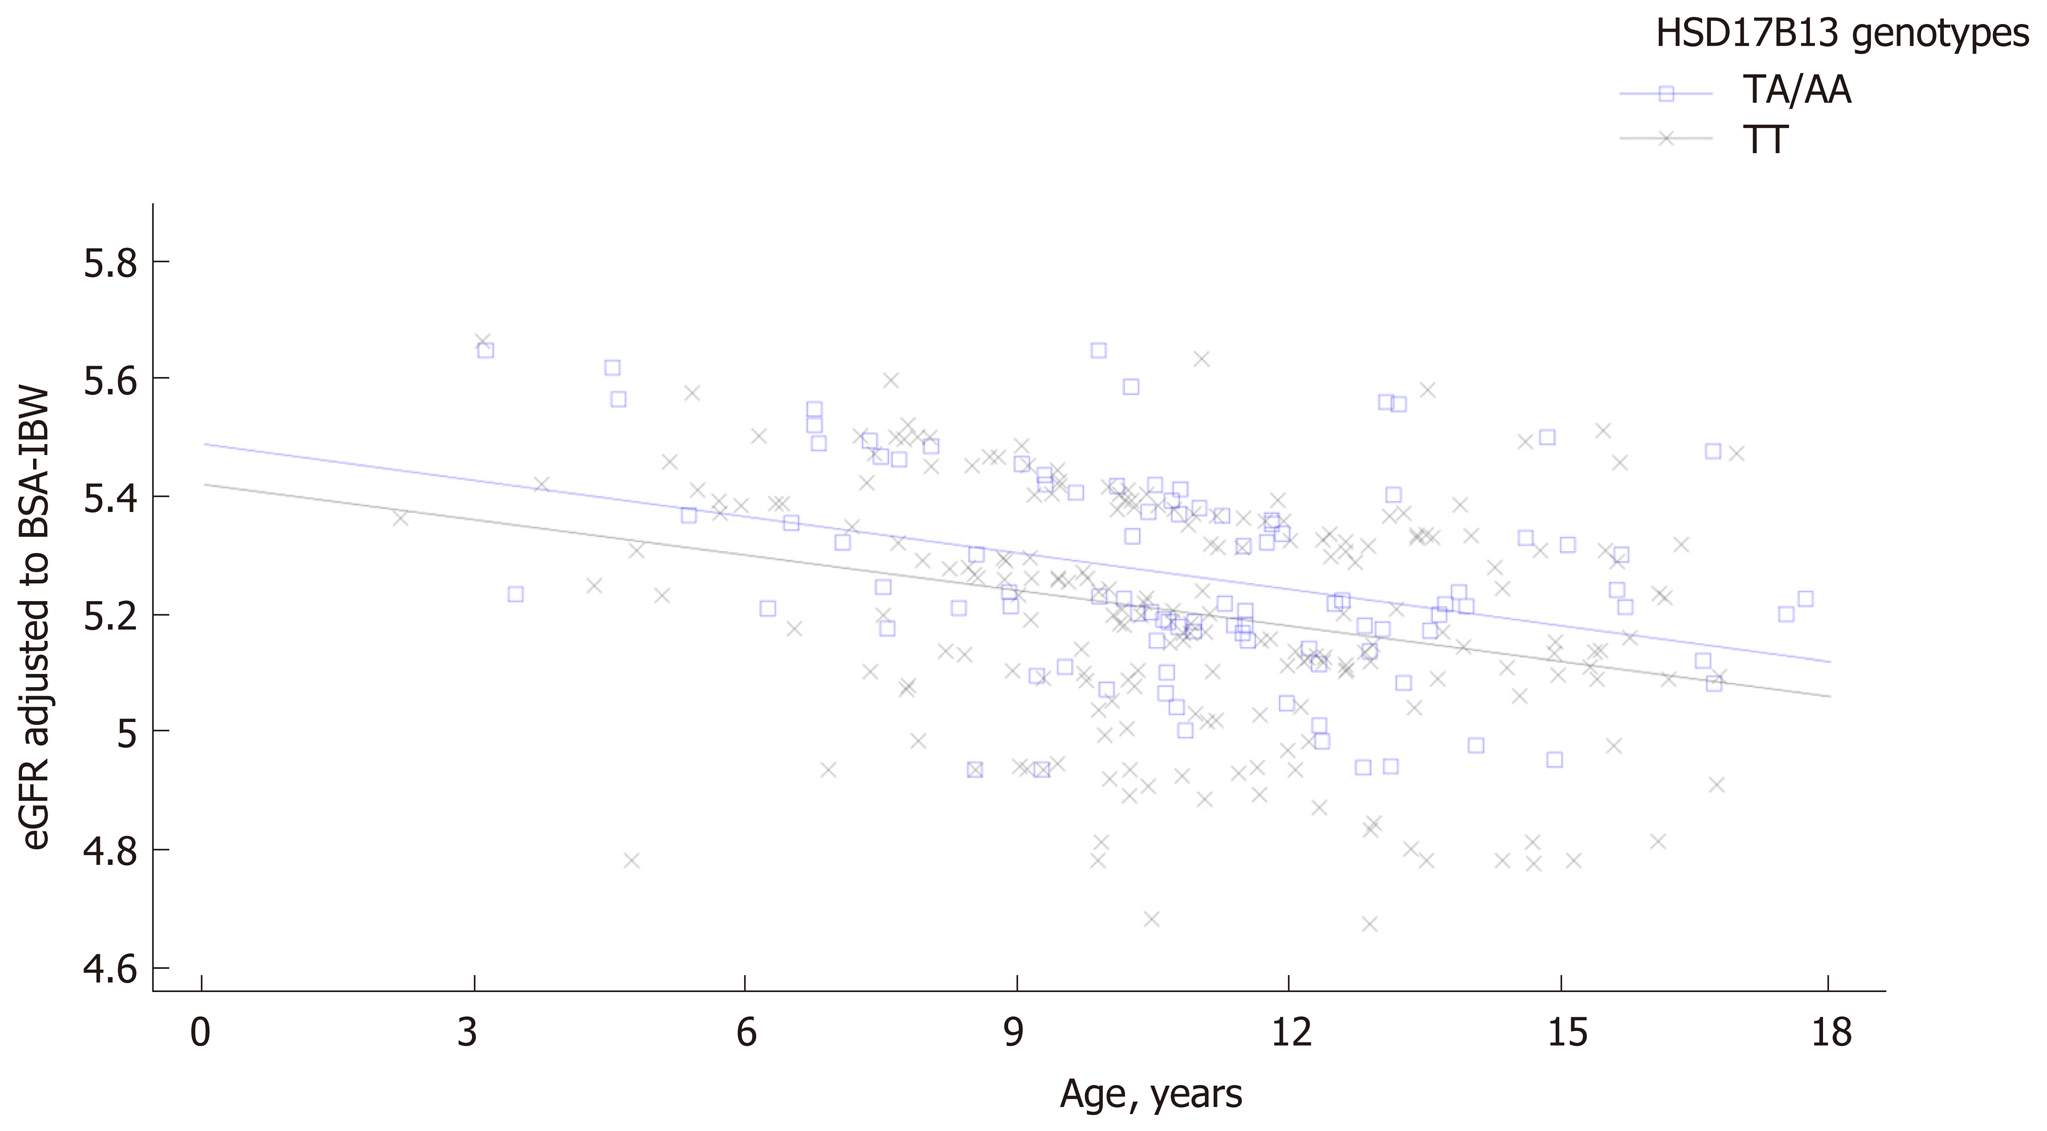
Figure 1 Regression analysis describing the relationship between estimated glomerular filtration rate and age according to HSD17B13 genotype in patients with non-alcoholic fatty liver disease.
The regression is described by the equation y = 5.49596 – 0.0205849x – 0.0688943 × (hsd17b13 = 1) + 0.00054199x × (hsd17b13 = 1). P value for intercepts is 0.005 while for slopes is 0.94.
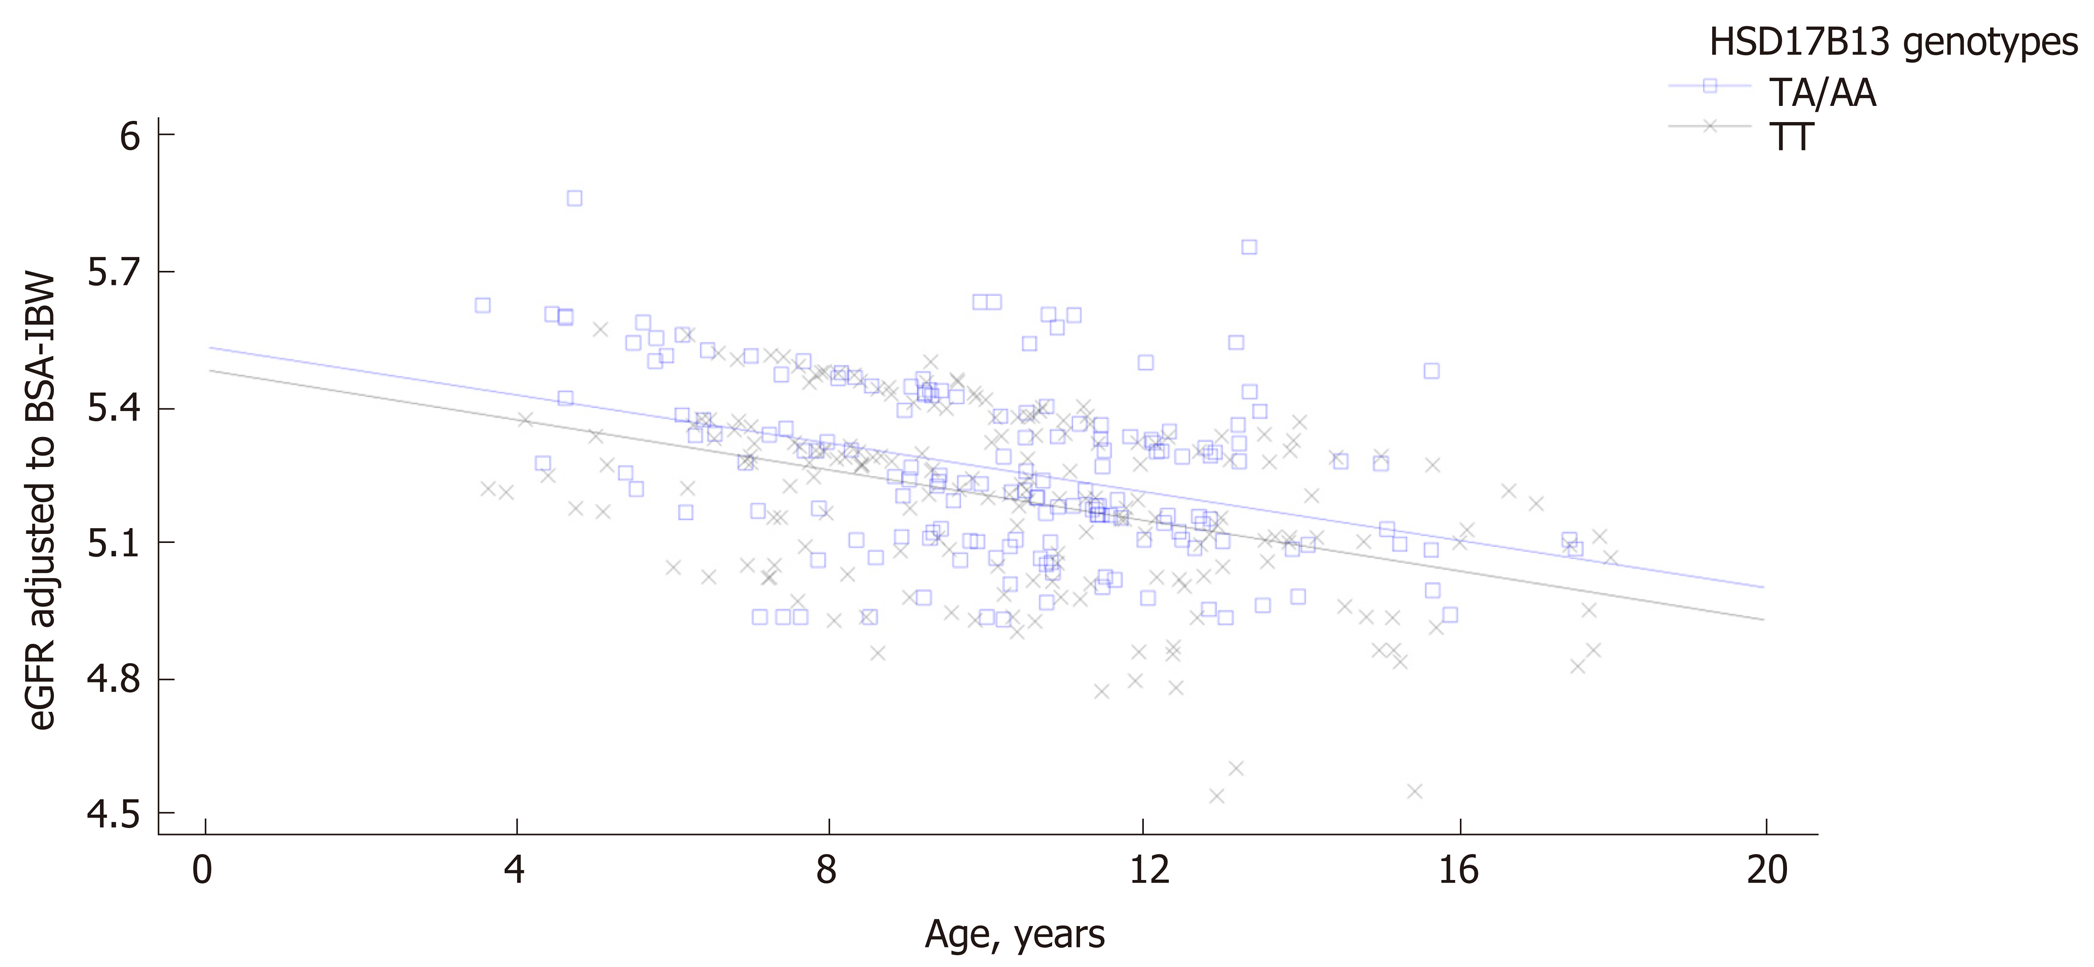
Figure 2 Regression analysis describing the relationship between estimated glomerular filtration rate and age according to HSD17B13 genotype in patients without non-alcoholic fatty liver disease.
The regression is described by the equation y = 5.54093 – 0.0266856x – 0.0508993 × (hsd17b13=1) – 0.00105742x × (hsd17b13=1). P value for intercepts is 0.0012 while for slopes is 0.87.
- Citation: Di Sessa A, Umano GR, Cirillo G, Passaro AP, Verde V, Cozzolino D, Guarino S, Marzuillo P, Miraglia del Giudice E. Pediatric non-alcoholic fatty liver disease and kidney function: Effect of HSD17B13 variant. World J Gastroenterol 2020; 26(36): 5474-5483
- URL: https://www.wjgnet.com/1007-9327/full/v26/i36/5474.htm
- DOI: https://dx.doi.org/10.3748/wjg.v26.i36.5474


