Copyright
©The Author(s) 2020.
World J Gastroenterol. Sep 14, 2020; 26(34): 5169-5180
Published online Sep 14, 2020. doi: 10.3748/wjg.v26.i34.5169
Published online Sep 14, 2020. doi: 10.3748/wjg.v26.i34.5169
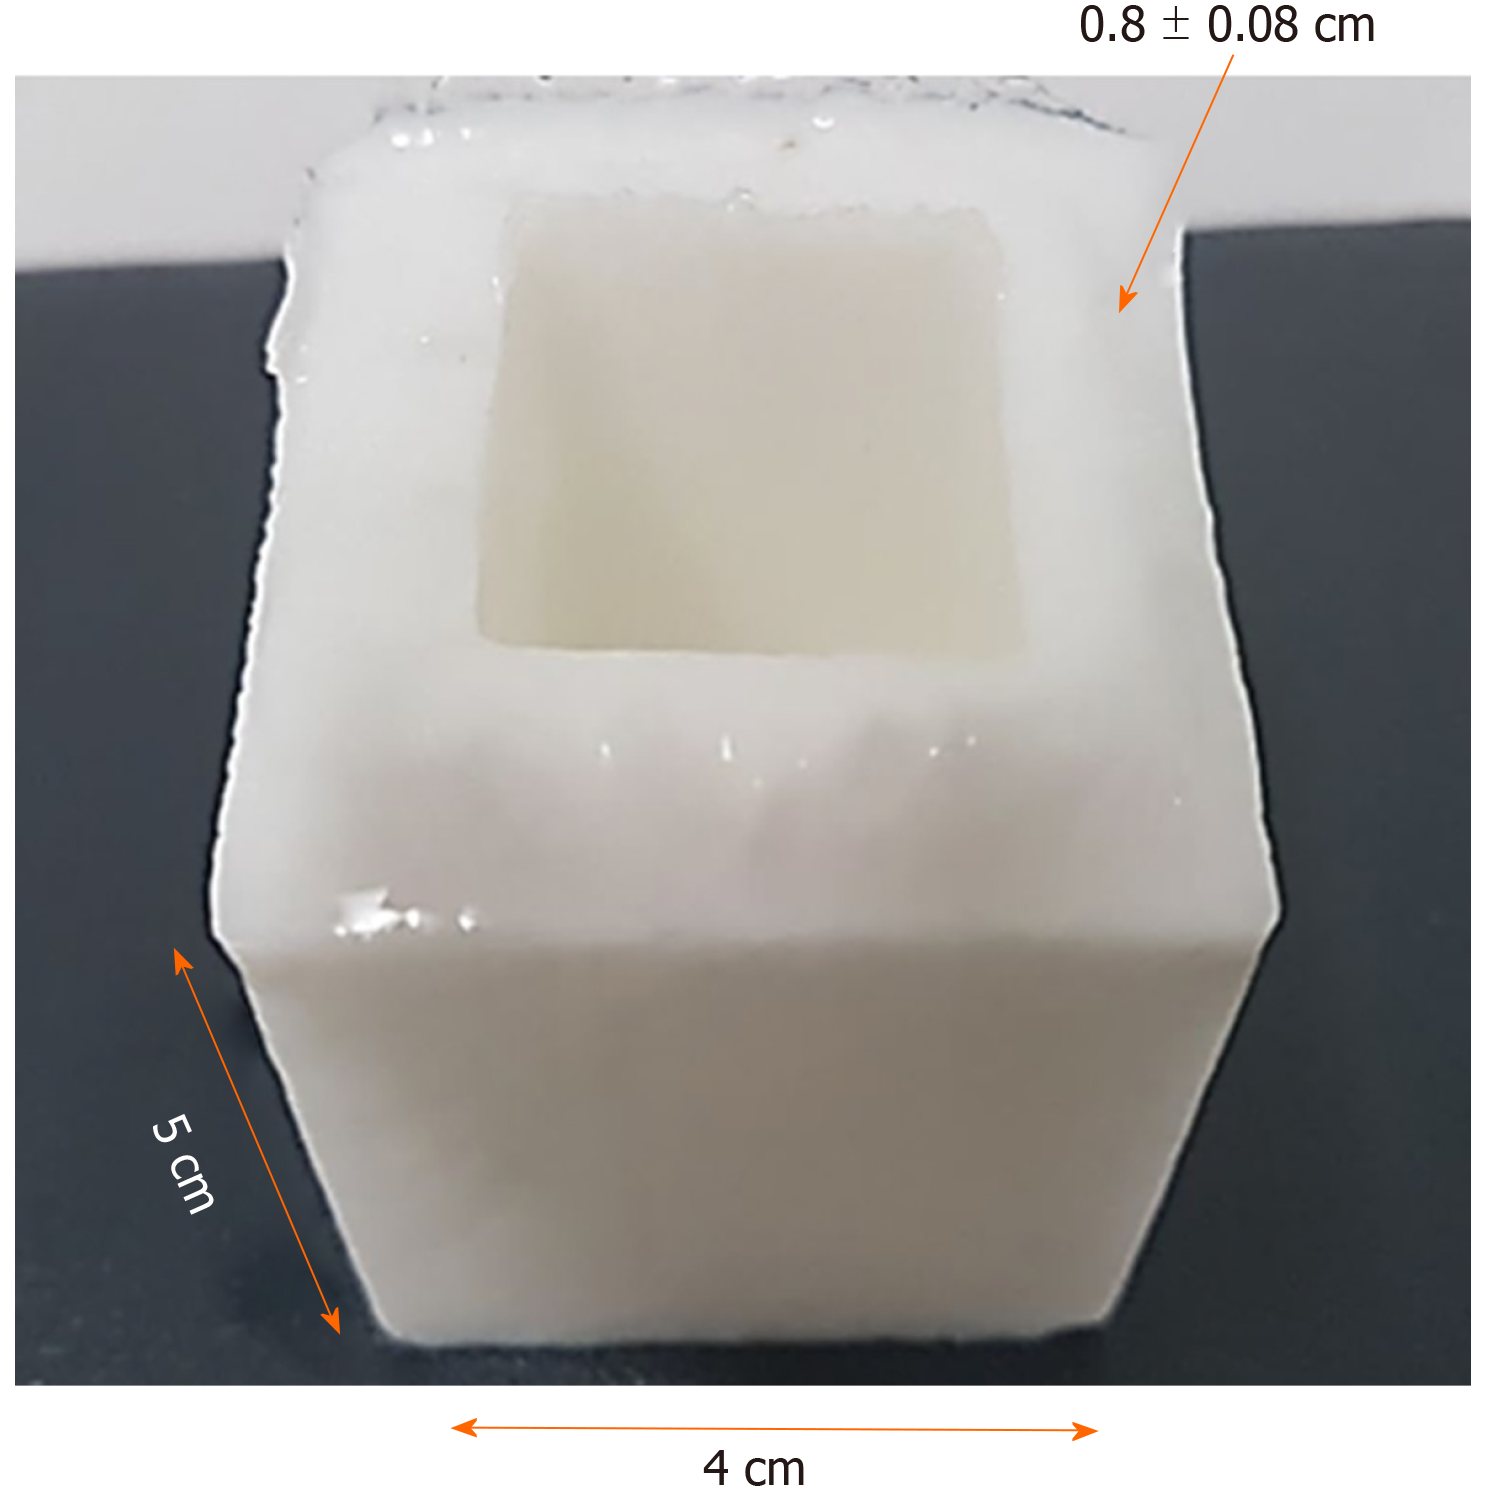
Figure 1 Stainless steel mold used to obtain polyvinyl alcohol phantoms.
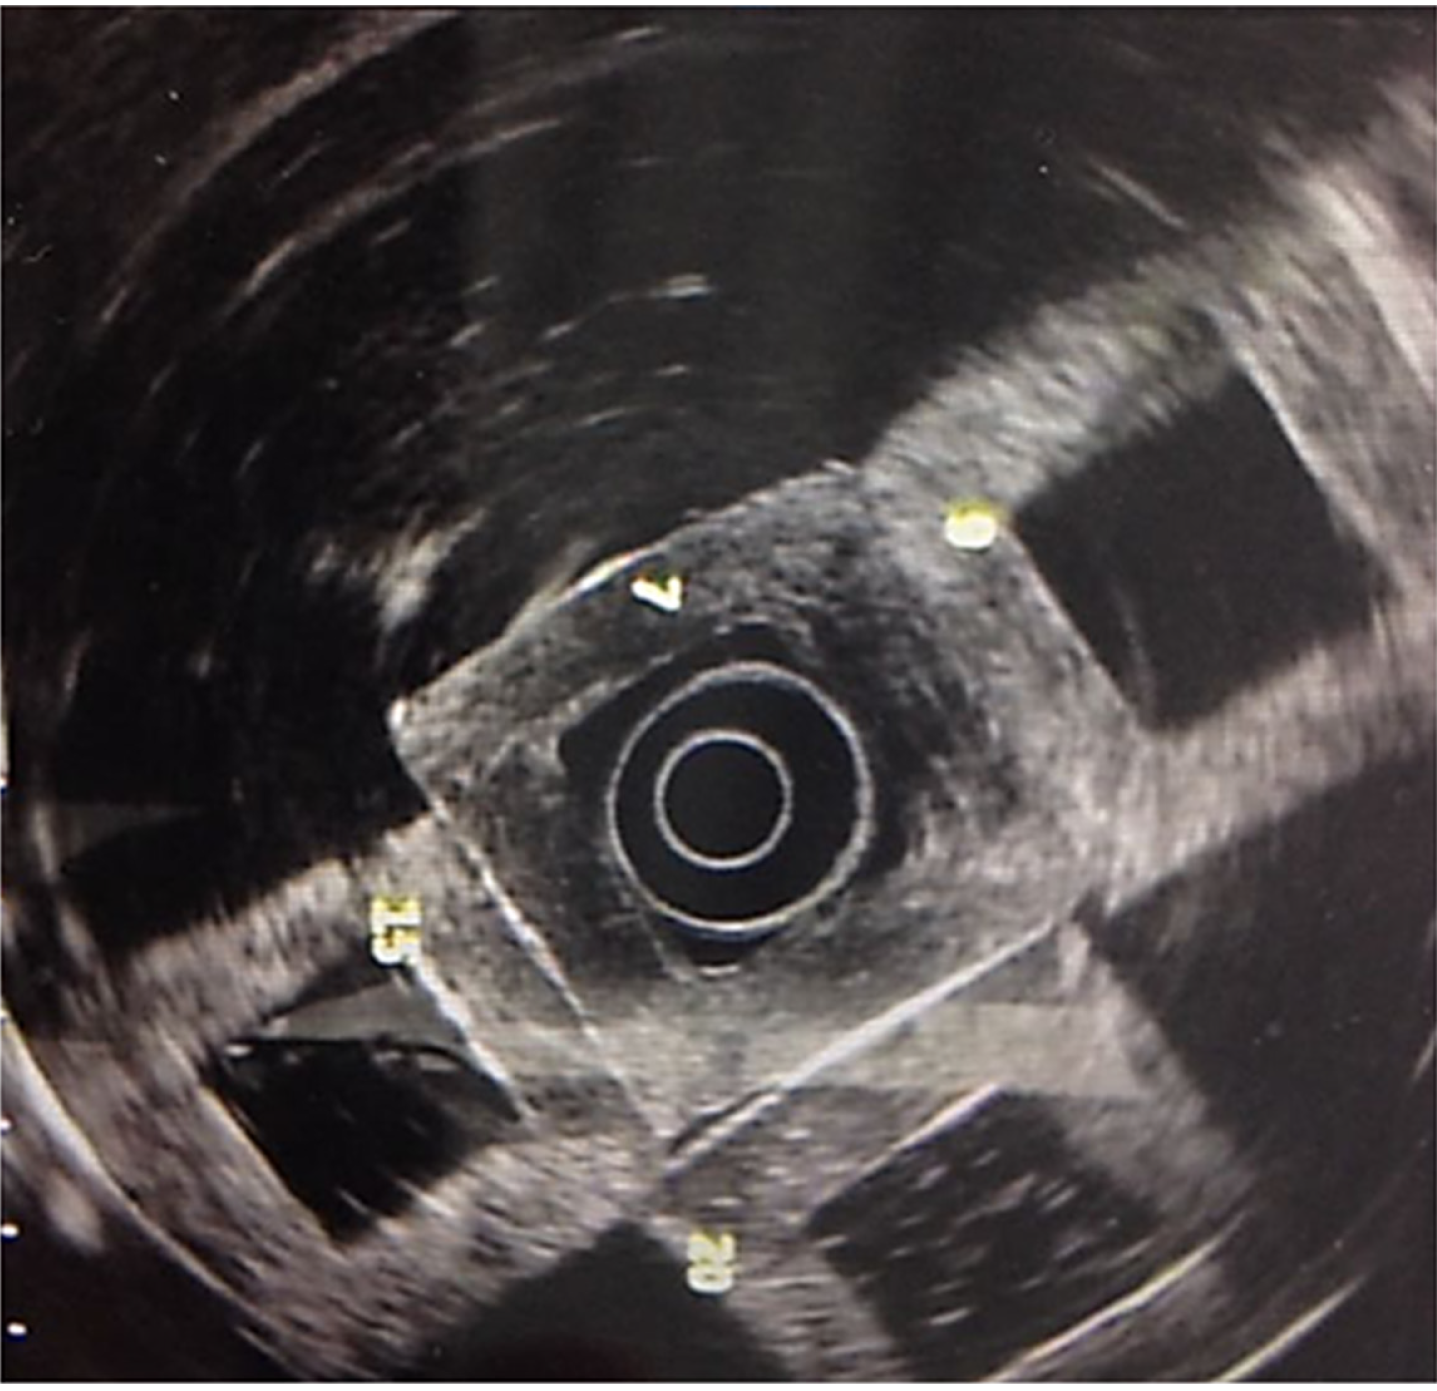
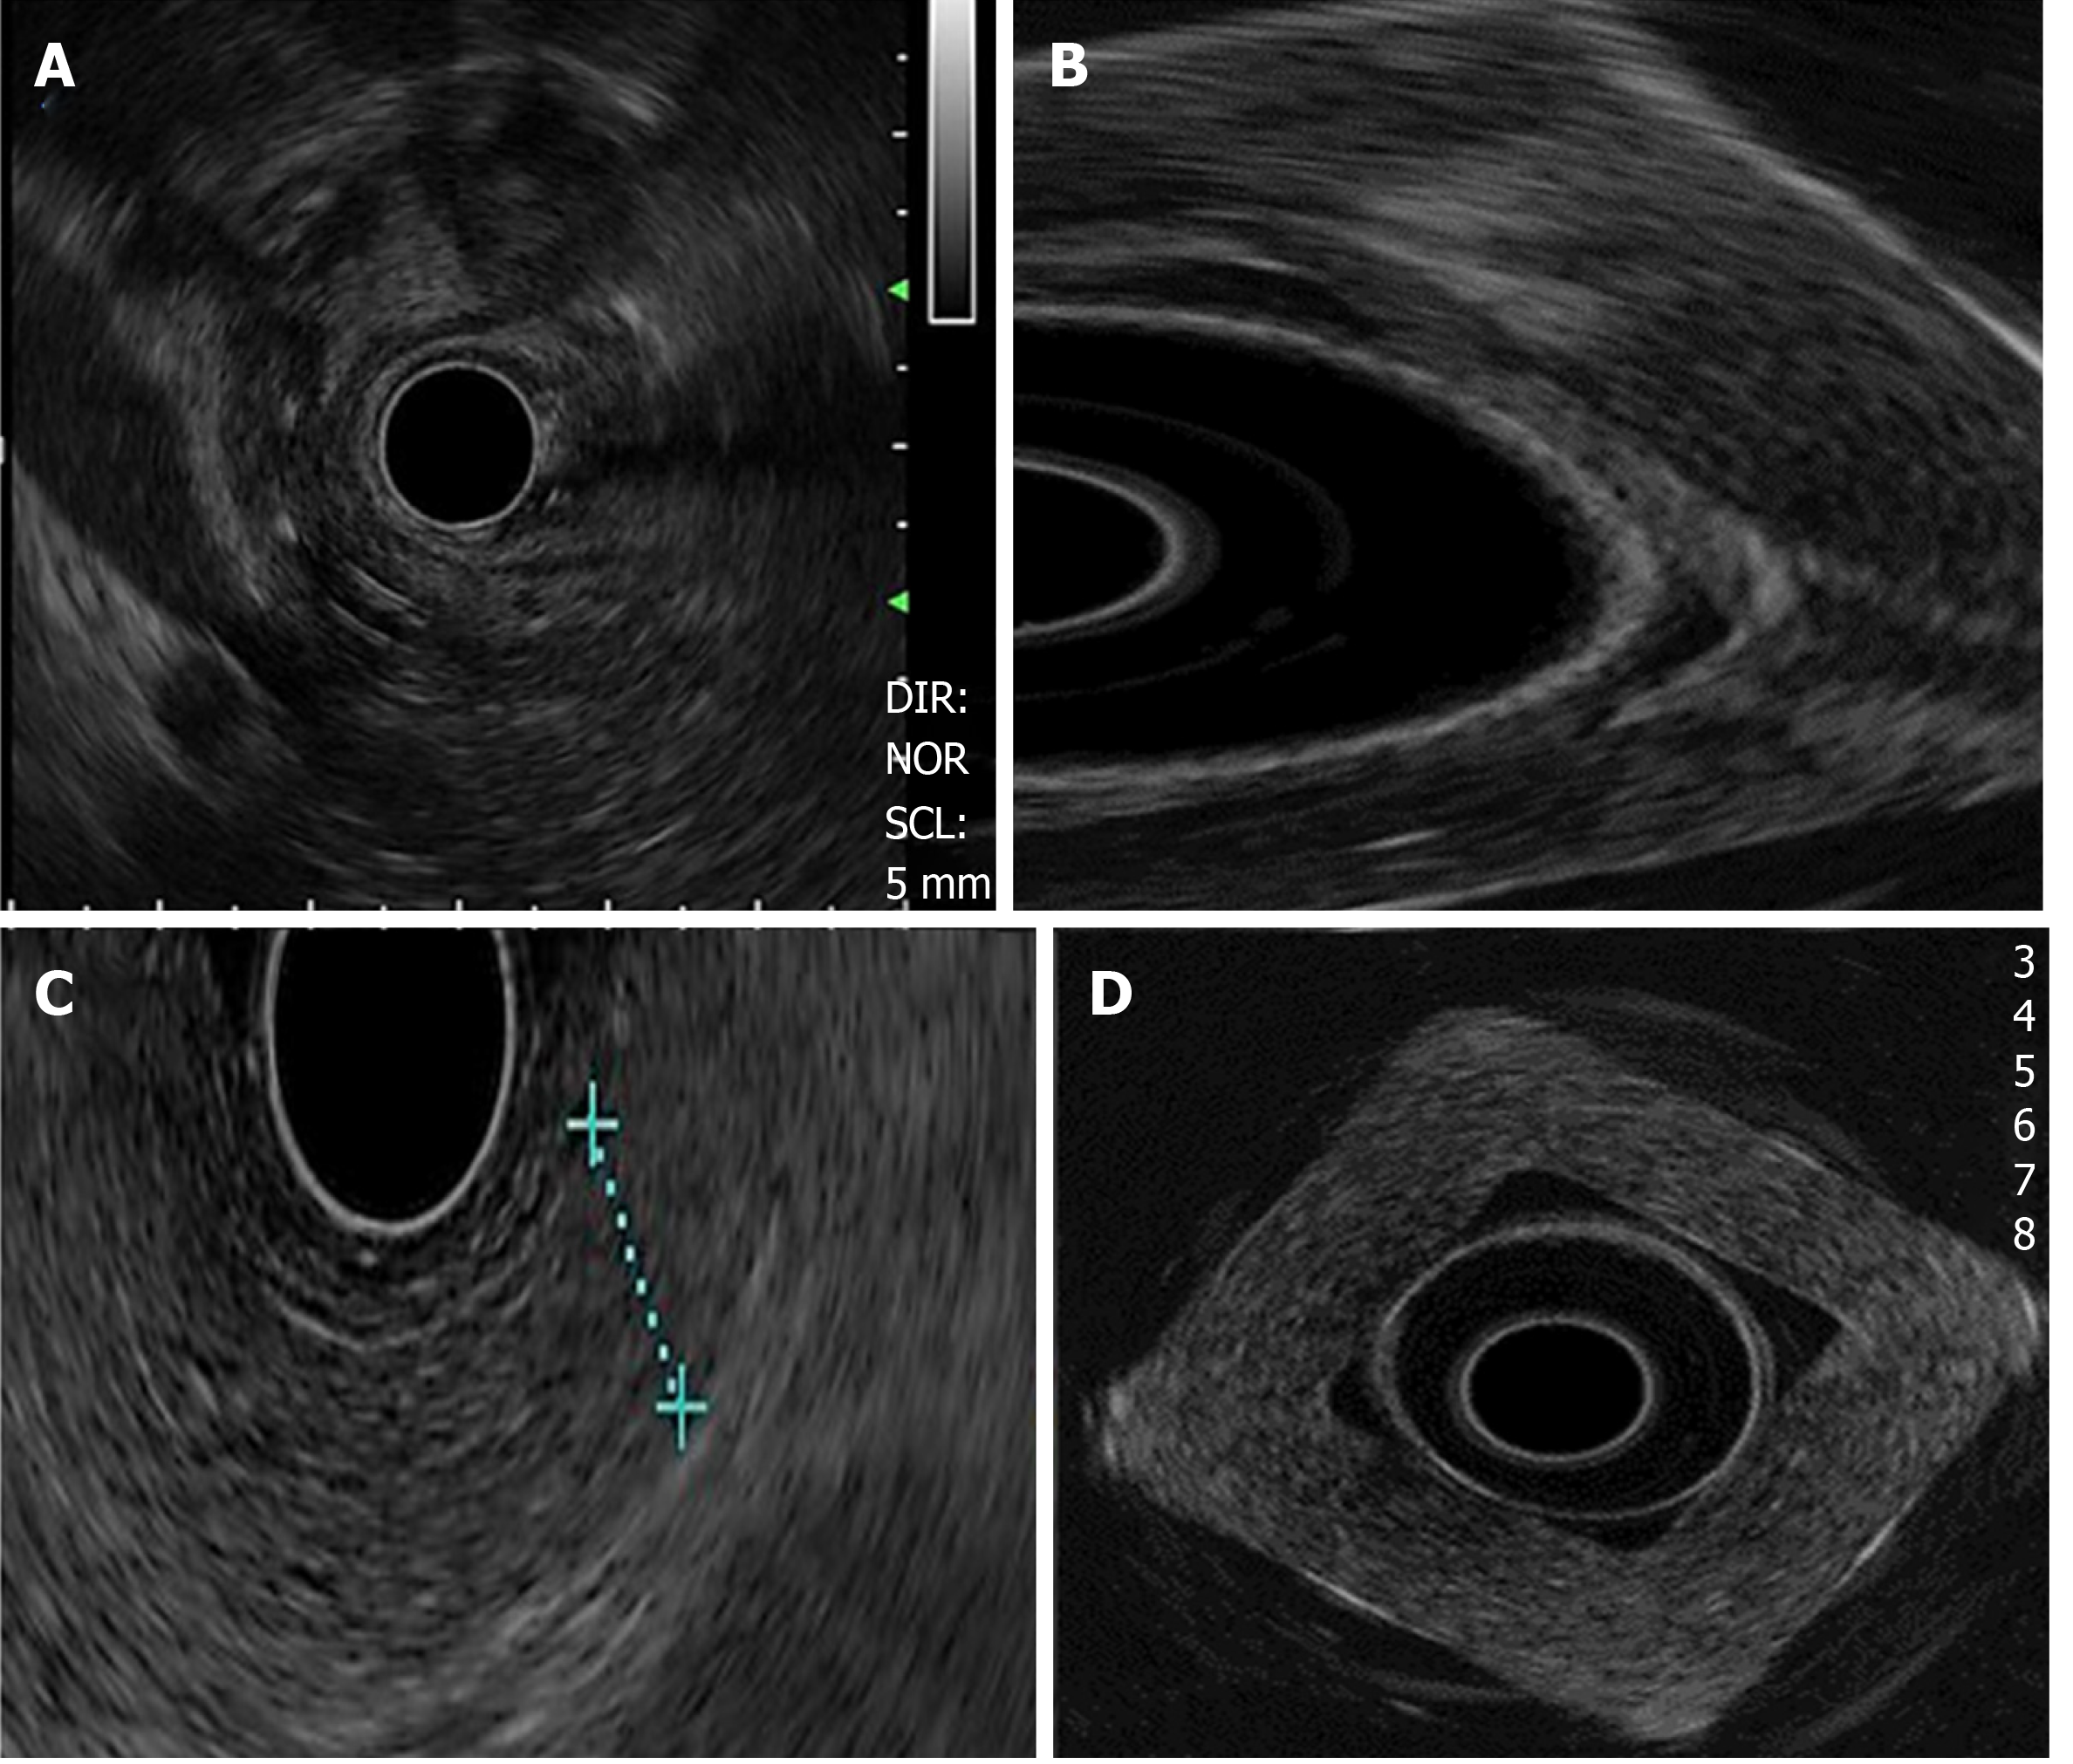
Figure 2 Endoscopic ultrasound images with the echoendoscope placed inside the polyvinyl alcohol phantom.
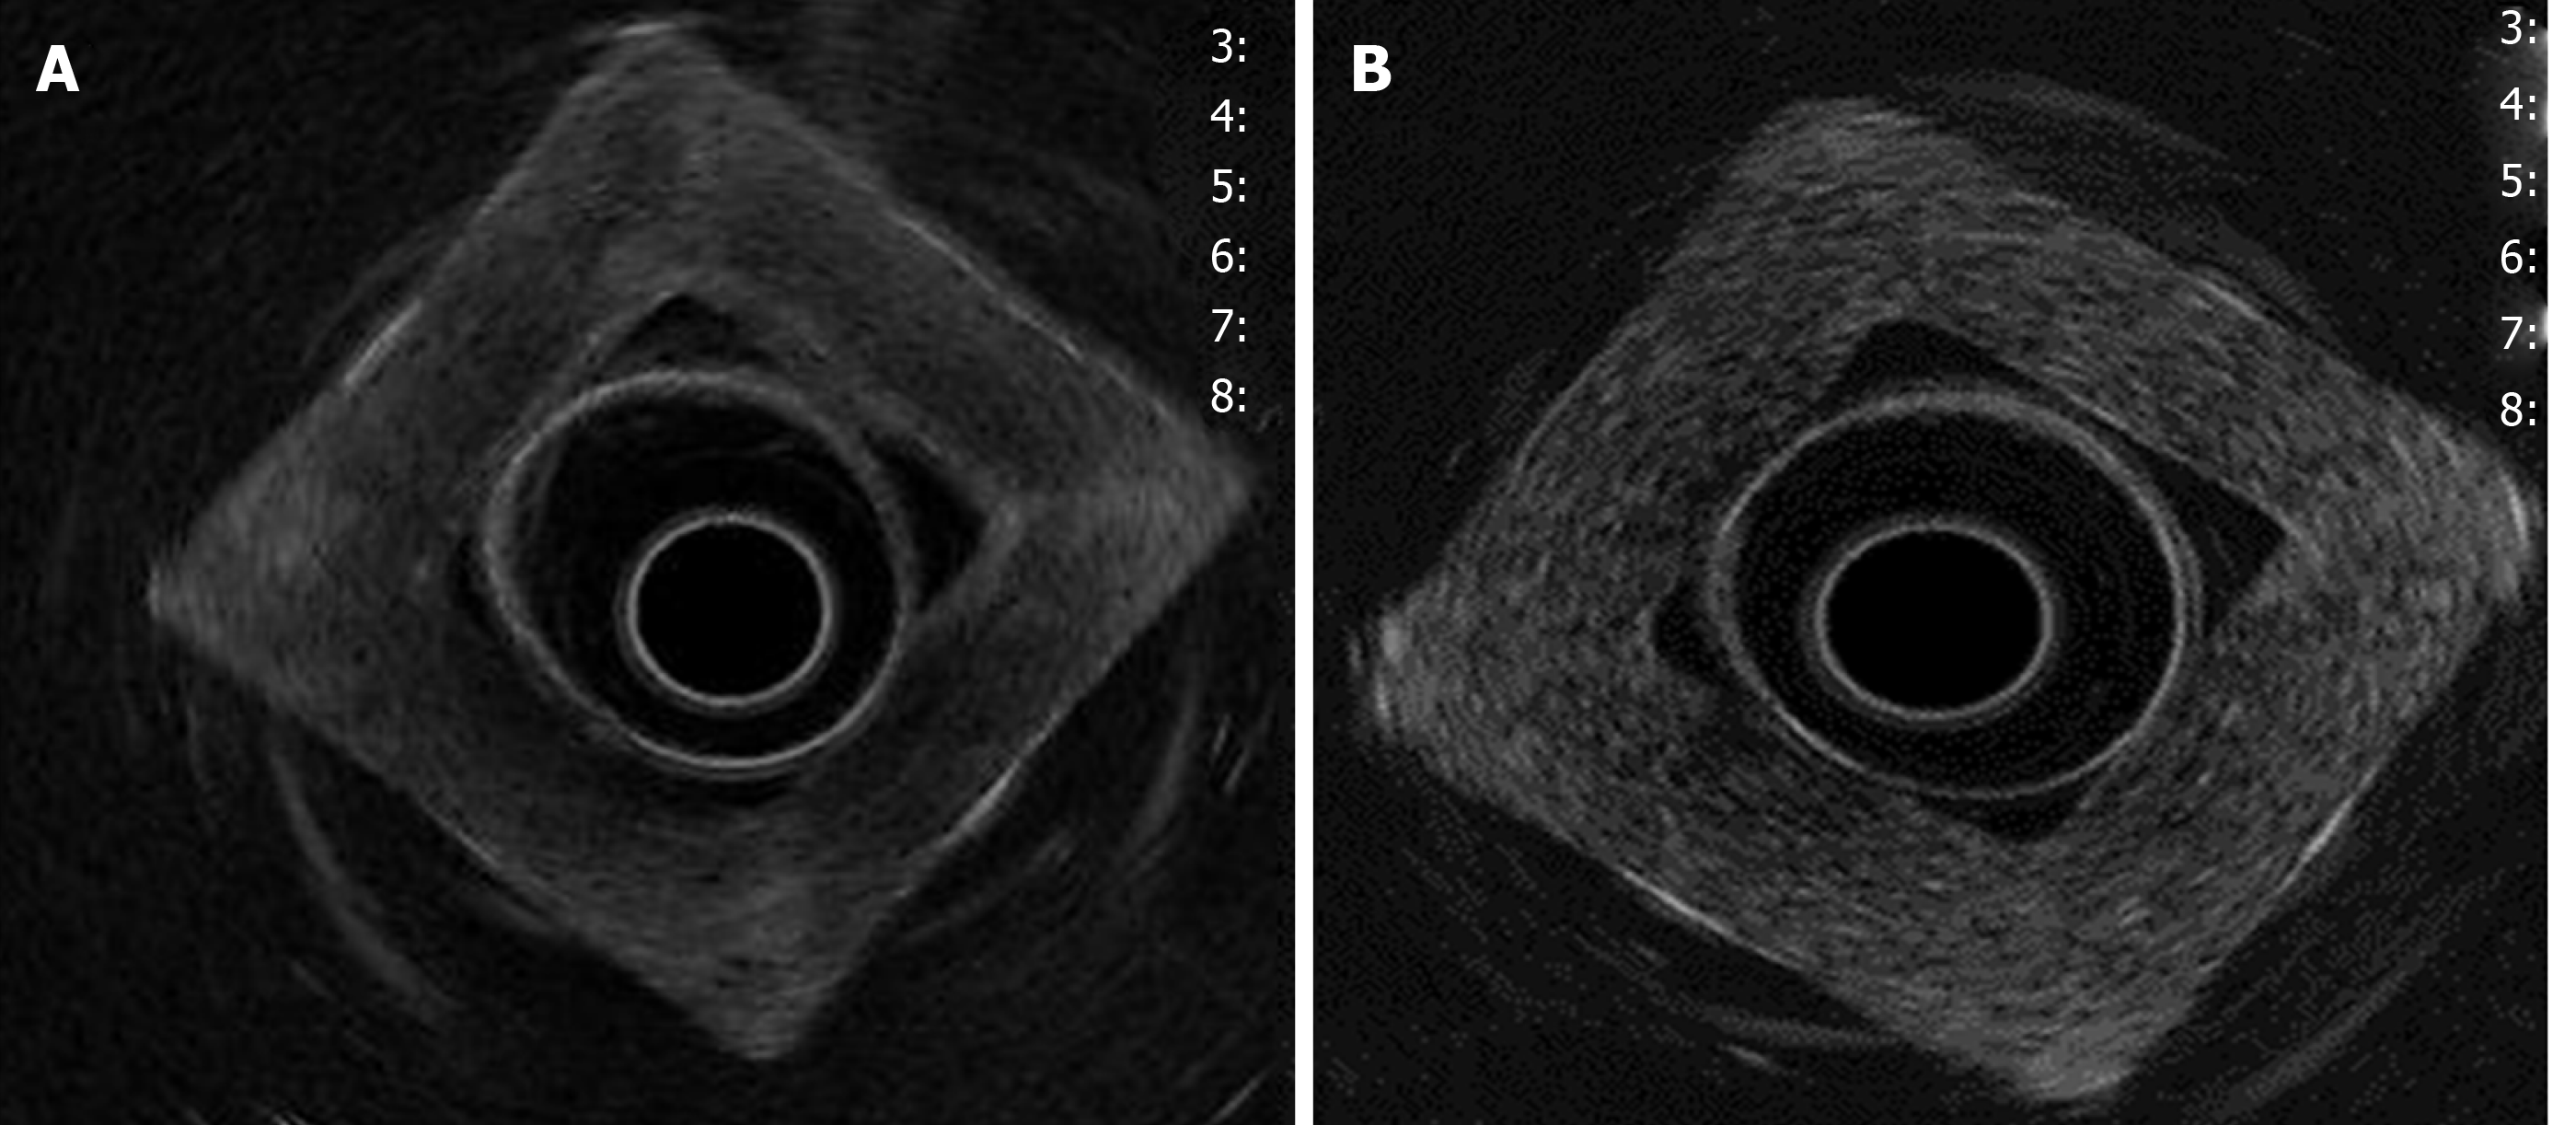
Figure 3 Comparison of endoscopic ultrasound images: A: Phantom concentration 1; B: Phantom concentration 5.
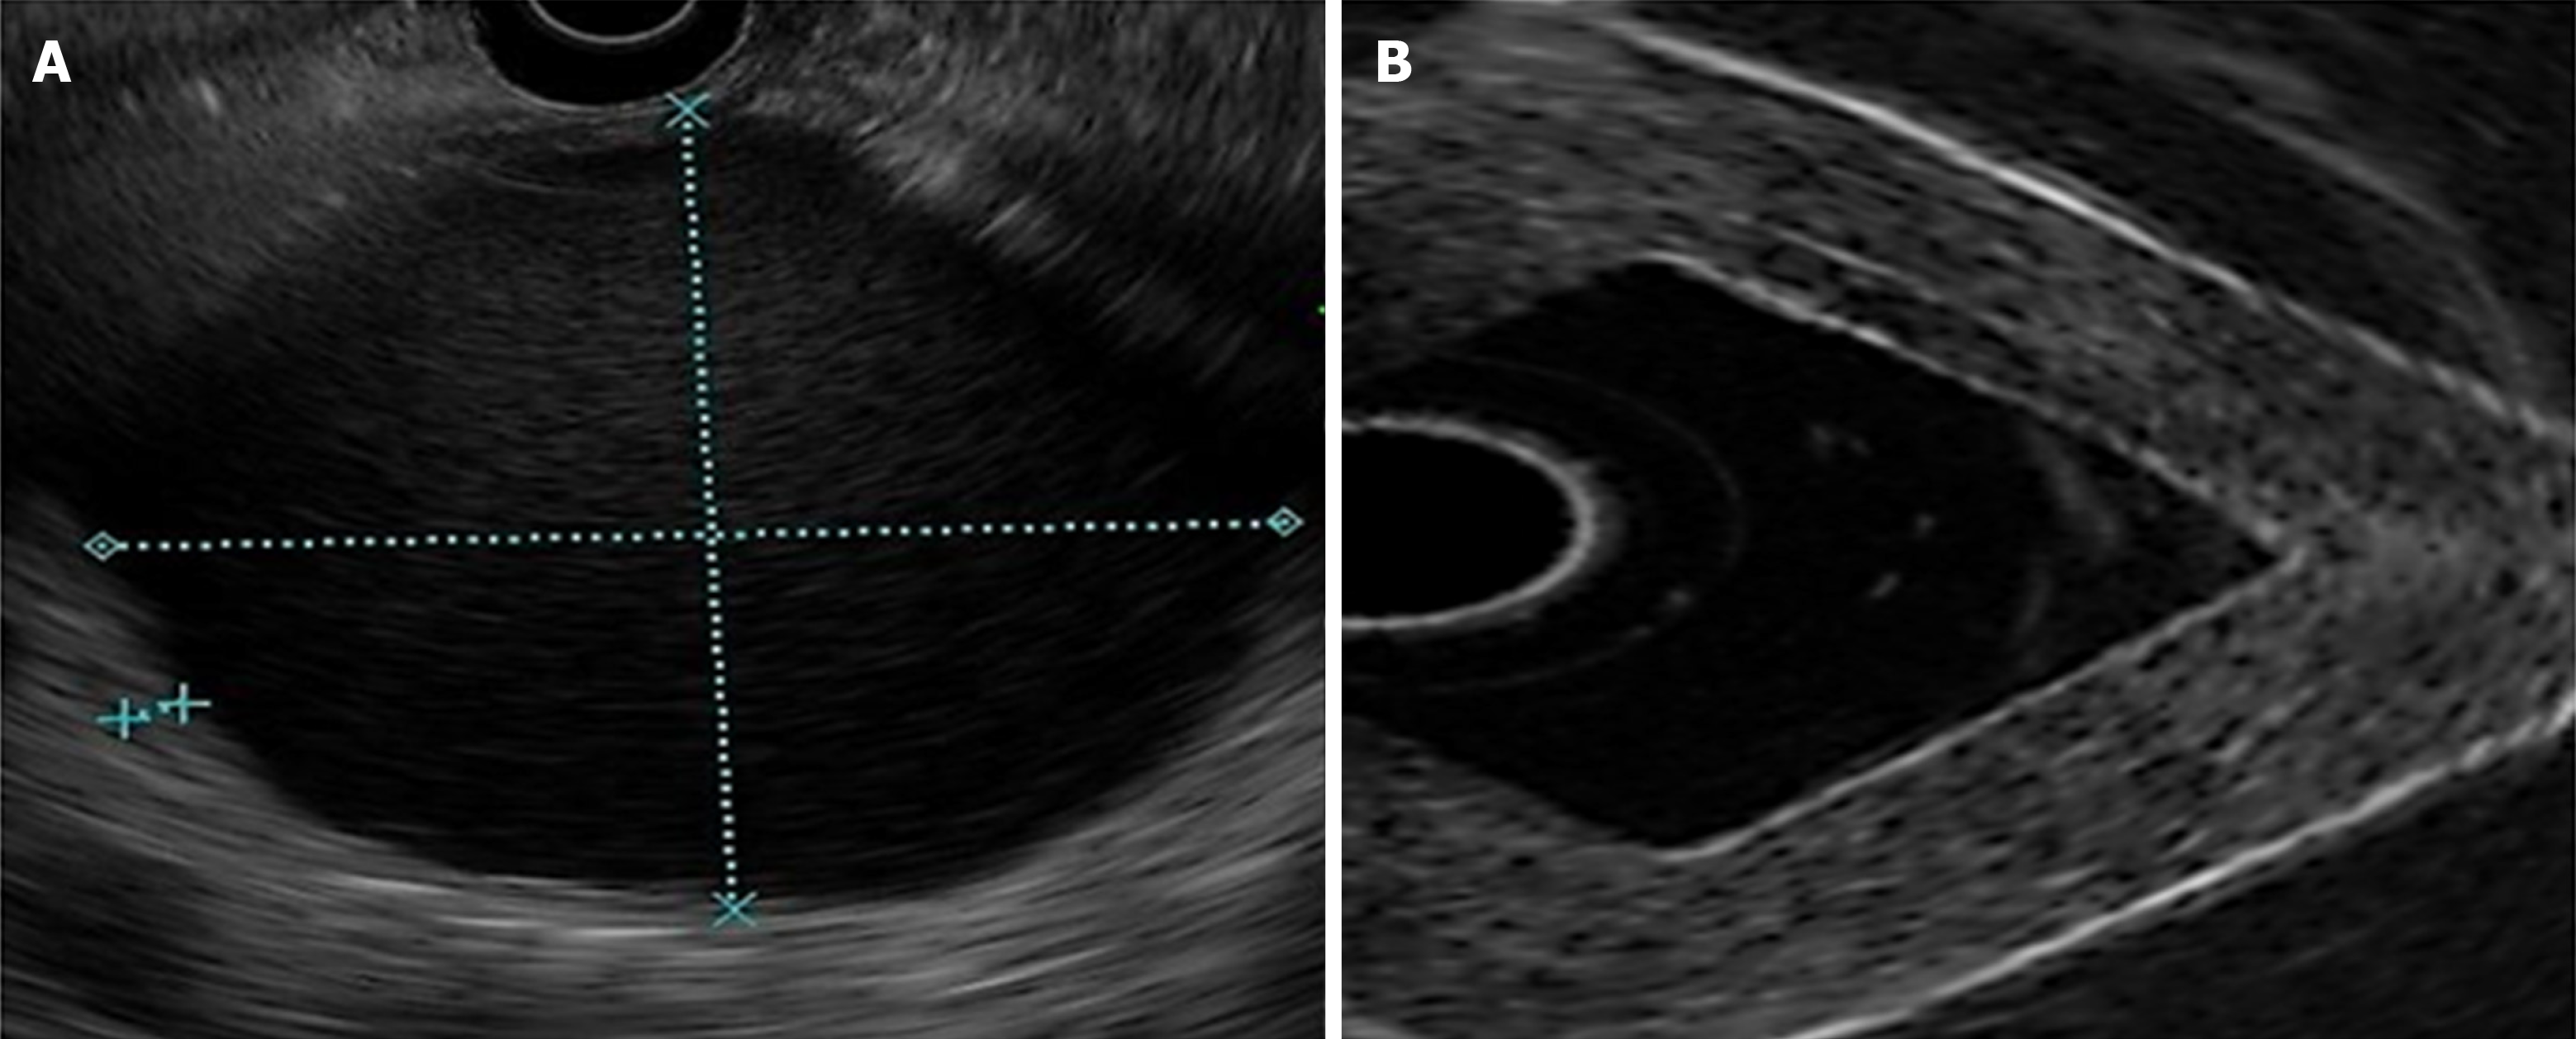
Figure 4 Type of lesions: A: Real homogeneous; B: Simulated homogeneous that refers to the liquid component inside the polyvinyl alcohol (PVA) phantom (blue arrow), surrounded by 15% PVA (concentration 9) and 20% PVA (concentration 10).
Figure 5 Type of lesions: A: Real heterogeneous lesion; B: Simulated heterogeneous lesion of hypoechoic predominance (concentration 1); C: Normal pancreatic tissue; and D: Simulated homogeneous image: phantom with 20% polyvinyl alcohol (concentration 10).
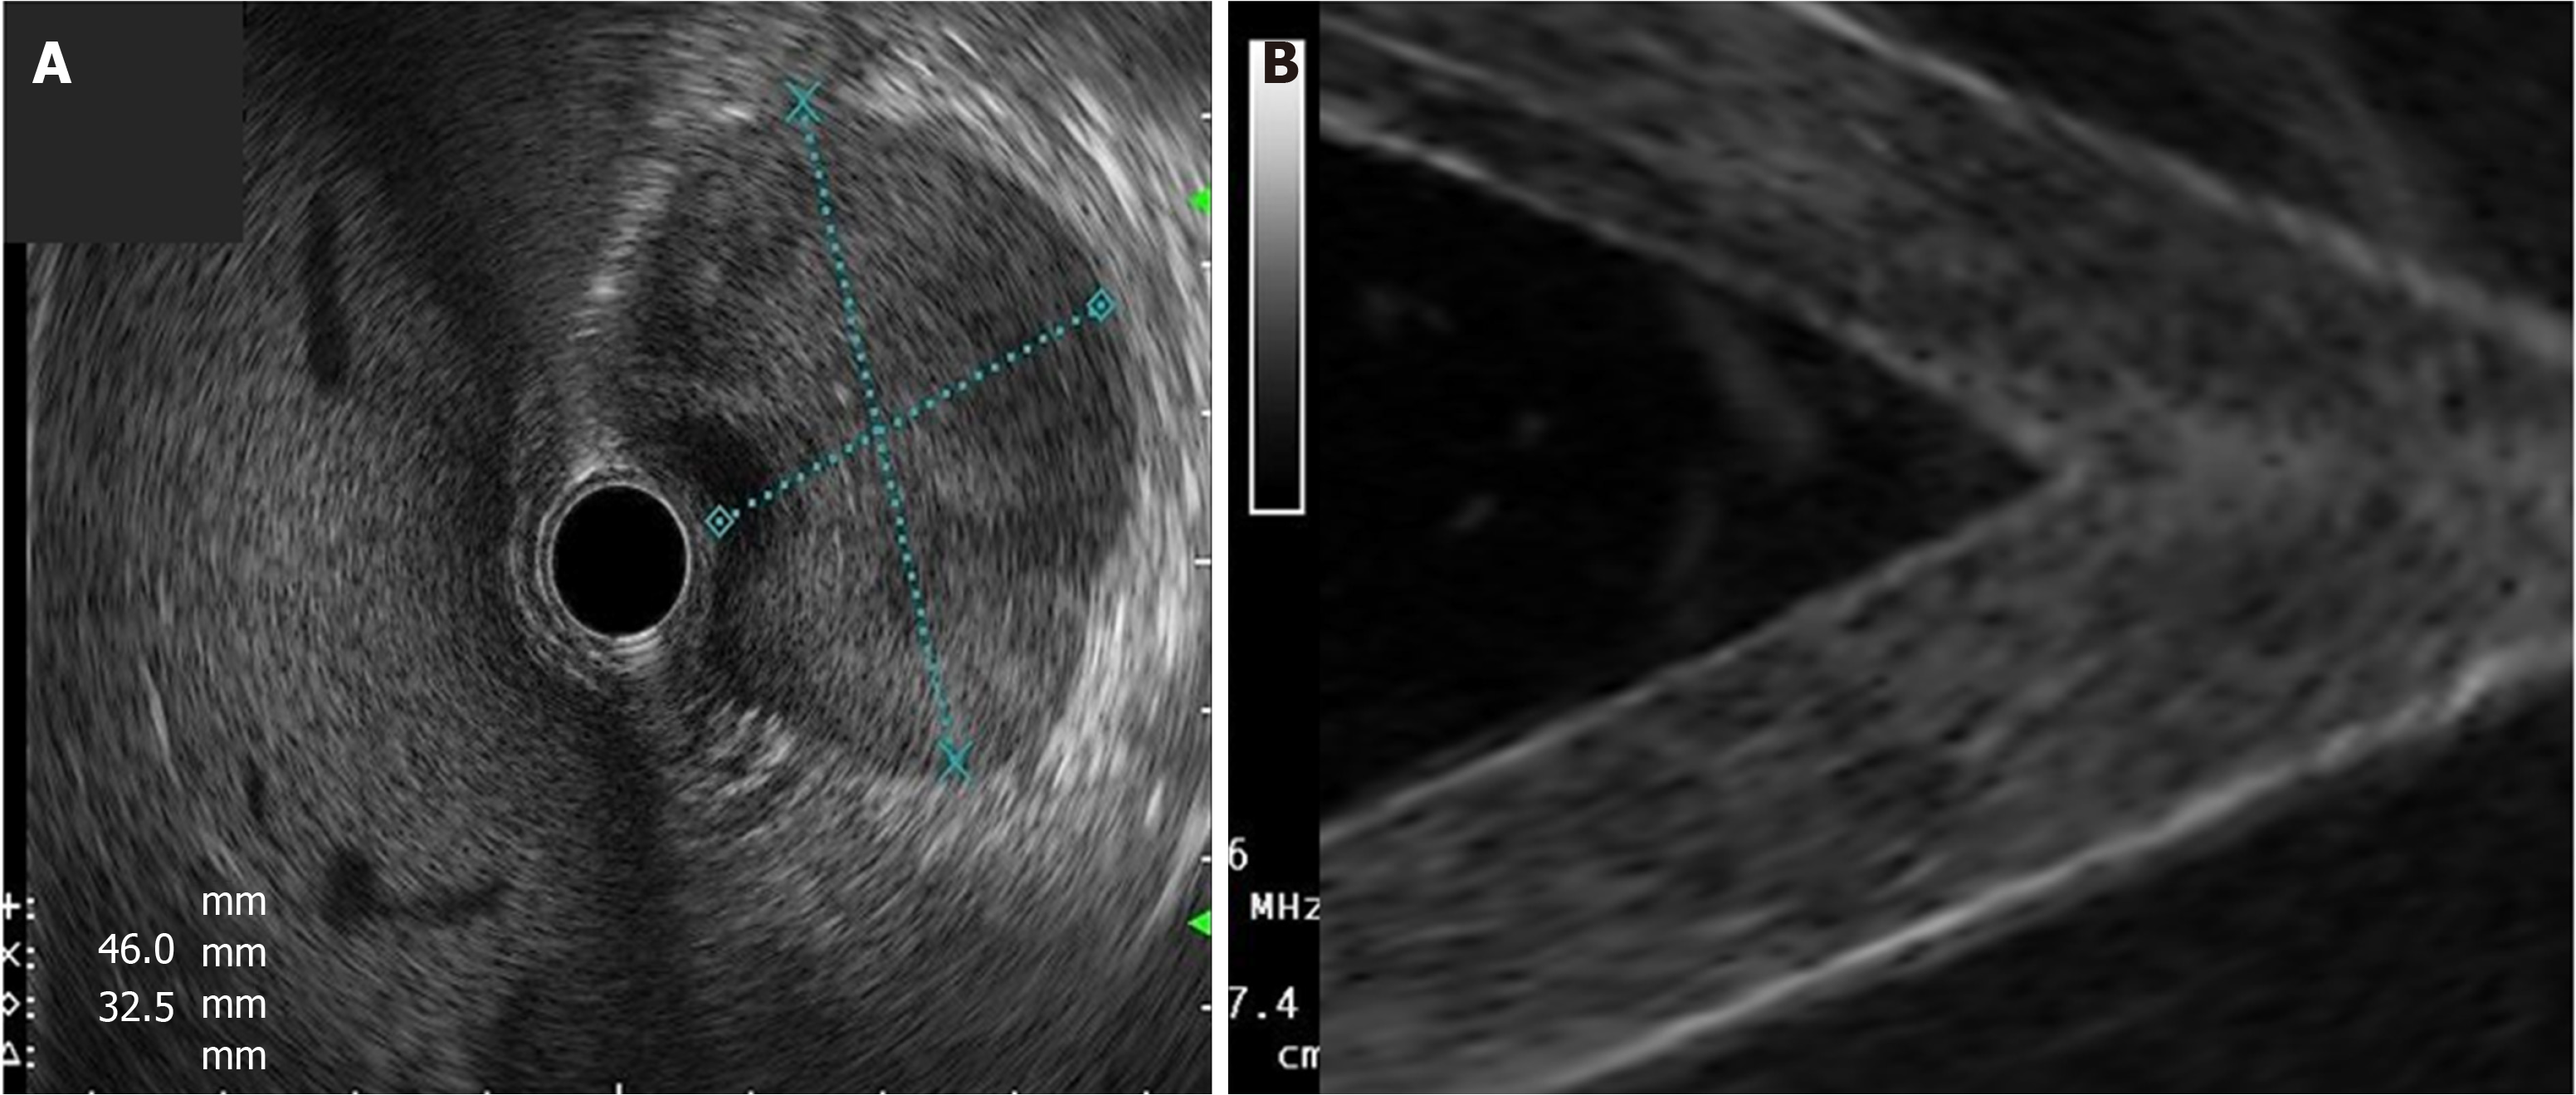
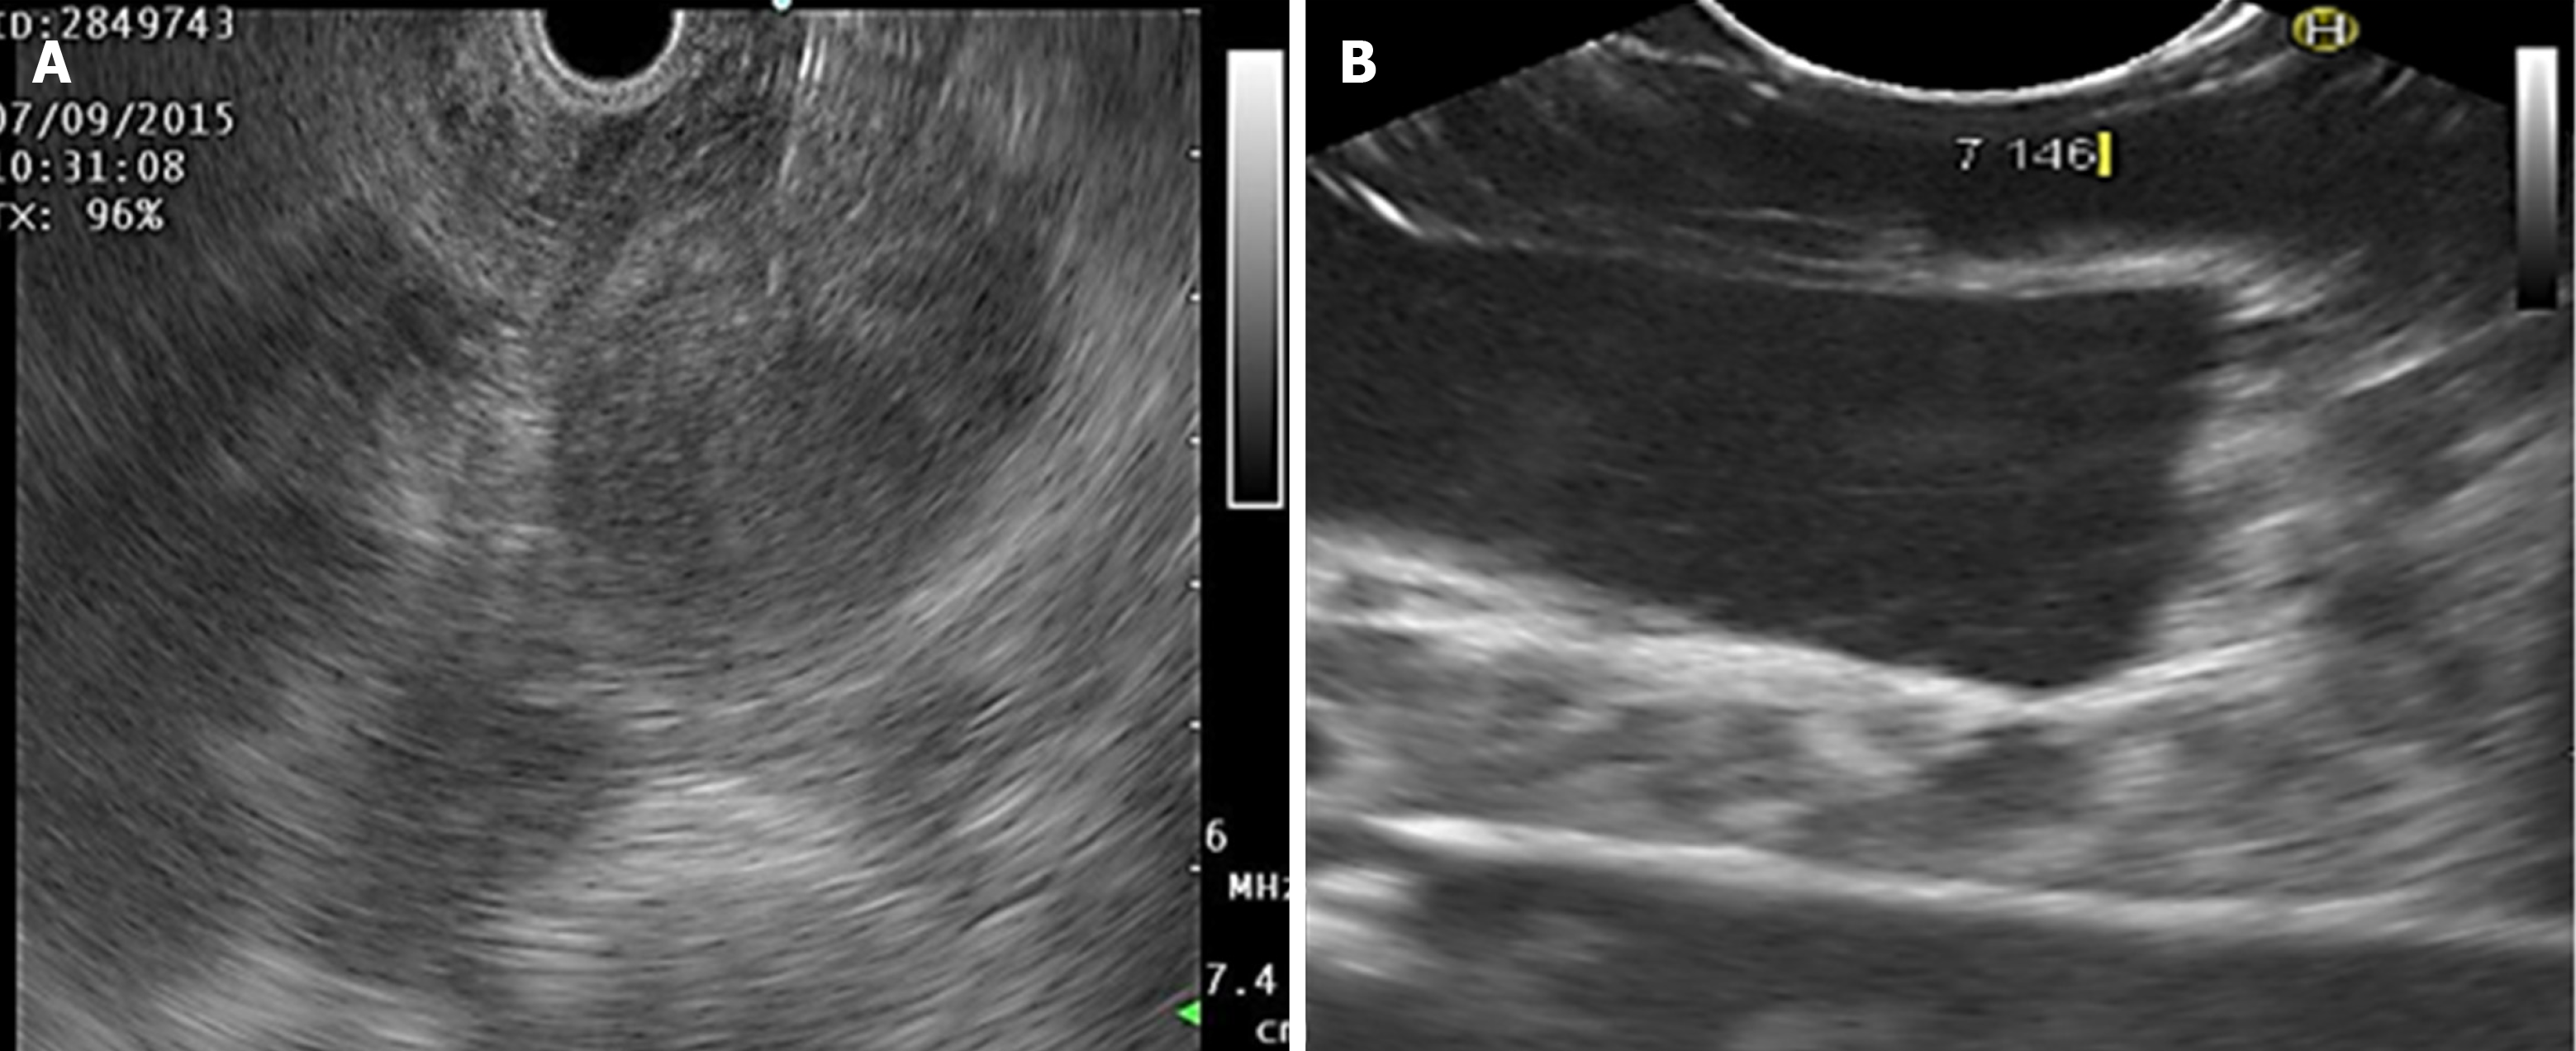
Figure 6 Cystic lesion: A: A hypoechoic image surrounded by a hyperechoic wall is visible, which produces a posterior reinforcement compatible with a pseudocyst of the pancreas (real image); and B: Endoscopic ultrasound contrast of the interior and exterior of the polyvinyl alcohol phantom (concentration 10): A hypoechoic image (inside) surrounded by a hyperechoic image (wall).
Figure 7 Solid lesion: A: Real; and B: Simulated (concentration 10).
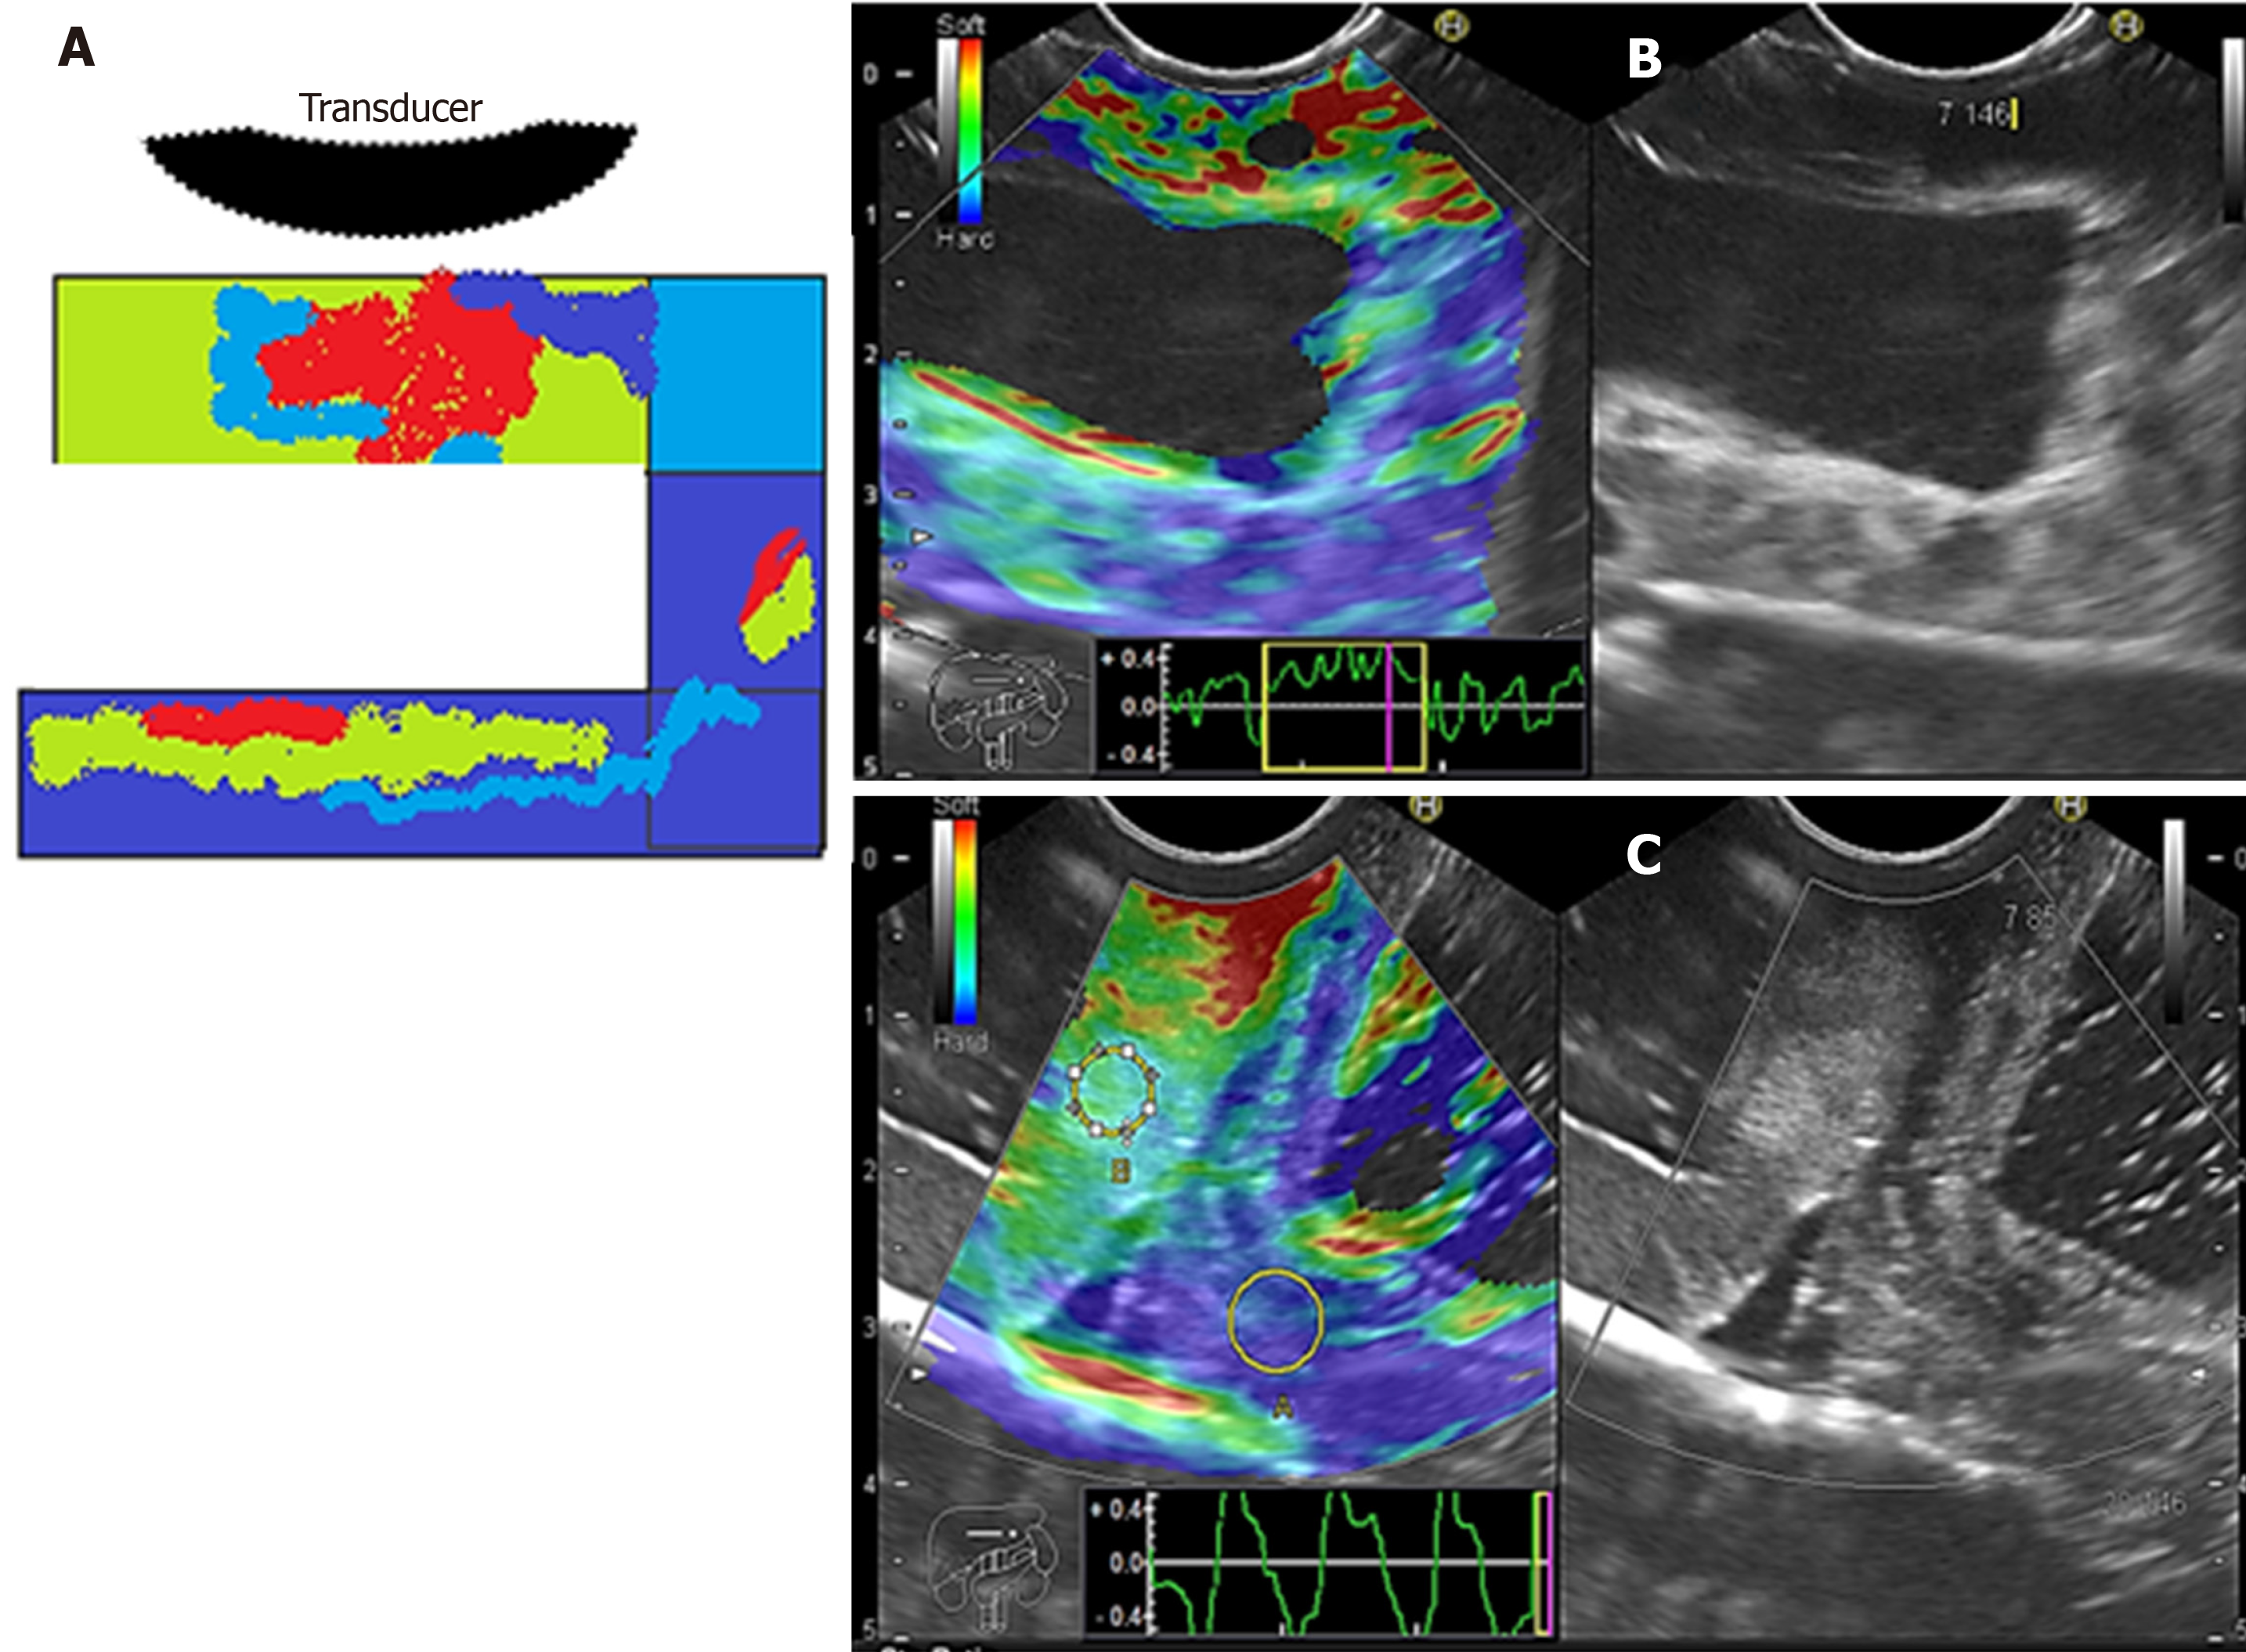
Figure 8 Elastographic images.
A: Diagram showing color distribution; B: Color scale (elastography) of phantom concentration (C) 6; and C: Contrast between phantom C6 (green hue) molecular weight 2 = 146000– 186000 vs phantom C5 (dark blue hue) with molecular weight 1 = 85000 – 124000.
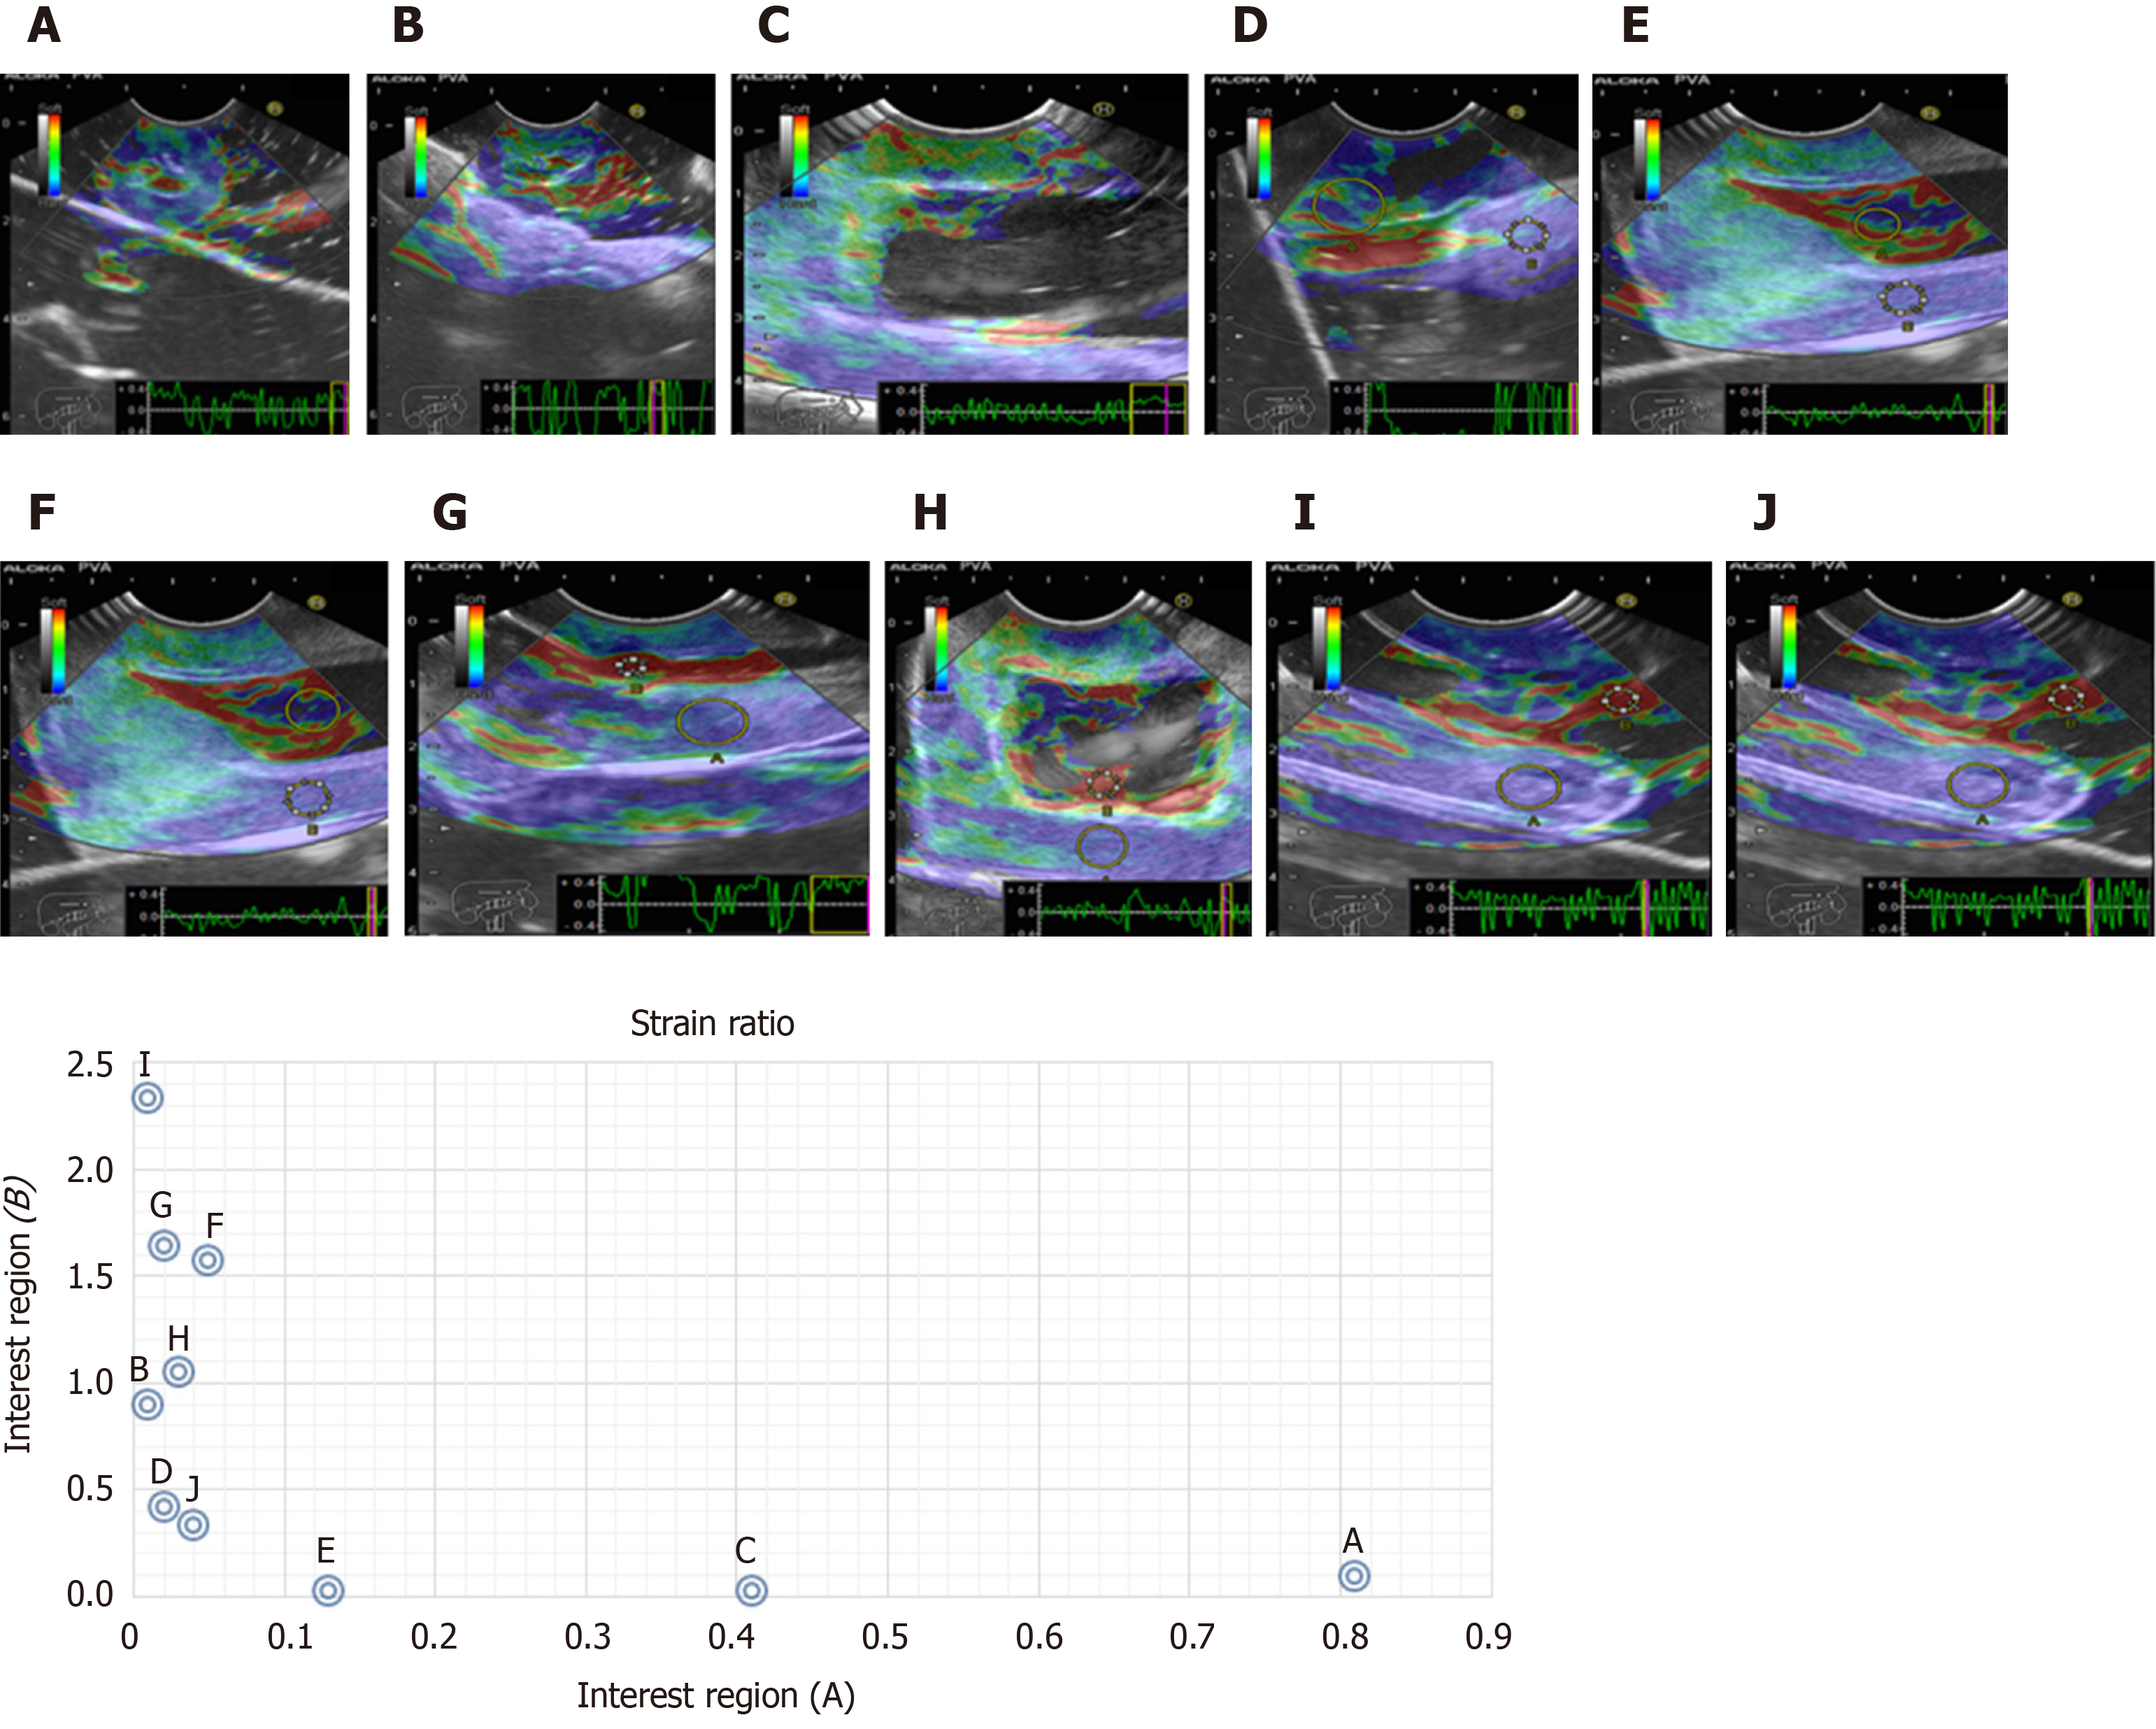
Figure 9 Relationship between the region of interest A and B and the (B/A) strain ratio.
- Citation: Galvis-García ES, Sobrino-Cossío S, Reding-Bernal A, Contreras-Marín Y, Solórzano-Acevedo K, González-Zavala P, Quispe-Siccha RM. Experimental model standardizing polyvinyl alcohol hydrogel to simulate endoscopic ultrasound and endoscopic ultrasound-elastography. World J Gastroenterol 2020; 26(34): 5169-5180
- URL: https://www.wjgnet.com/1007-9327/full/v26/i34/5169.htm
- DOI: https://dx.doi.org/10.3748/wjg.v26.i34.5169


