Copyright
©The Author(s) 2020.
World J Gastroenterol. Sep 14, 2020; 26(34): 5169-5180
Published online Sep 14, 2020. doi: 10.3748/wjg.v26.i34.5169
Published online Sep 14, 2020. doi: 10.3748/wjg.v26.i34.5169
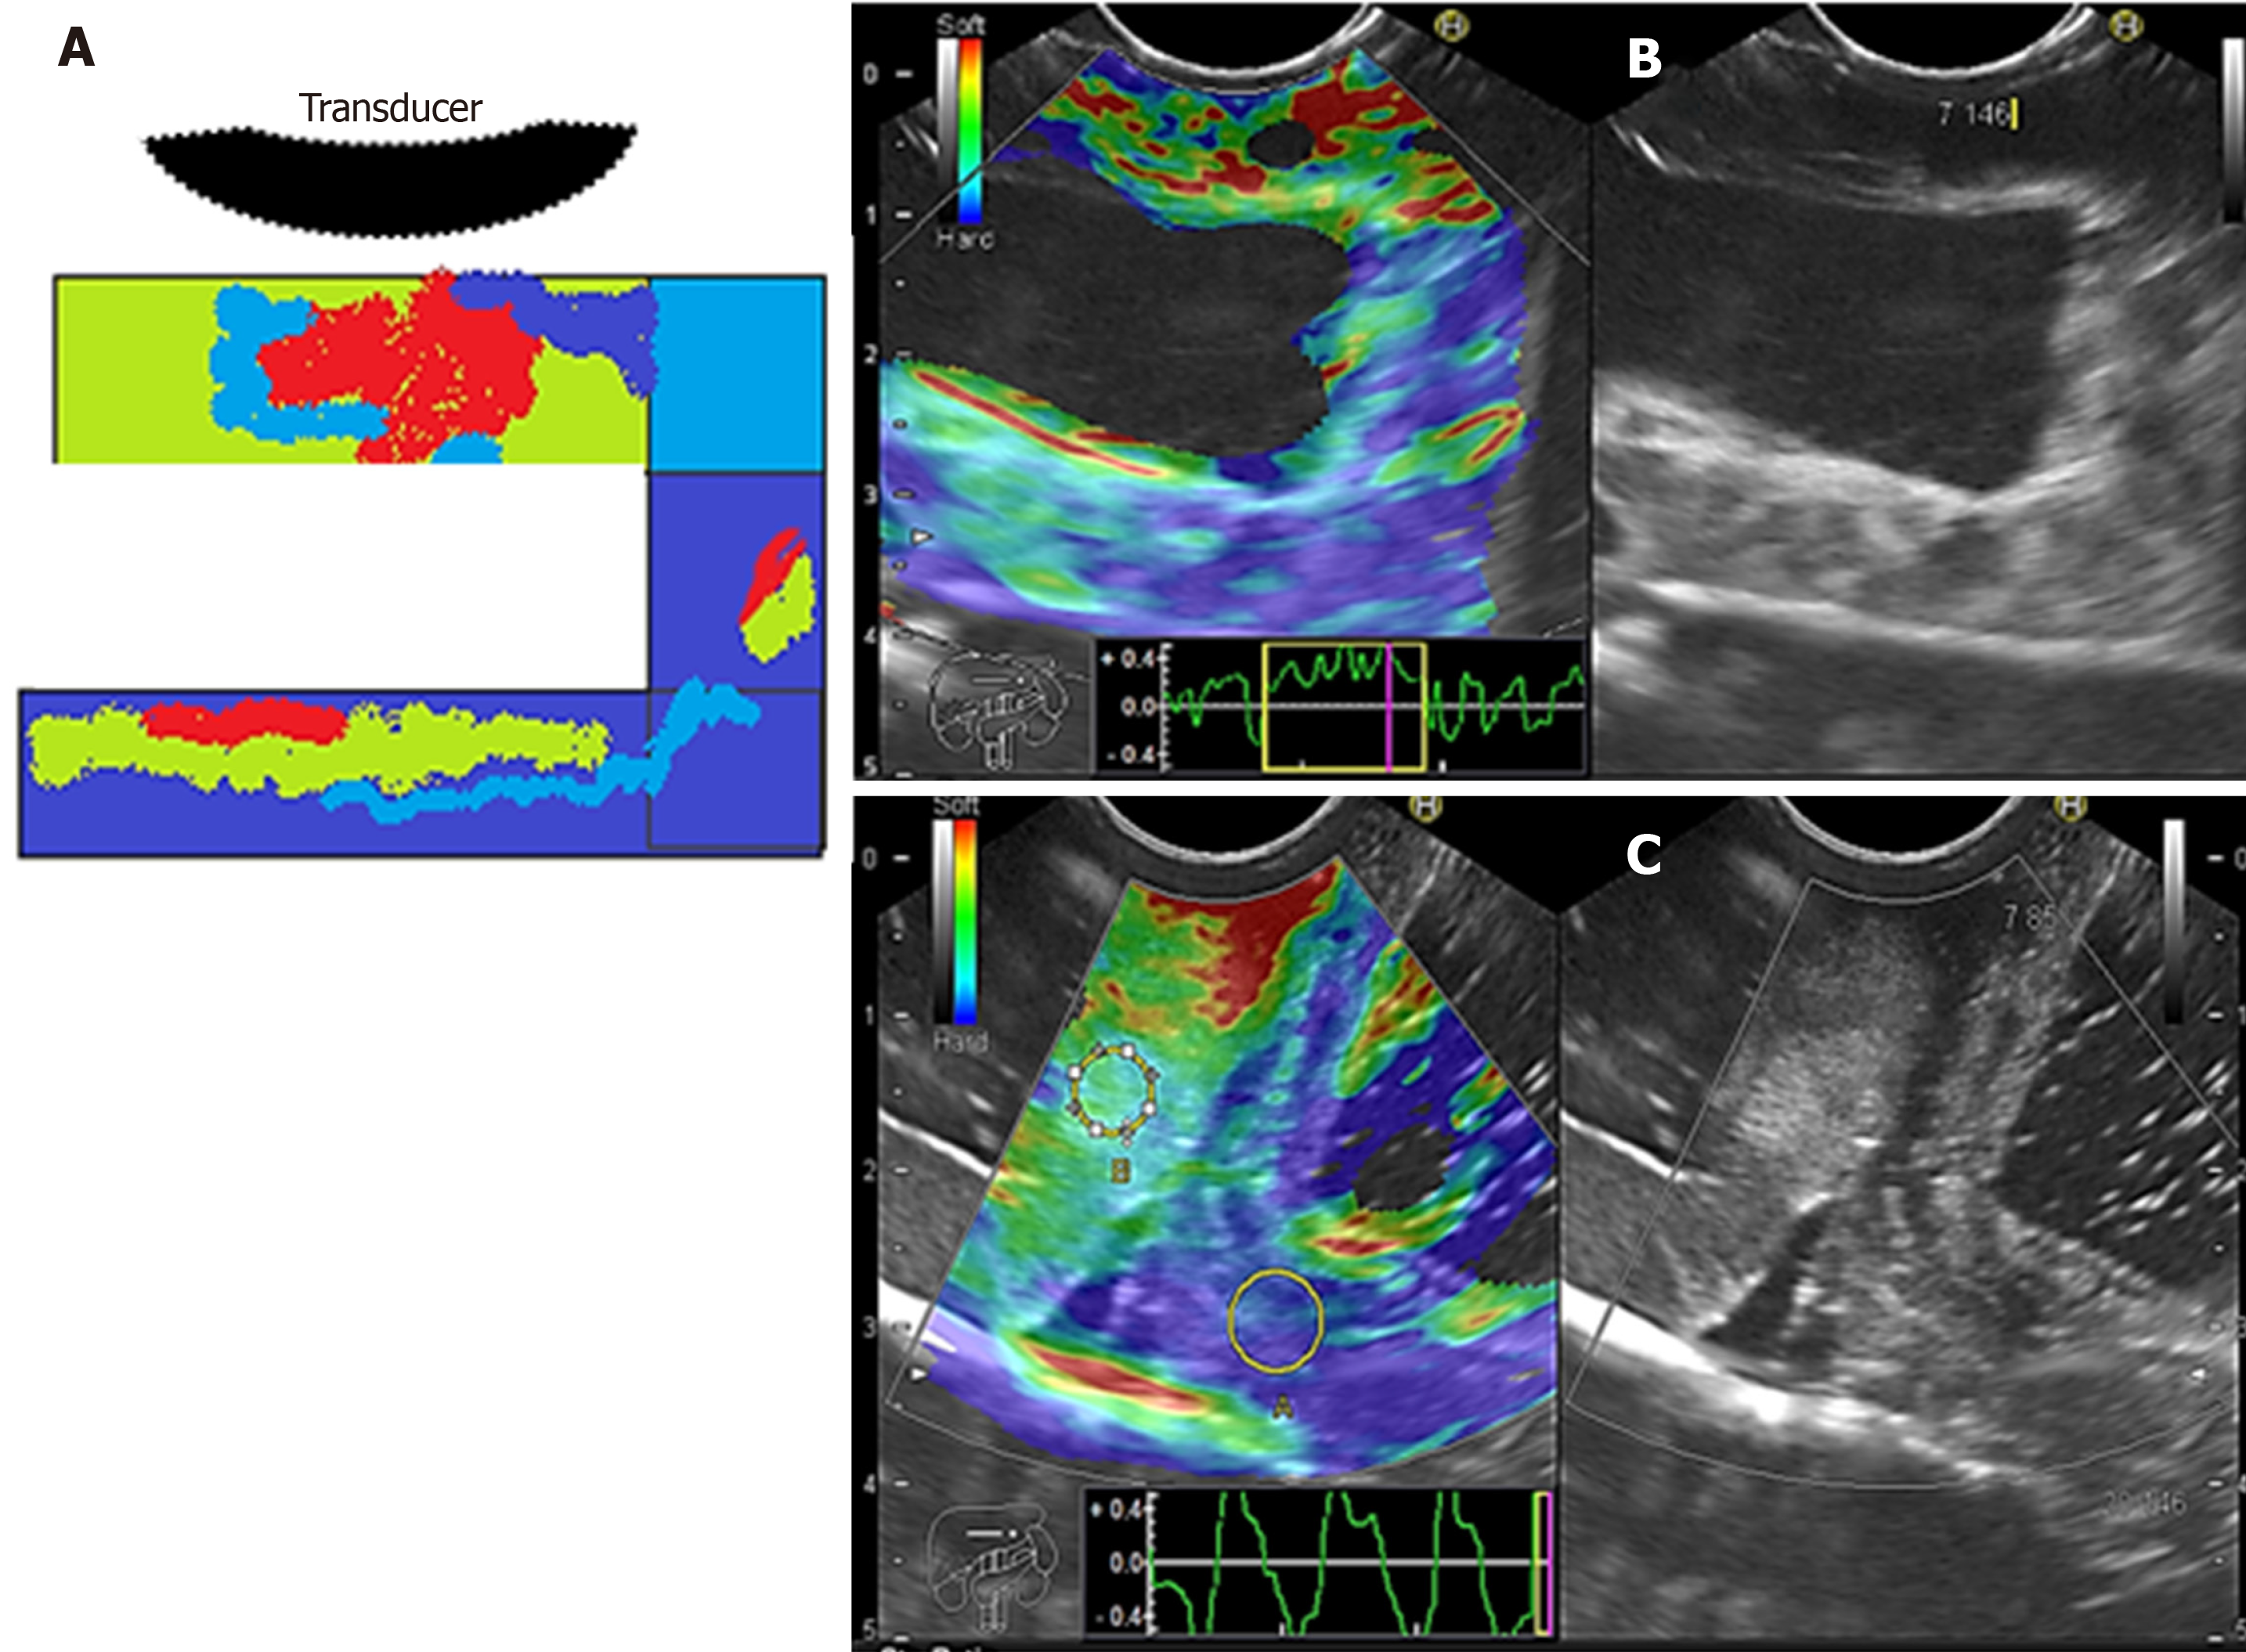
Figure 8 Elastographic images.
A: Diagram showing color distribution; B: Color scale (elastography) of phantom concentration (C) 6; and C: Contrast between phantom C6 (green hue) molecular weight 2 = 146000– 186000 vs phantom C5 (dark blue hue) with molecular weight 1 = 85000 – 124000.
- Citation: Galvis-García ES, Sobrino-Cossío S, Reding-Bernal A, Contreras-Marín Y, Solórzano-Acevedo K, González-Zavala P, Quispe-Siccha RM. Experimental model standardizing polyvinyl alcohol hydrogel to simulate endoscopic ultrasound and endoscopic ultrasound-elastography. World J Gastroenterol 2020; 26(34): 5169-5180
- URL: https://www.wjgnet.com/1007-9327/full/v26/i34/5169.htm
- DOI: https://dx.doi.org/10.3748/wjg.v26.i34.5169


