Copyright
©The Author(s) 2020.
World J Gastroenterol. Jan 21, 2020; 26(3): 324-334
Published online Jan 21, 2020. doi: 10.3748/wjg.v26.i3.324
Published online Jan 21, 2020. doi: 10.3748/wjg.v26.i3.324
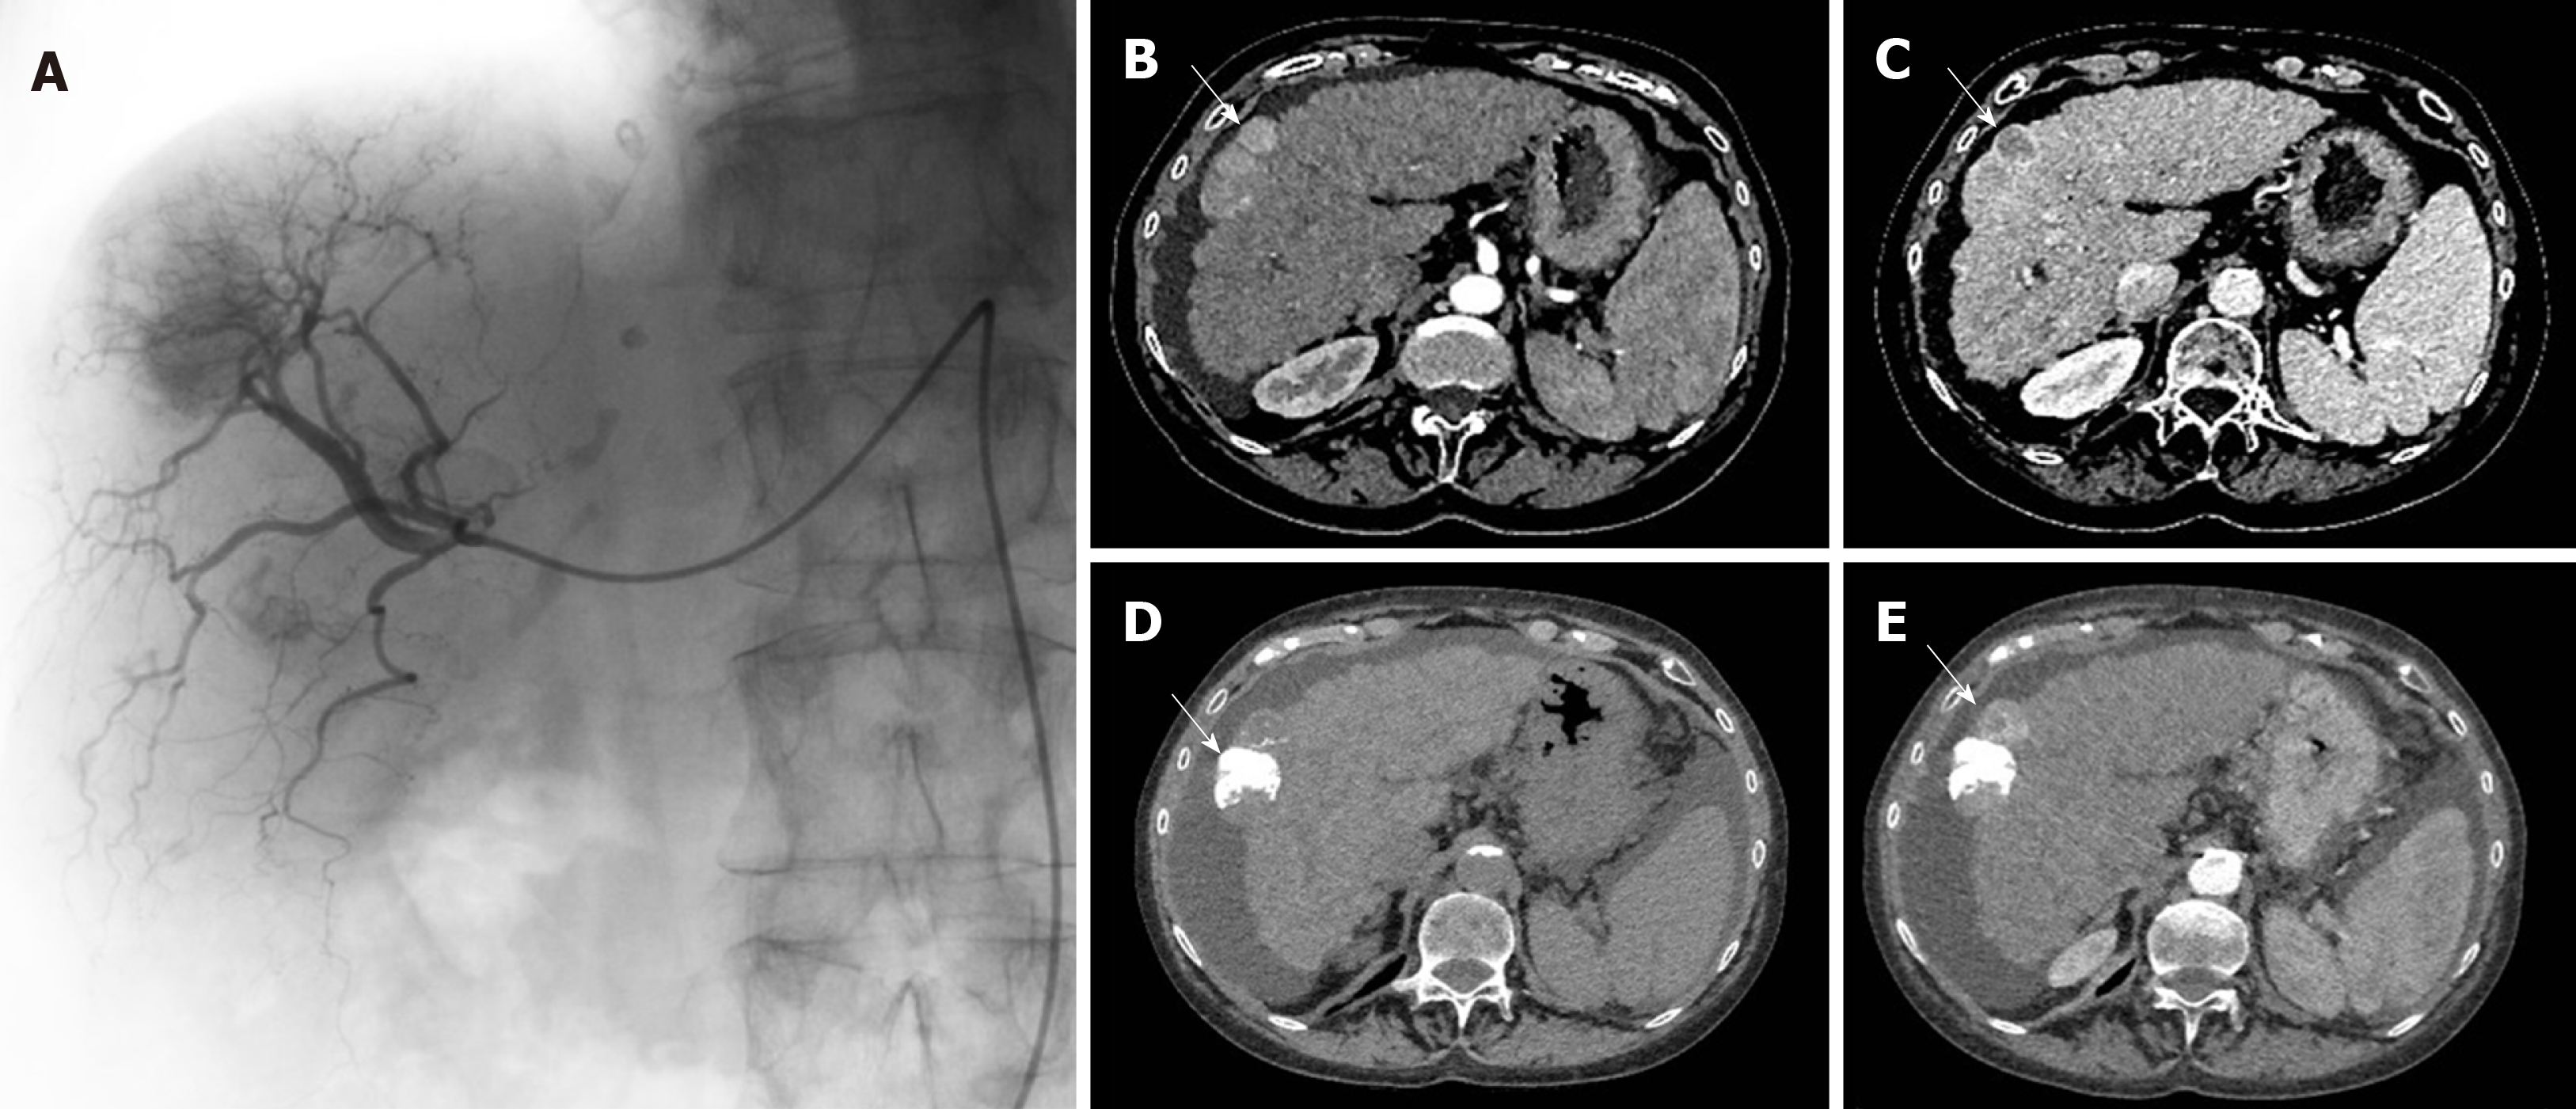
Figure 1 Example of transarterial chemoembolization on the right liver with pre-operative and after transarterial chemoembolization computed tomography scans.
A: Transarterial chemoembolization (TACE) of the right liver with presence of a tumor blush; B: Computed tomography (CT) scan before TACE showing a typical HCC nodule of the hepatic segment V with a “wash-in” corresponding to contrast enhancement during arterial phase; C: A wash out during portal phase; D: Post-TACE CT-scan unenhanced phase showing a spontaneous hyperdensity corresponding to lipiodol intake; E: Post-TACE CT-scan arterial phase showing the persistence of a contrast enhancement near the lipiodol intake, typical of a partial response.
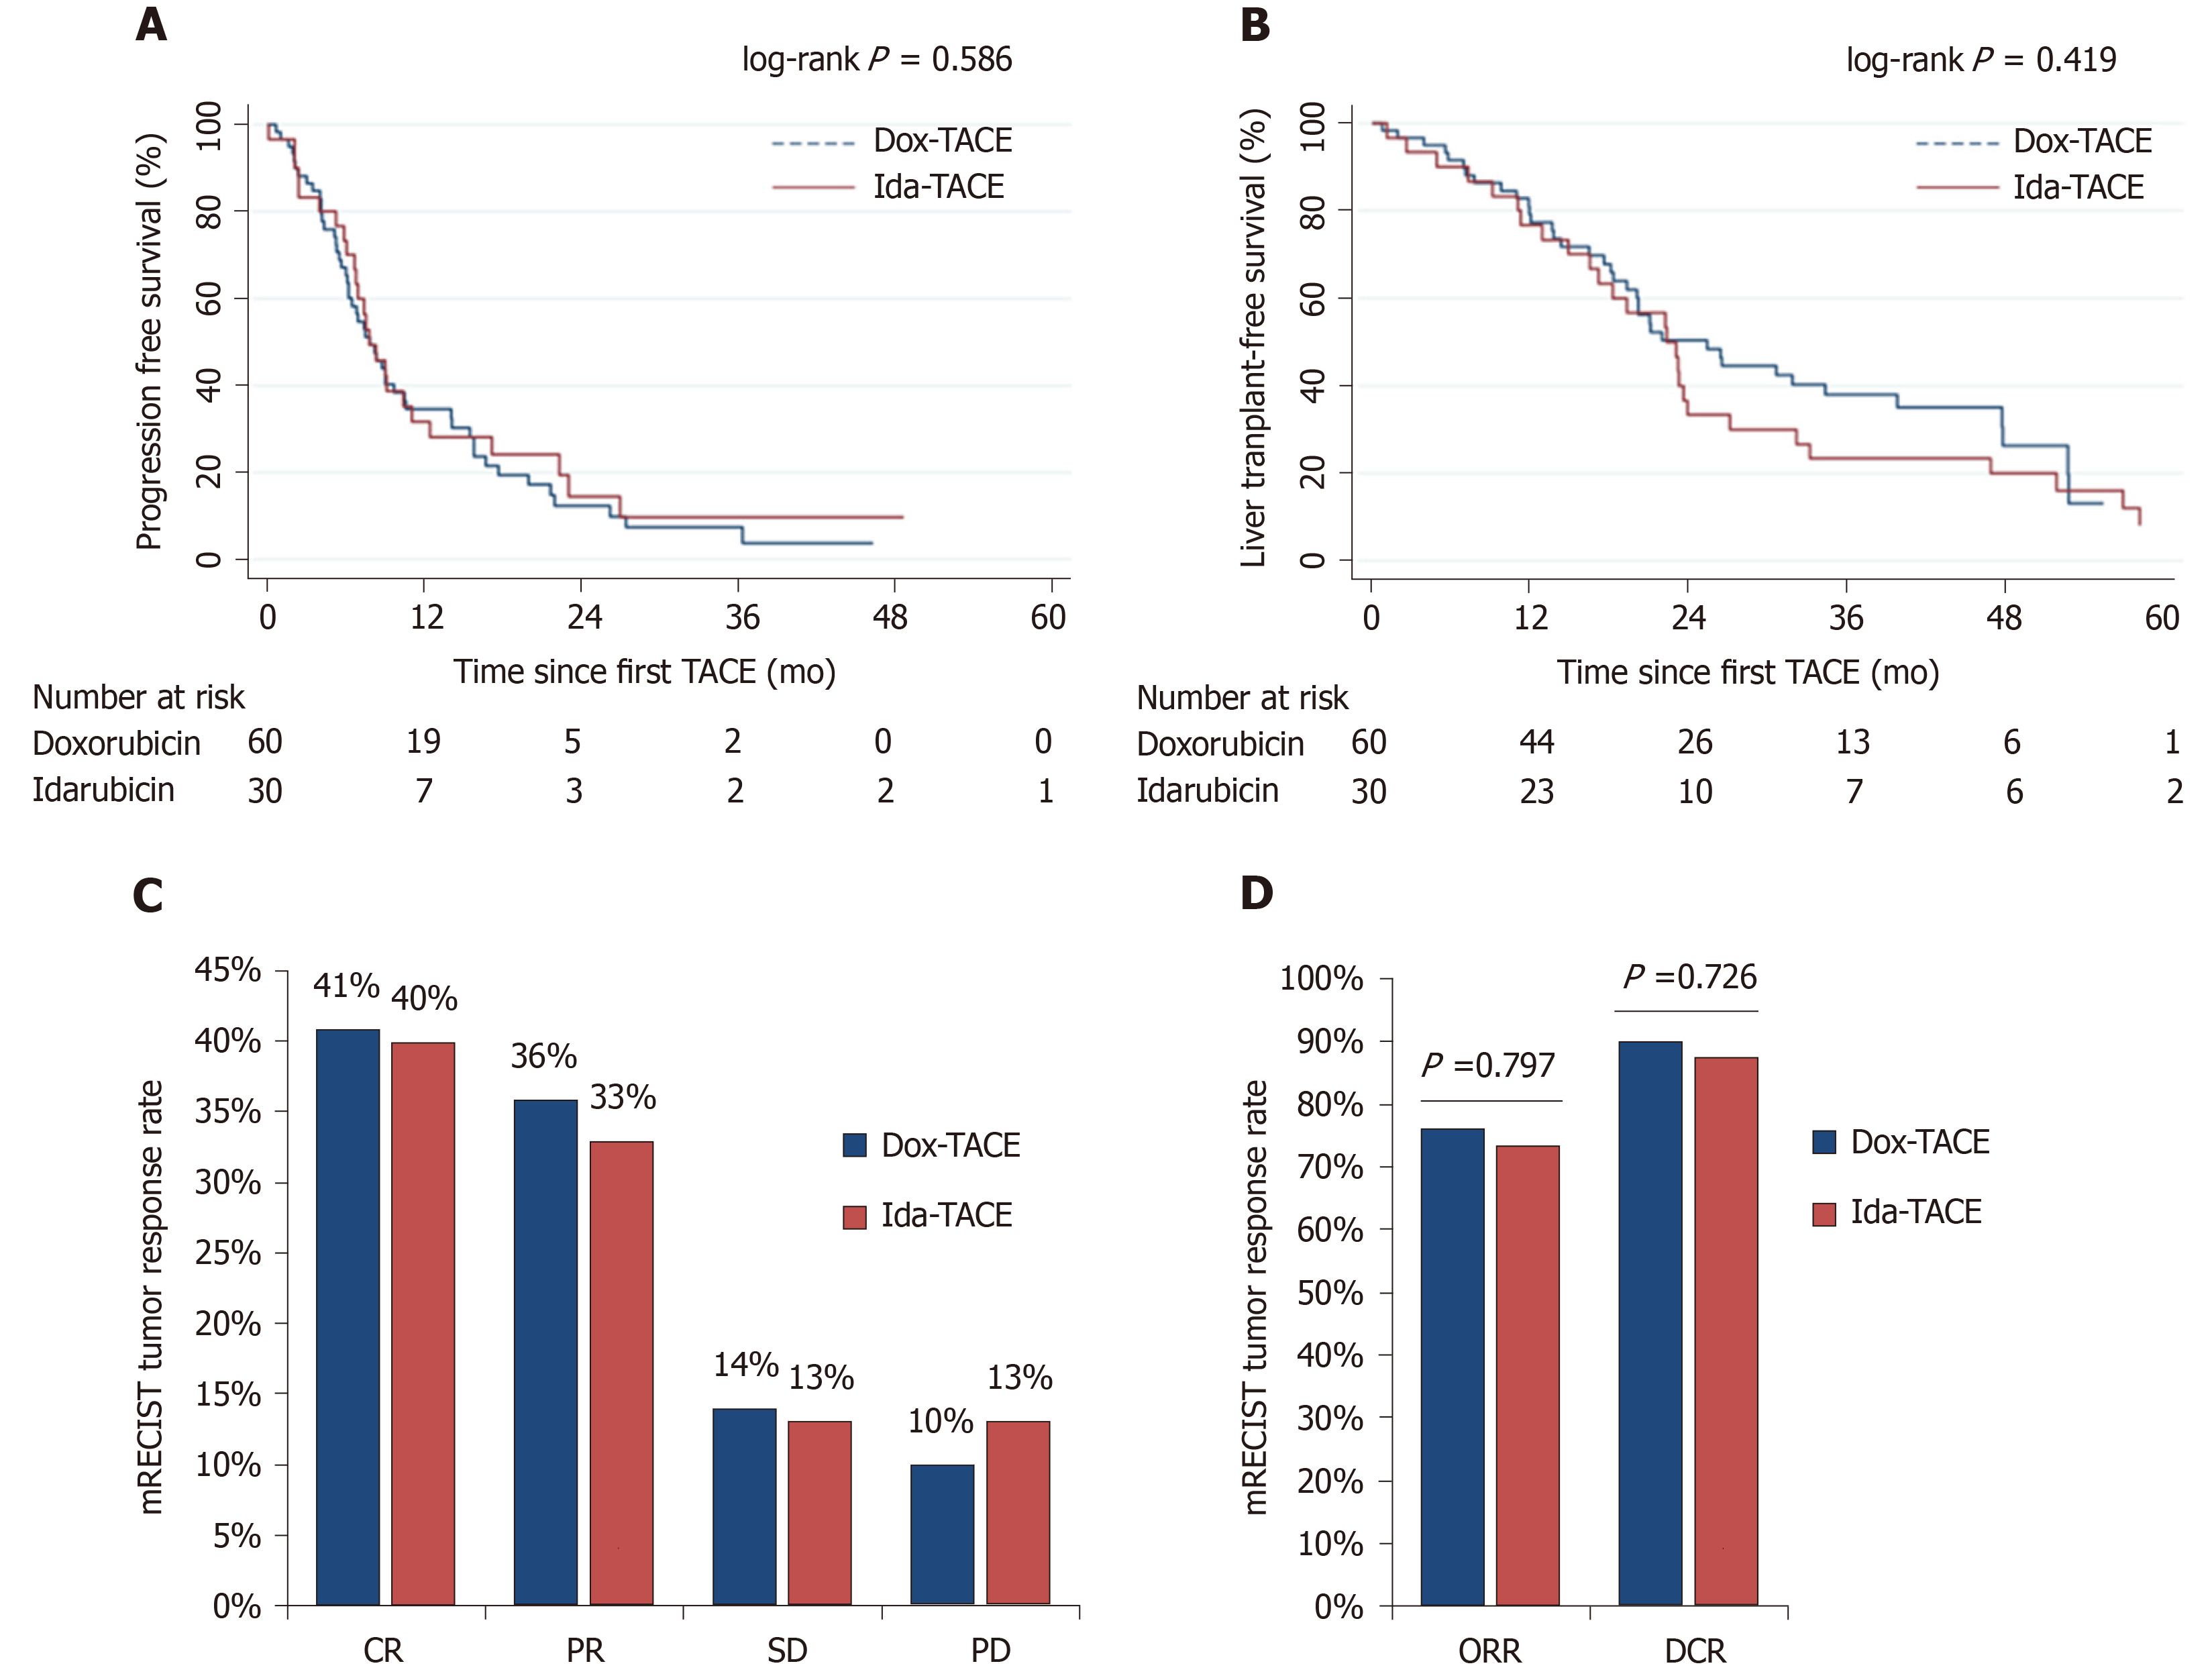
Figure 2 Comparison of tumor response and survival in doxorubicin (doxorubicin-based transarterial chemoembolization) vs idarubicin (idarubicin-based transarterial chemoembolization) patients.
A: Progression-free survival; B: Liver transplant-free survival; C: Objective response; D: Disease control rate. TACE: Transarterial chemoembolization; Dox-TACE: Doxorubicin-based transarterial chemoembolization; Ida-TACE: Idarubicin-based transarterial chemoembolization.
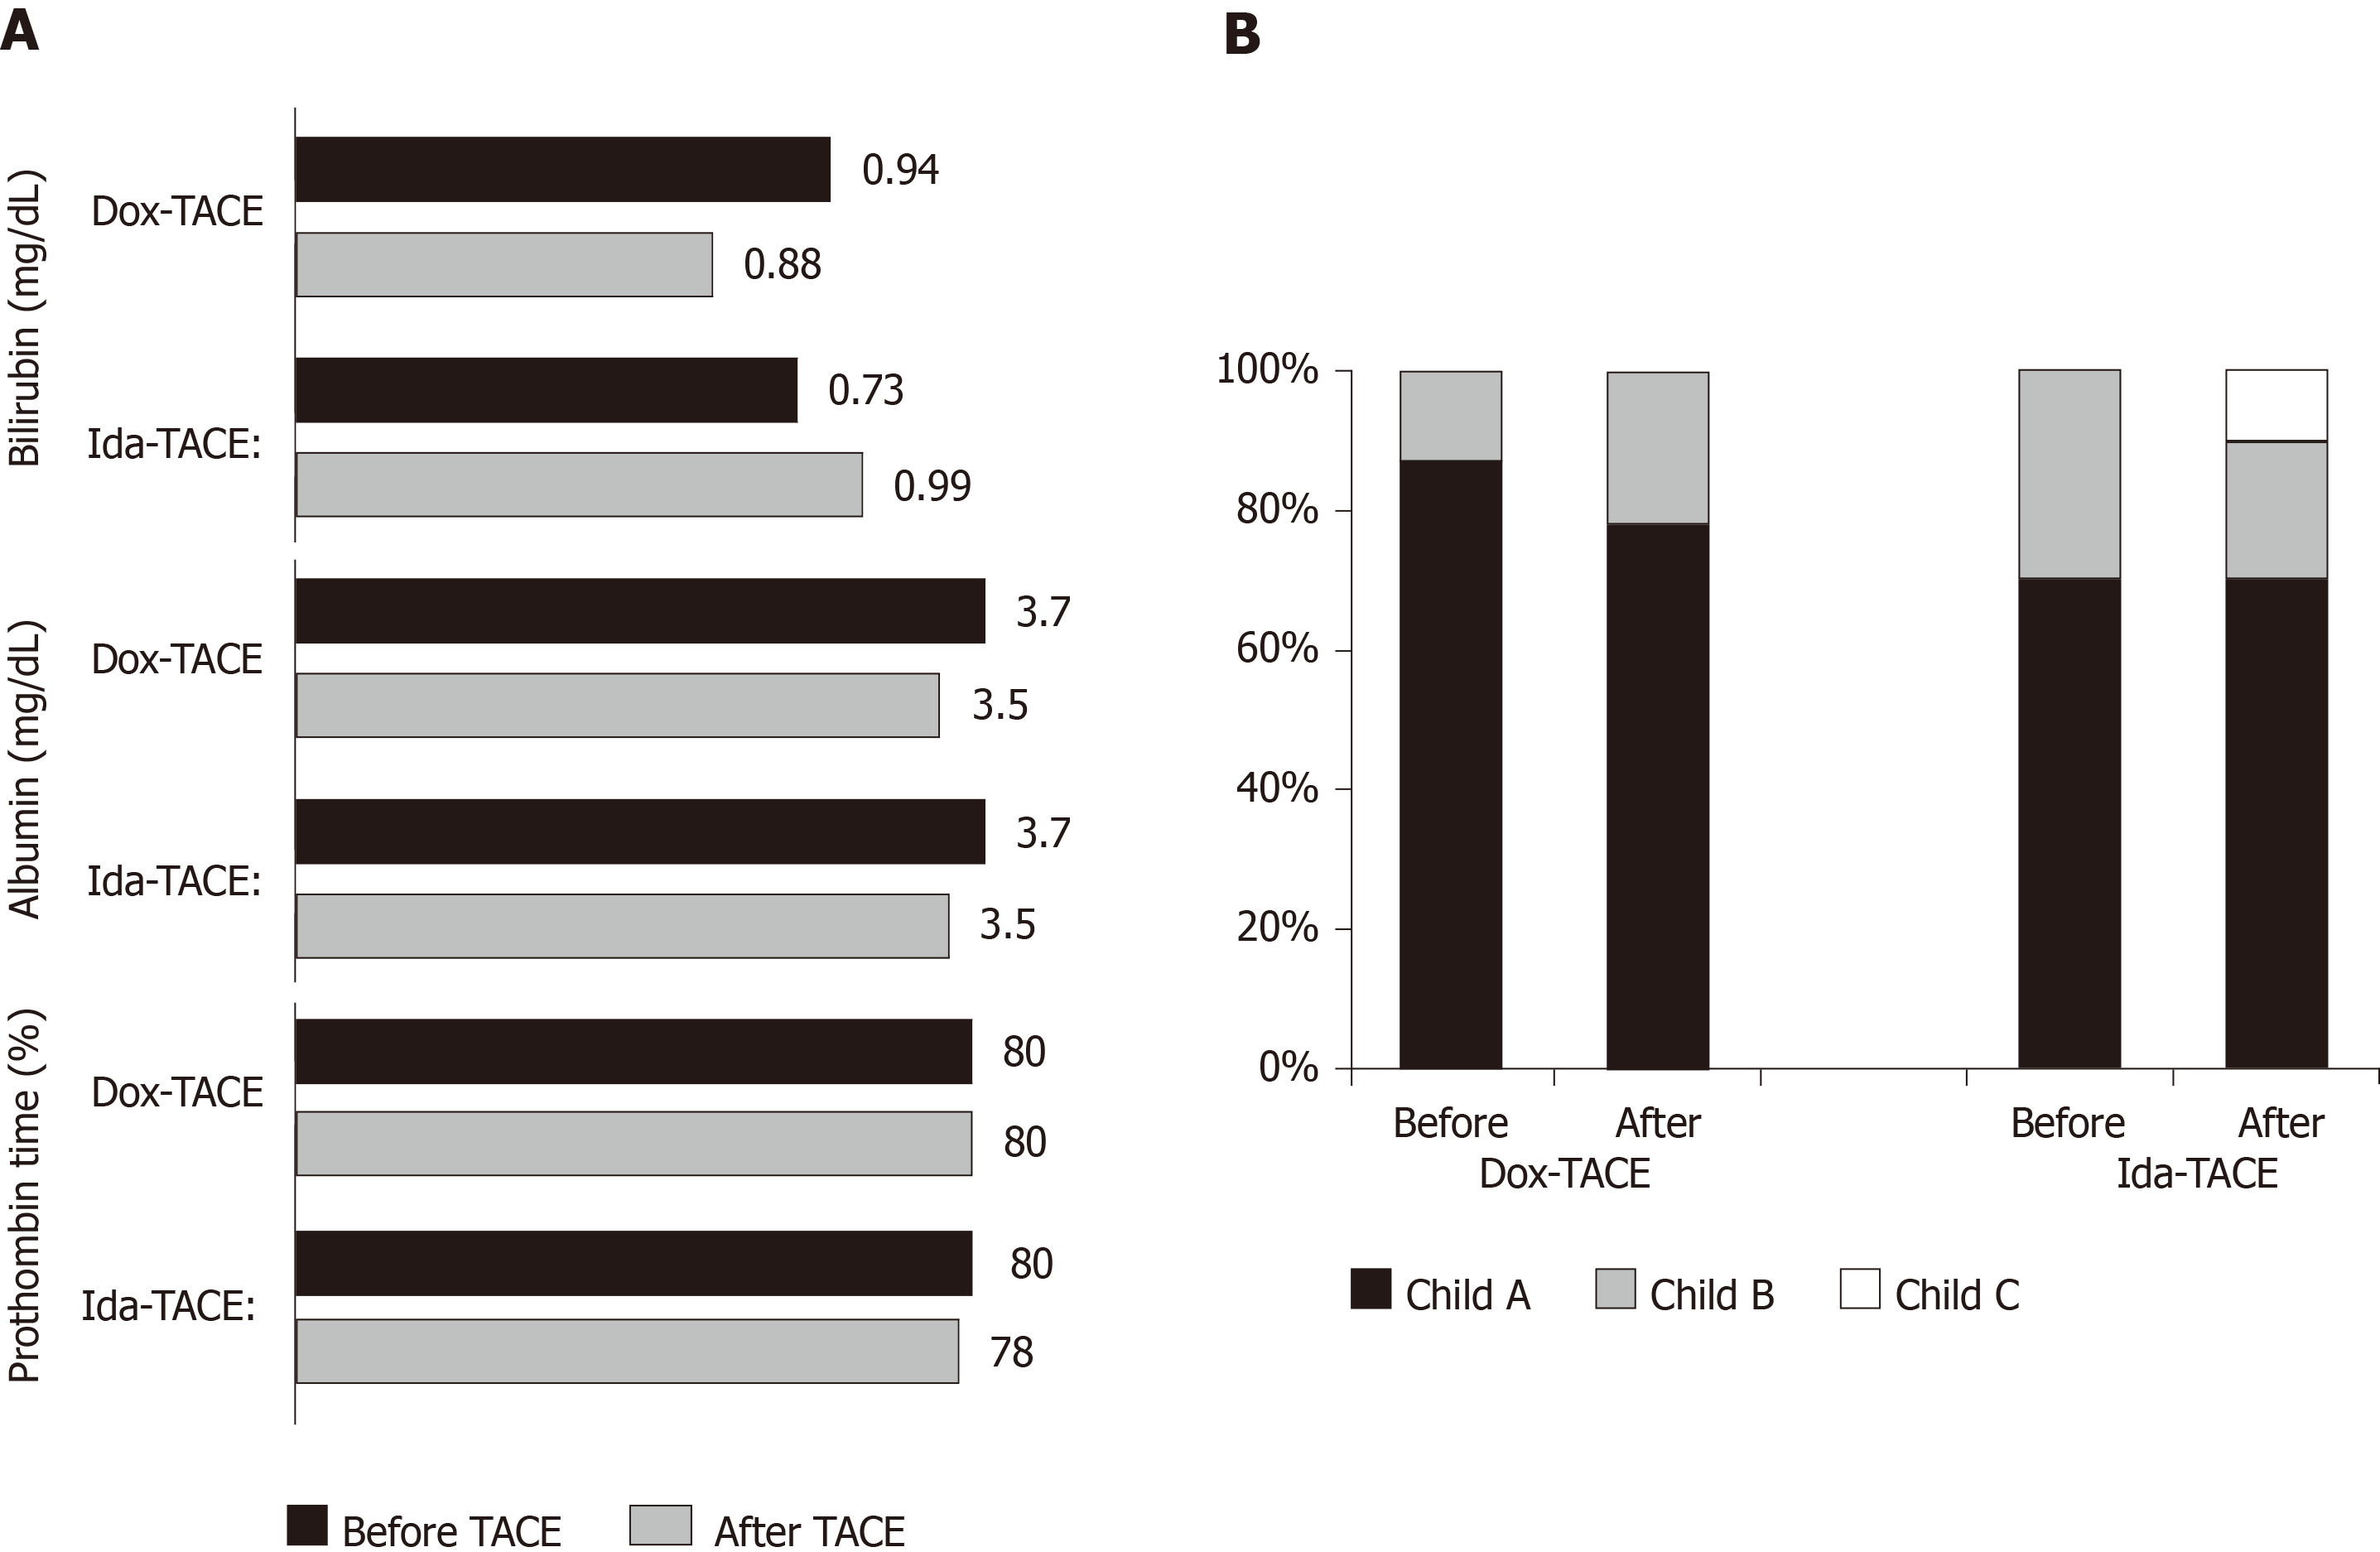
Figure 3 Chronic liver toxicity after transarterial chemoembolization.
A: Bilirubin, albumin, and prothrombin time changes; B: Child-Pugh class repartition changes between pre-transarterial chemoembolization and after transarterial chemoembolization (30-90 d) clinical and biological evaluation. Dox-TACE: Doxorubicin-based transarterial chemoembolization; Ida-TACE: Idarubicin-based transarterial chemoembolization.
- Citation: Roth GS, Teyssier Y, Abousalihac M, Seigneurin A, Ghelfi J, Sengel C, Decaens T. Idarubicin vs doxorubicin in transarterial chemoembolization of intermediate stage hepatocellular carcinoma. World J Gastroenterol 2020; 26(3): 324-334
- URL: https://www.wjgnet.com/1007-9327/full/v26/i3/324.htm
- DOI: https://dx.doi.org/10.3748/wjg.v26.i3.324


