Copyright
©The Author(s) 2020.
World J Gastroenterol. Jan 21, 2020; 26(3): 291-306
Published online Jan 21, 2020. doi: 10.3748/wjg.v26.i3.291
Published online Jan 21, 2020. doi: 10.3748/wjg.v26.i3.291
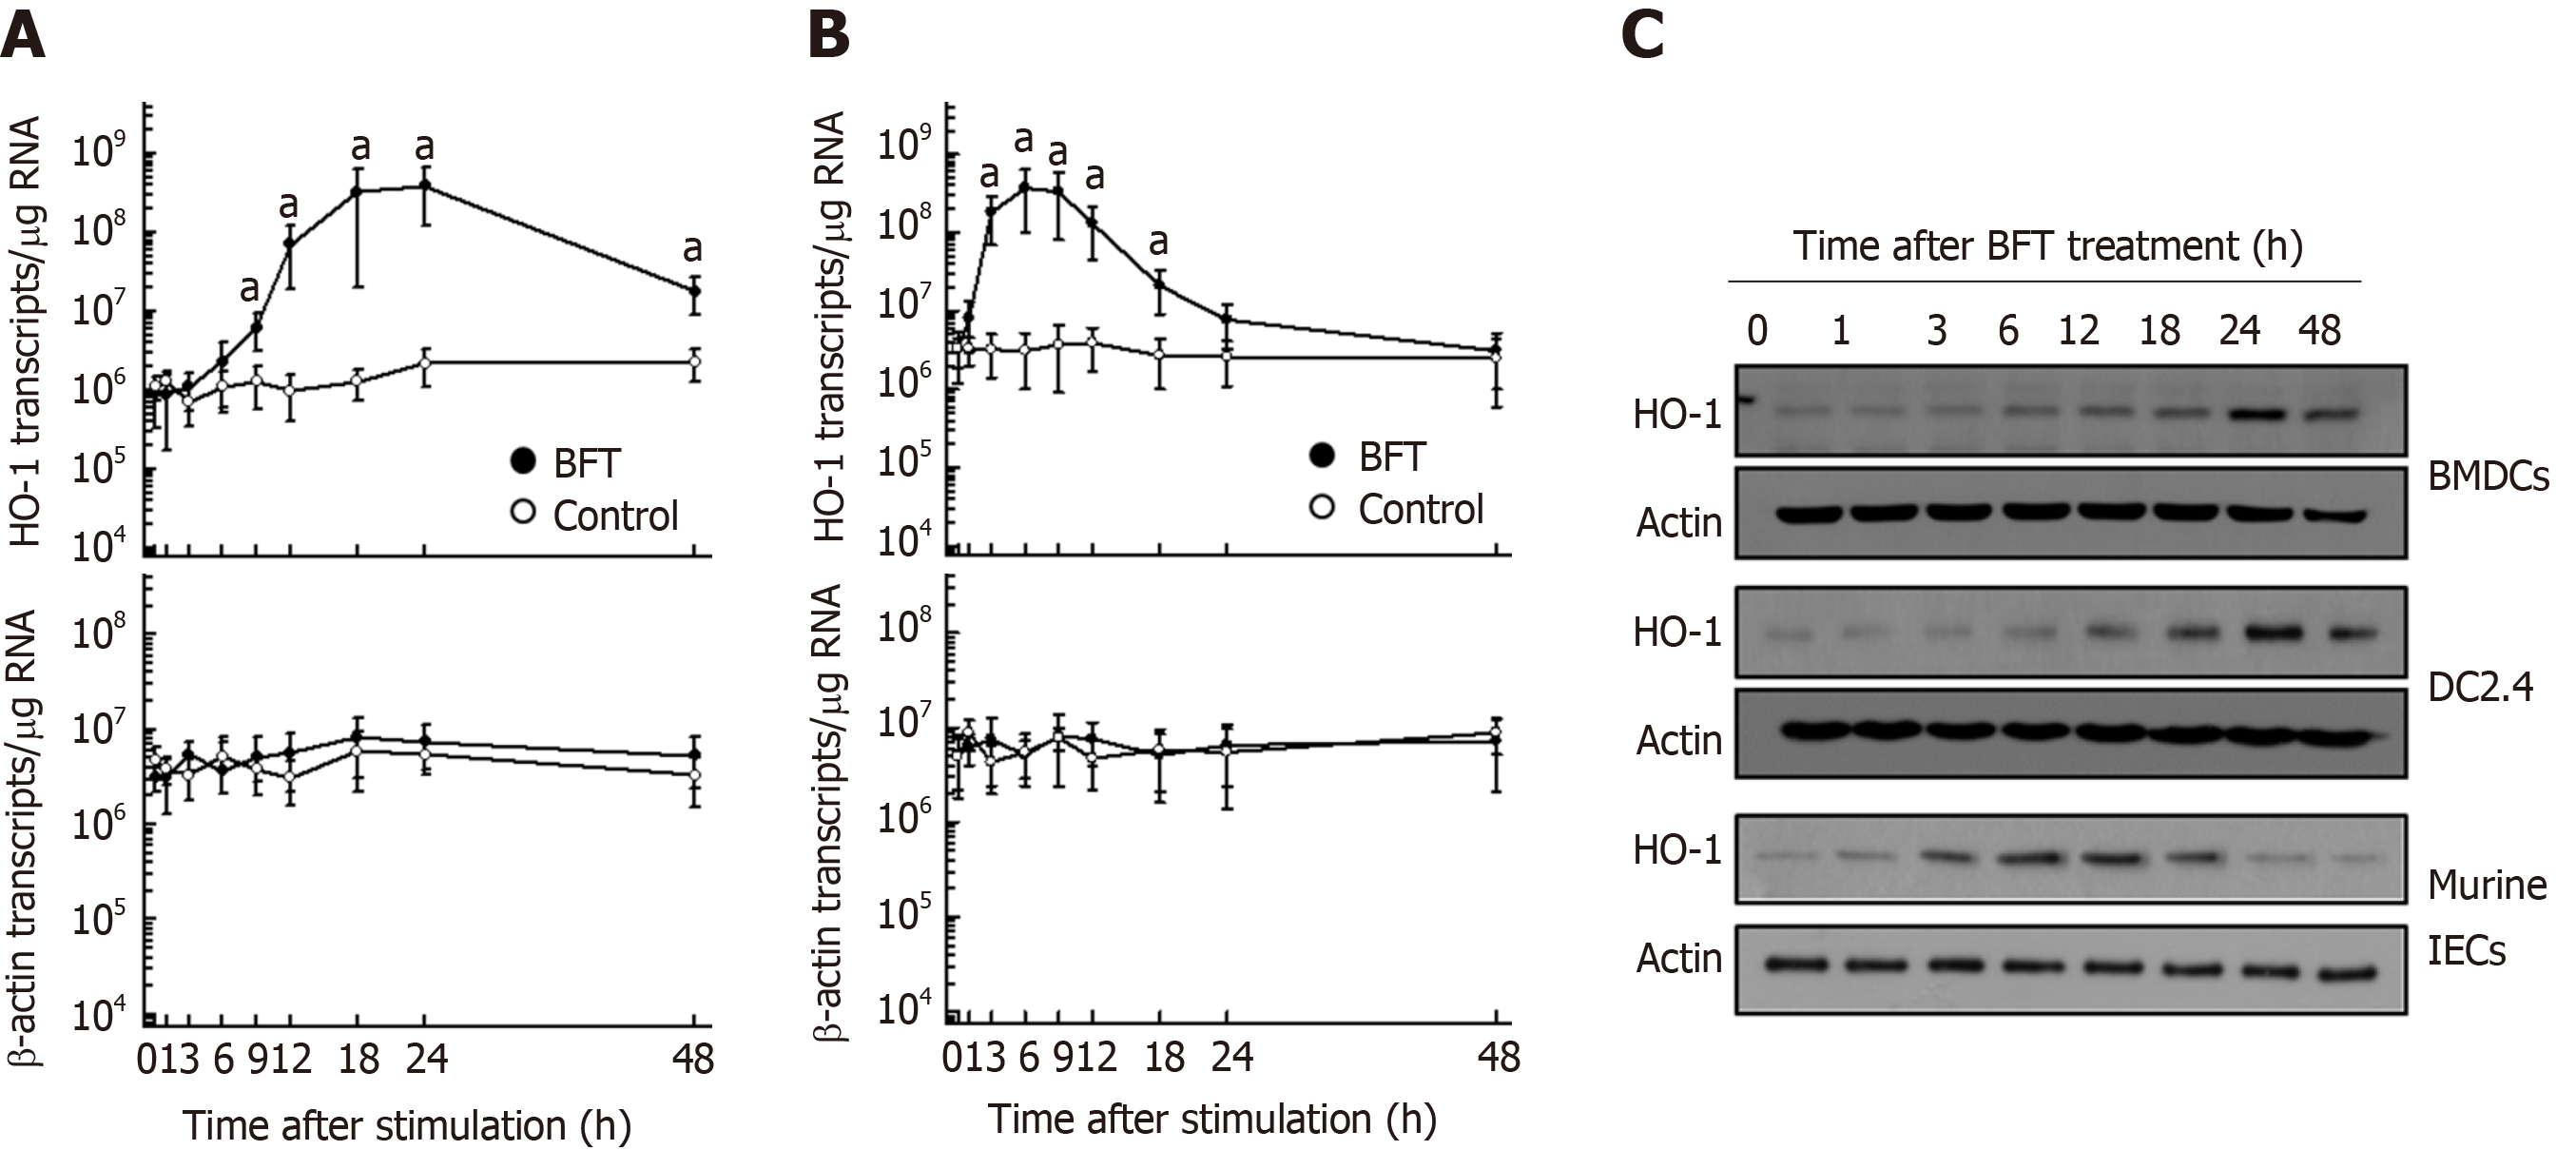
Figure 1 Heme oxygenase-1 expression in dendritic cells stimulated with Bacteroides fragilis enterotoxin.
A and B: Bone marrow-derived dendritic cells (DCs) (A, BMDCs) or primary murine intestinal epithelial cells (B, Murine intestinal epithelial cells, IECs) were stimulated with Bacteroides fragilis toxin (BFT) (100 ng/mL) for the indicated periods. Levels of heme oxygenase-1 (HO-1) and β-actin mRNAs were analyzed by quantitative RT-PCR using each standard RNA. The values are expressed as mean ± SD (n = 5). aP < 0.05 vs unstimulated controls. C: BMDCs, DC2.4 cells and murine IECs were treated with BFT (100 ng/mL) for the indicated periods. Expression of HO-1 and actin was analyzed by immunoblot. Results are representative of more than three independent experiments. IECs: Intestinal epithelial cells; HO-1: Heme oxygenase-1; BFT: Bacteroides fragilis toxin.
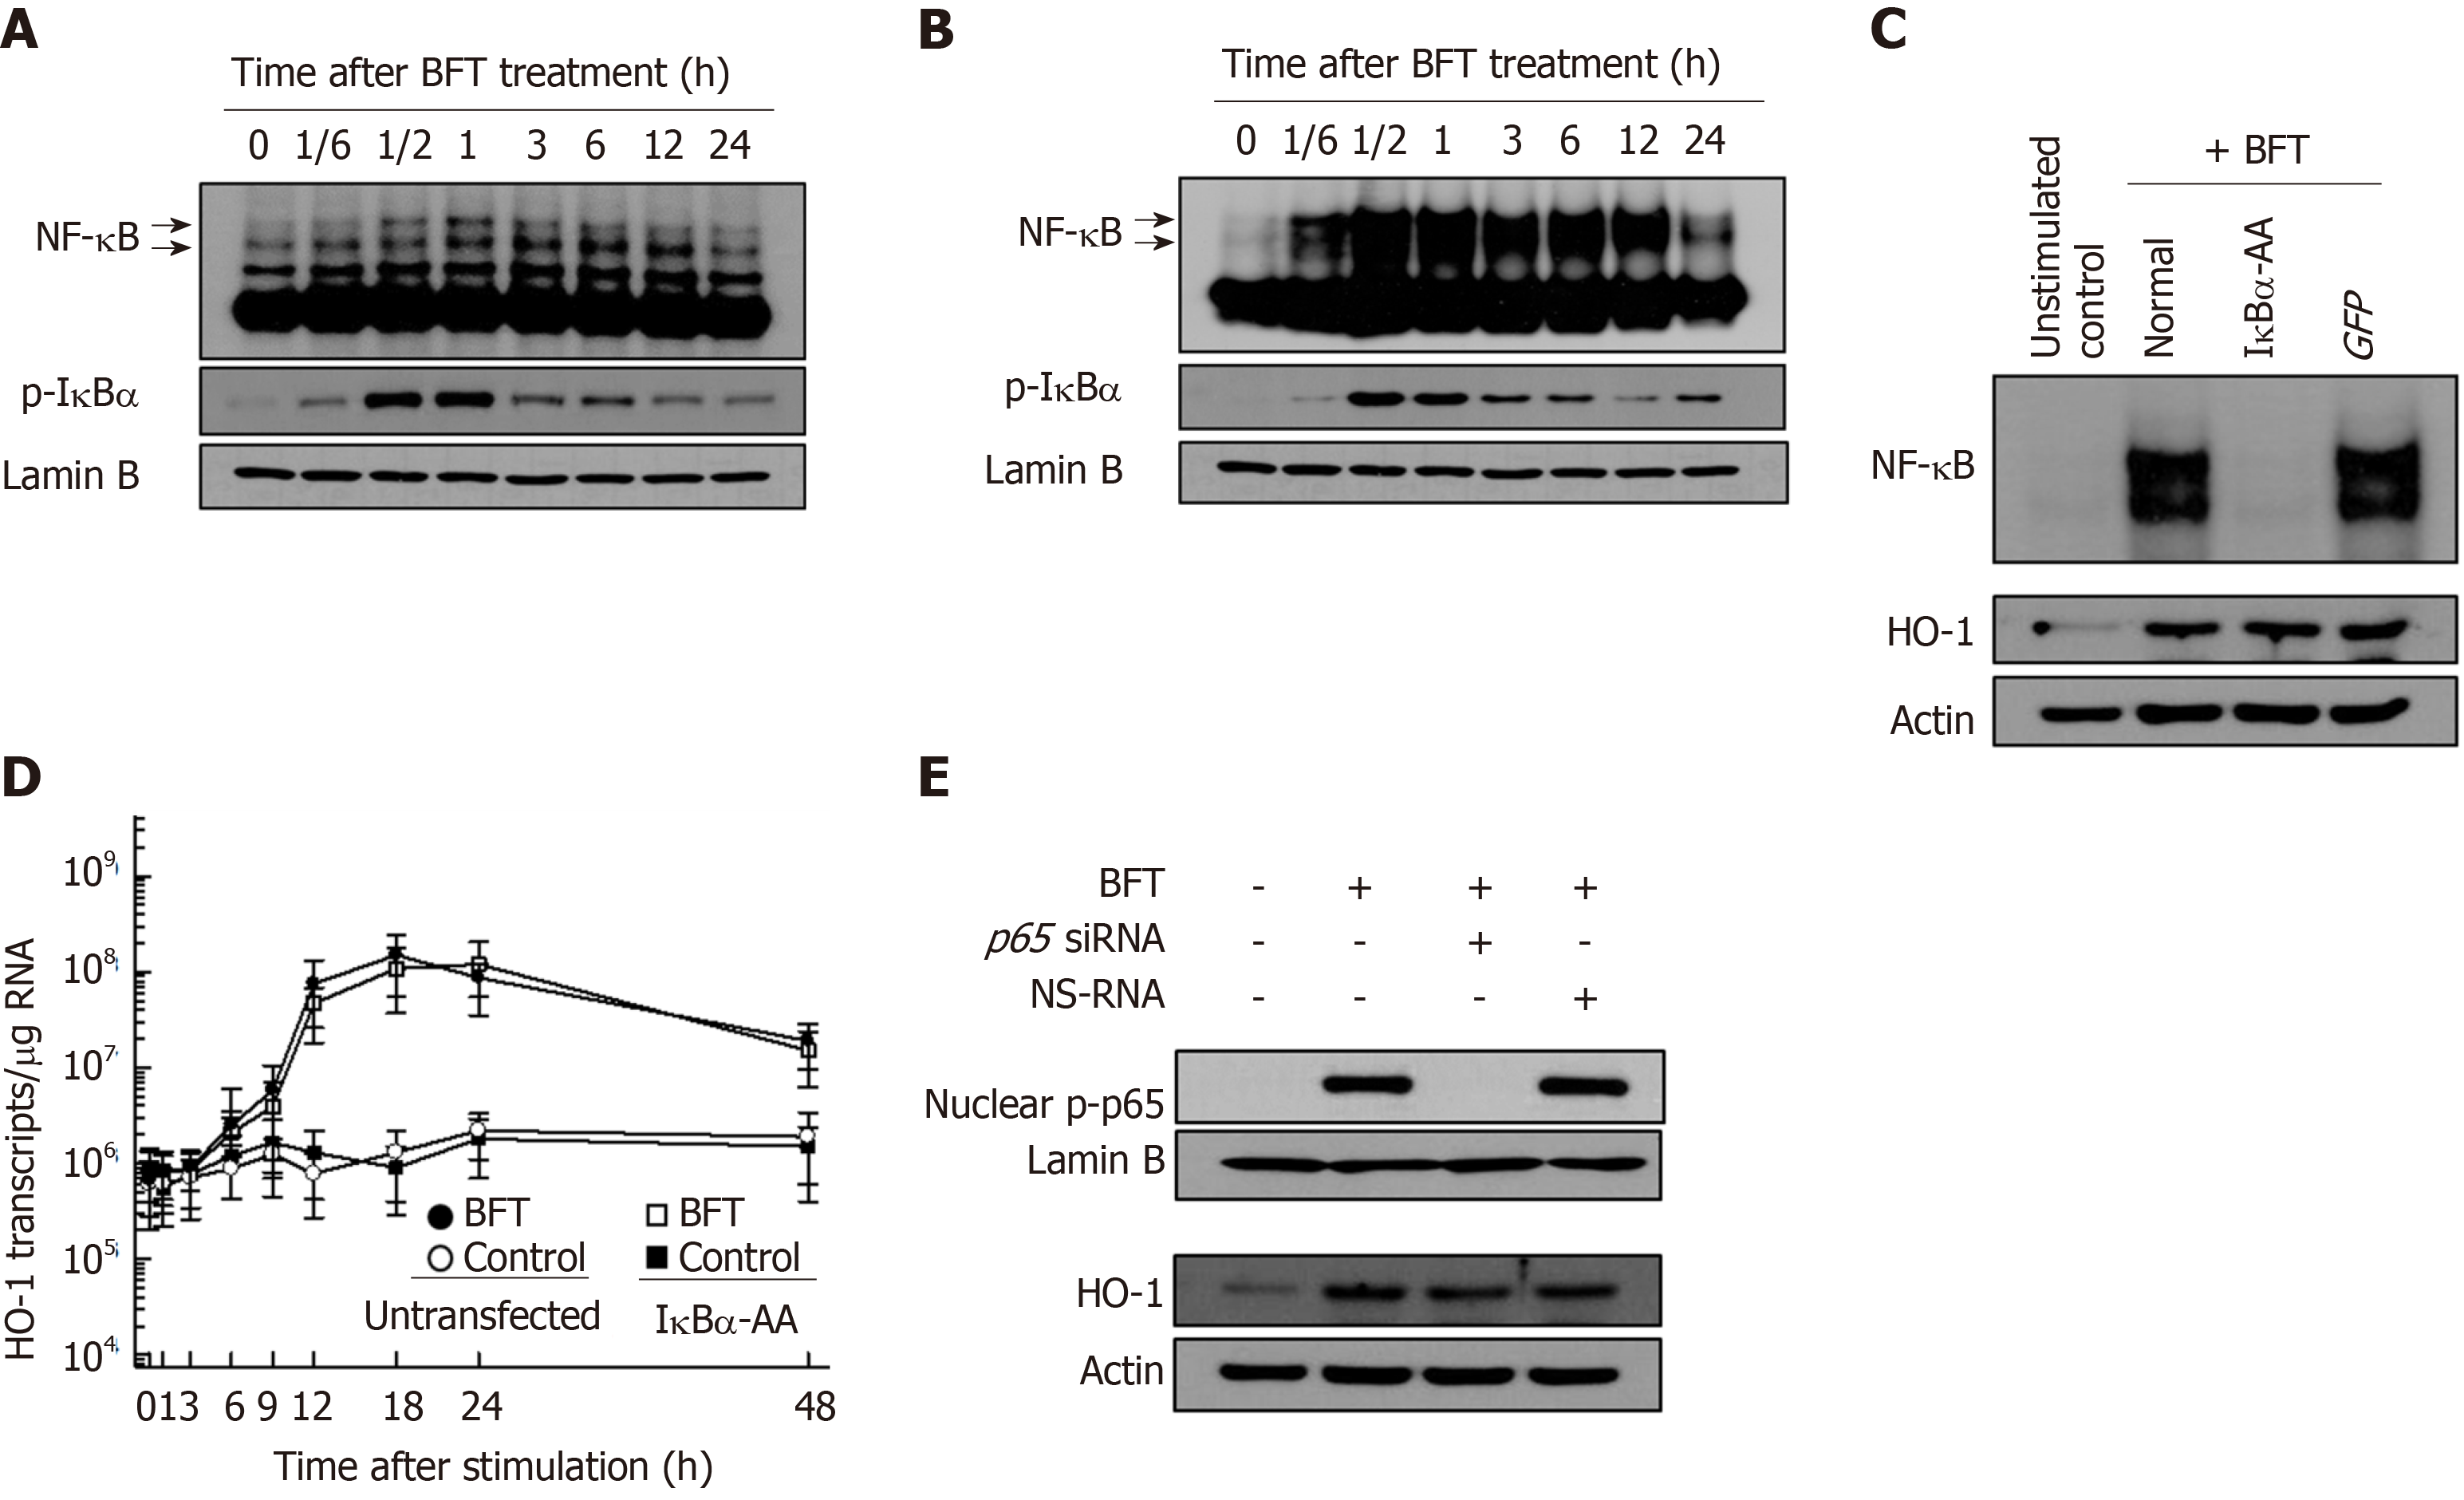
Figure 2 Effects of NF-κB suppression on heme oxygenase-1 expression in dendritic cells treated with Bacteroides fragilis enterotoxin.
A and B: Bone marrow-derived dendritic cells (DCs) (A) and DC2.4 cells (B) were treated with BFT (100 ng/mL) for the indicated times. NF-κB DNA binding activity was assessed by EMSA. Immunoblot results for concurrent phospho-IκBα and lamin B in nuclear extracts under the same conditions are provided beneath the EMSA. C: DC2.4 cells were transfected with either lentivirus containing IκBα-superrepressor (IκBα-AA) or control virus (GFP). Transfected cells were stimulated with BFT (100 ng/ml) for 1 h. NF-κB binding activity was assayed by EMSA (top panel). Transfected or untransfected cells were treated with BFT (100 μg/ml) for 12 h. Expression of heme oxygenase-1 (HO-1) and actin was analyzed by immunoblot (bottom panel). Results are representative of more than three independent experiments. D: Transfected DC2.4 cells were treated with BFT (100 ng/ml) for the indicated periods. The levels of HO-1 mRNA were analyzed by quantitative RT-PCR using a standard RNA. The values are expressed as mean ± SD (n = 5). The β-actin mRNA levels in each group remained relatively constant throughout the same periods (approximately 106 transcripts/μg total RNA). aP < 0.05 vs untransfected cells treated with BFT. E: DC2.4 cells were transfected with NF-κB p65-specific silencing siRNA or NS-RNA as a control for 48 h, after which cells were combined with BFT (100 ng/mL) for 1 h. Nuclear extracts were analyzed by immunoblotting with the indicated Abs (top panel). Transfected cells were stimulated with BFT (100 ng/mL) for 24 h. Expression of HO-1 and actin was analyzed by immunoblot (bottom panel). Results shown are representative of more than three independent experiments. HO-1: Heme oxygenase-1; BFT: Bacteroides fragilis toxin.
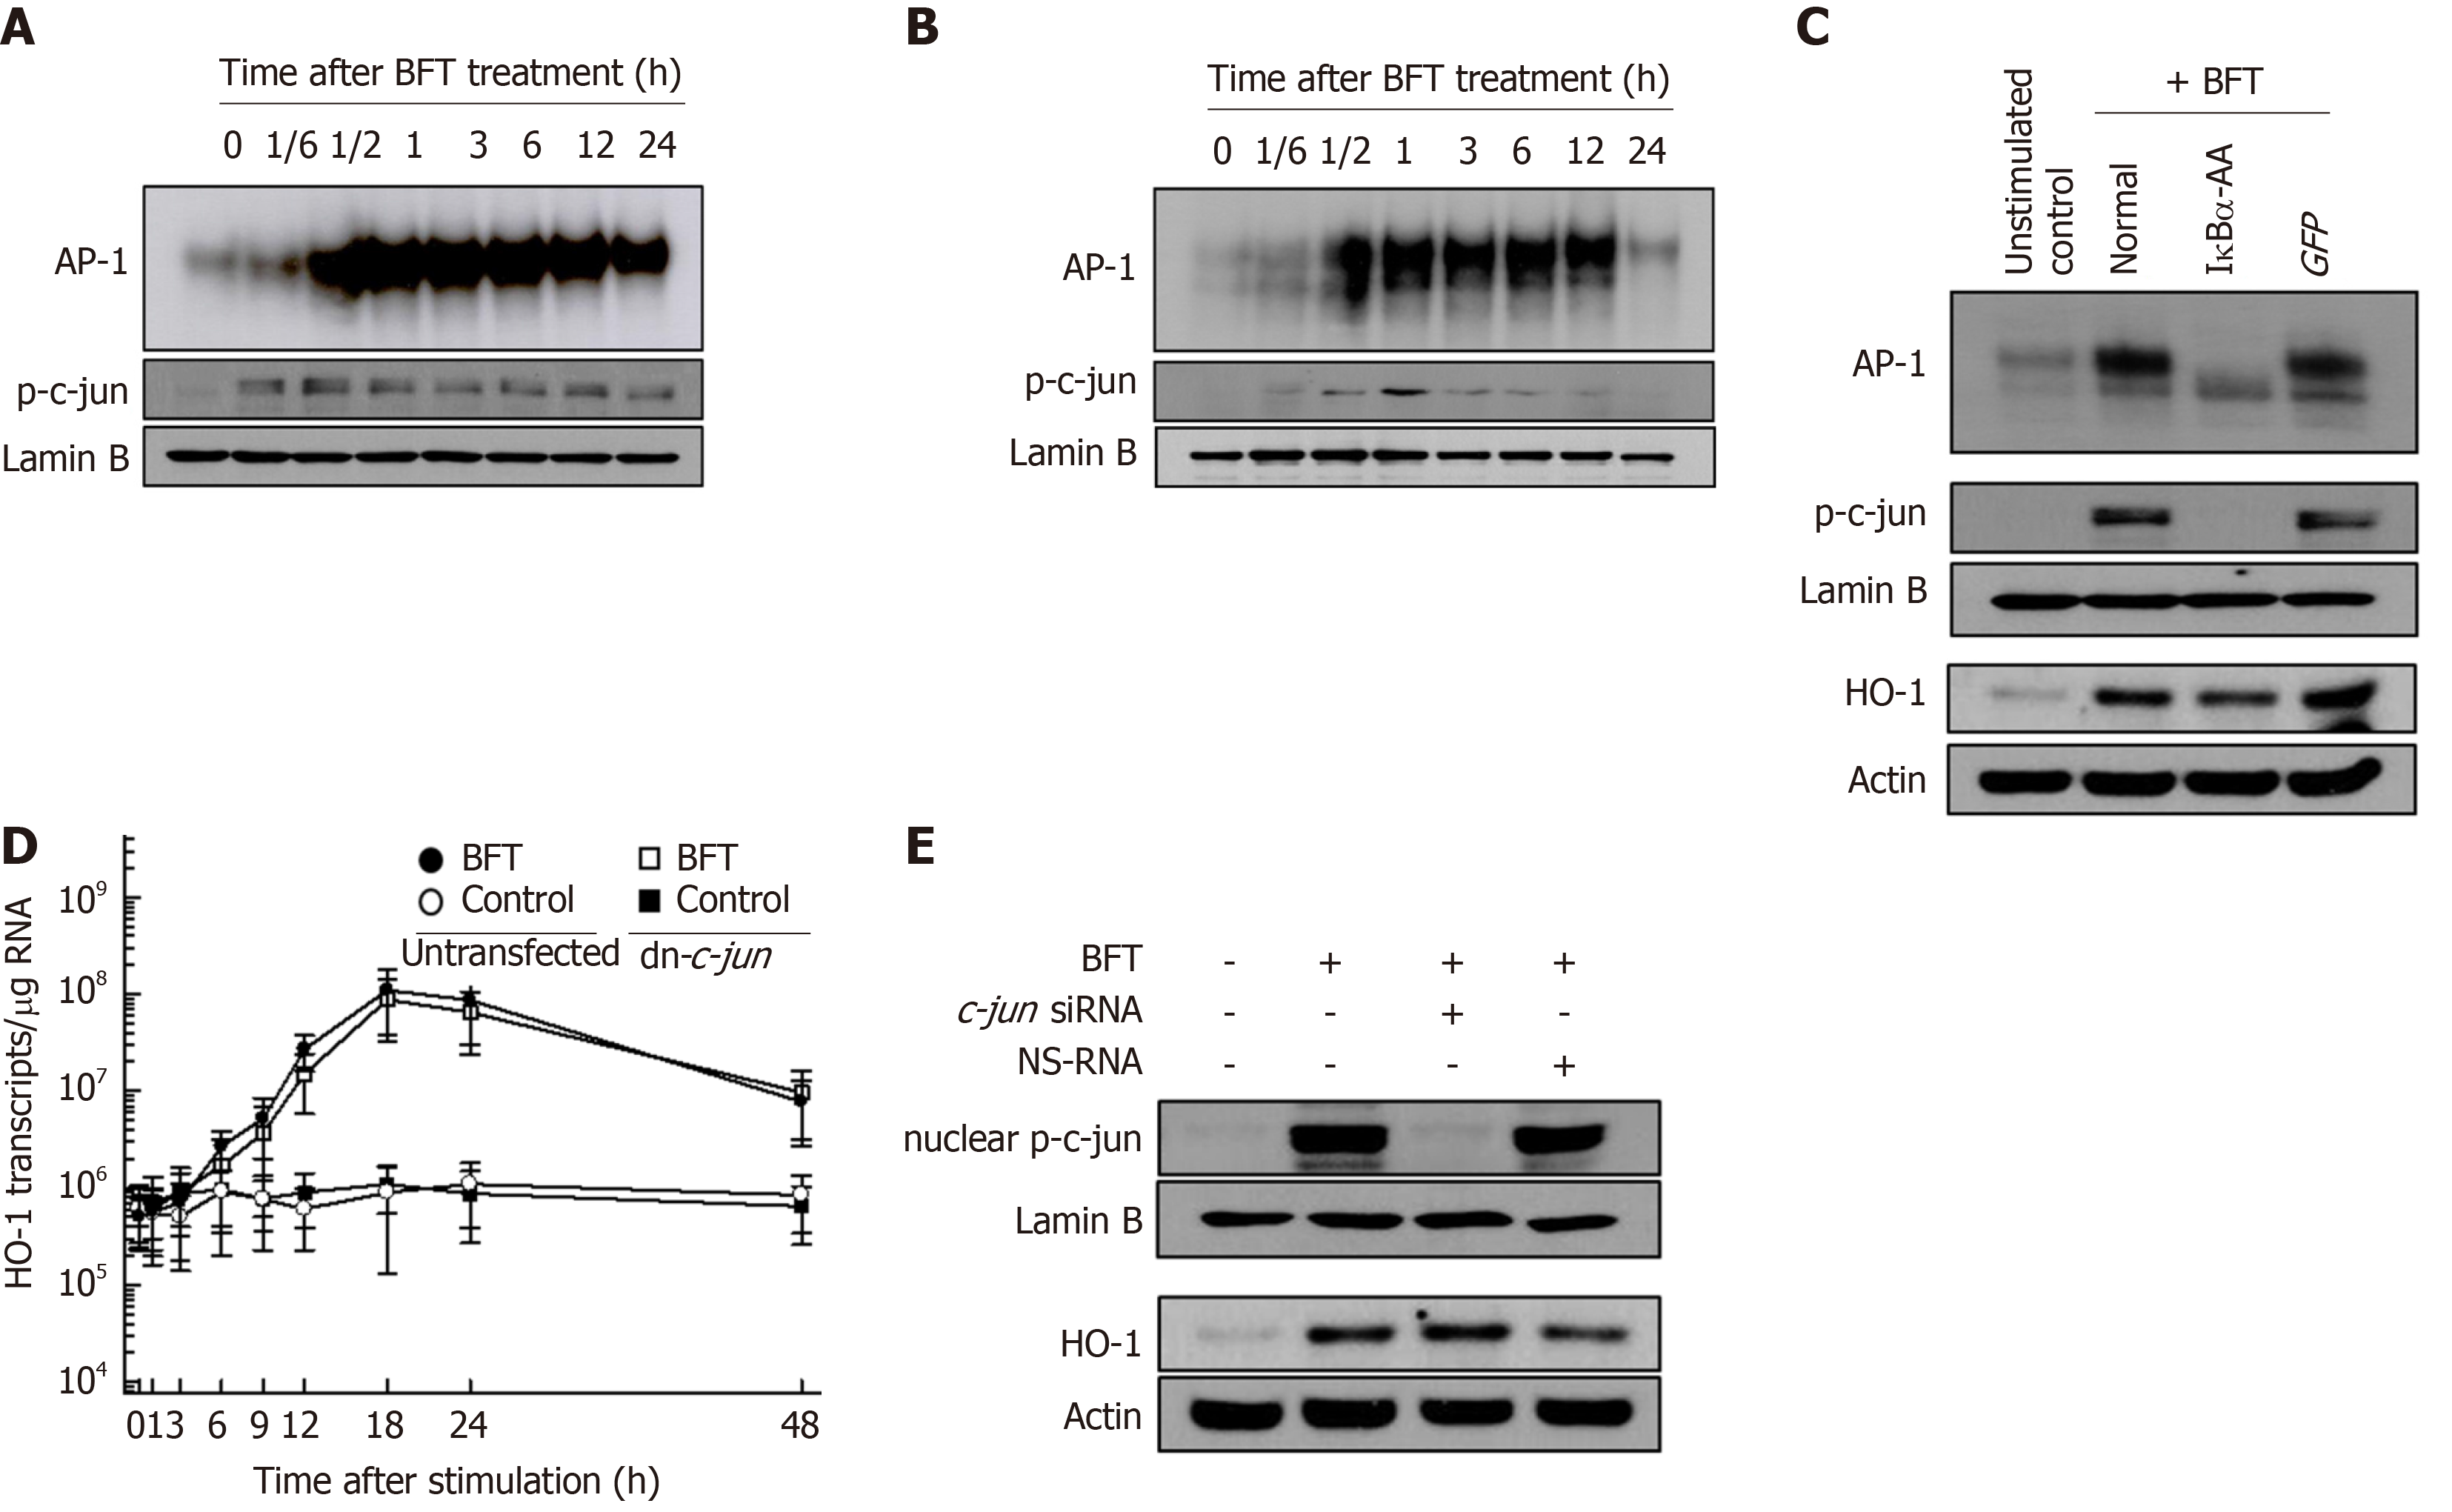
Figure 3 Effects of AP-1 suppression on heme oxygenase-1 expression in dendritic cells stimulated with Bacteroides fragilis enterotoxin.
A and B: Bone marrow-derived dendritic cells (DCs) (A) and DC2.4 cells (B) were treated with Bacteroides fragilis toxin (BFT) (100 ng/mL) for the indicated periods. AP-1 DNA binding activity was assessed by EMSA and expression of phospho-c-jun in nuclear extracts was detected using immunoblot. Results are representative of more than three independent experiments. C: DC2.4 cells were transfected with lentivirus containing dominant-negative c-jun plasmid (dn-c-jun) or control virus (GFP). Transfected cells were stimulated with BFT (100 ng/mL) for 1 h. AP-1 binding activity was assayed by EMSA (top panel). Immunoblot results for concurrent phospho-c-jun and lamin B in nuclear extracts under the same conditions are provided beneath the EMSA (middle panel). Expression of heme oxygenase-1 (HO-1) and actin proteins was analyzed by immunoblot (bottom panel). Results are representative of more than three independent experiments. D: Transfected DC2.4 cells were treated with BFT (100 ng/mL) for the indicated periods. Levels of HO-1 mRNA were analyzed by quantitative RT-PCR using a standard RNA. The values are expressed as mean ± SD (n = 5). The β-actin mRNA levels in each group remained relatively constant throughout the same periods (approximately 106 transcripts/μg total RNA). E: DC2.4 cells were transfected with AP-1 c-jun-specific silencing siRNA or NS-RNA as a control for 48 h, after which cells were combined with BFT (100 ng/mL) for 1 h. Nuclear extracts were analyzed by immunoblotting with the indicated Abs (top panel). Transfected cells were stimulated with BFT (100 ng/mL) for 24 h. Expression of HO-1 and actin was detected by immunoblot (bottom panel). Results shown are representative of more than three independent experiments. HO-1: Heme oxygenase-1; BFT: Bacteroides fragilis toxin.
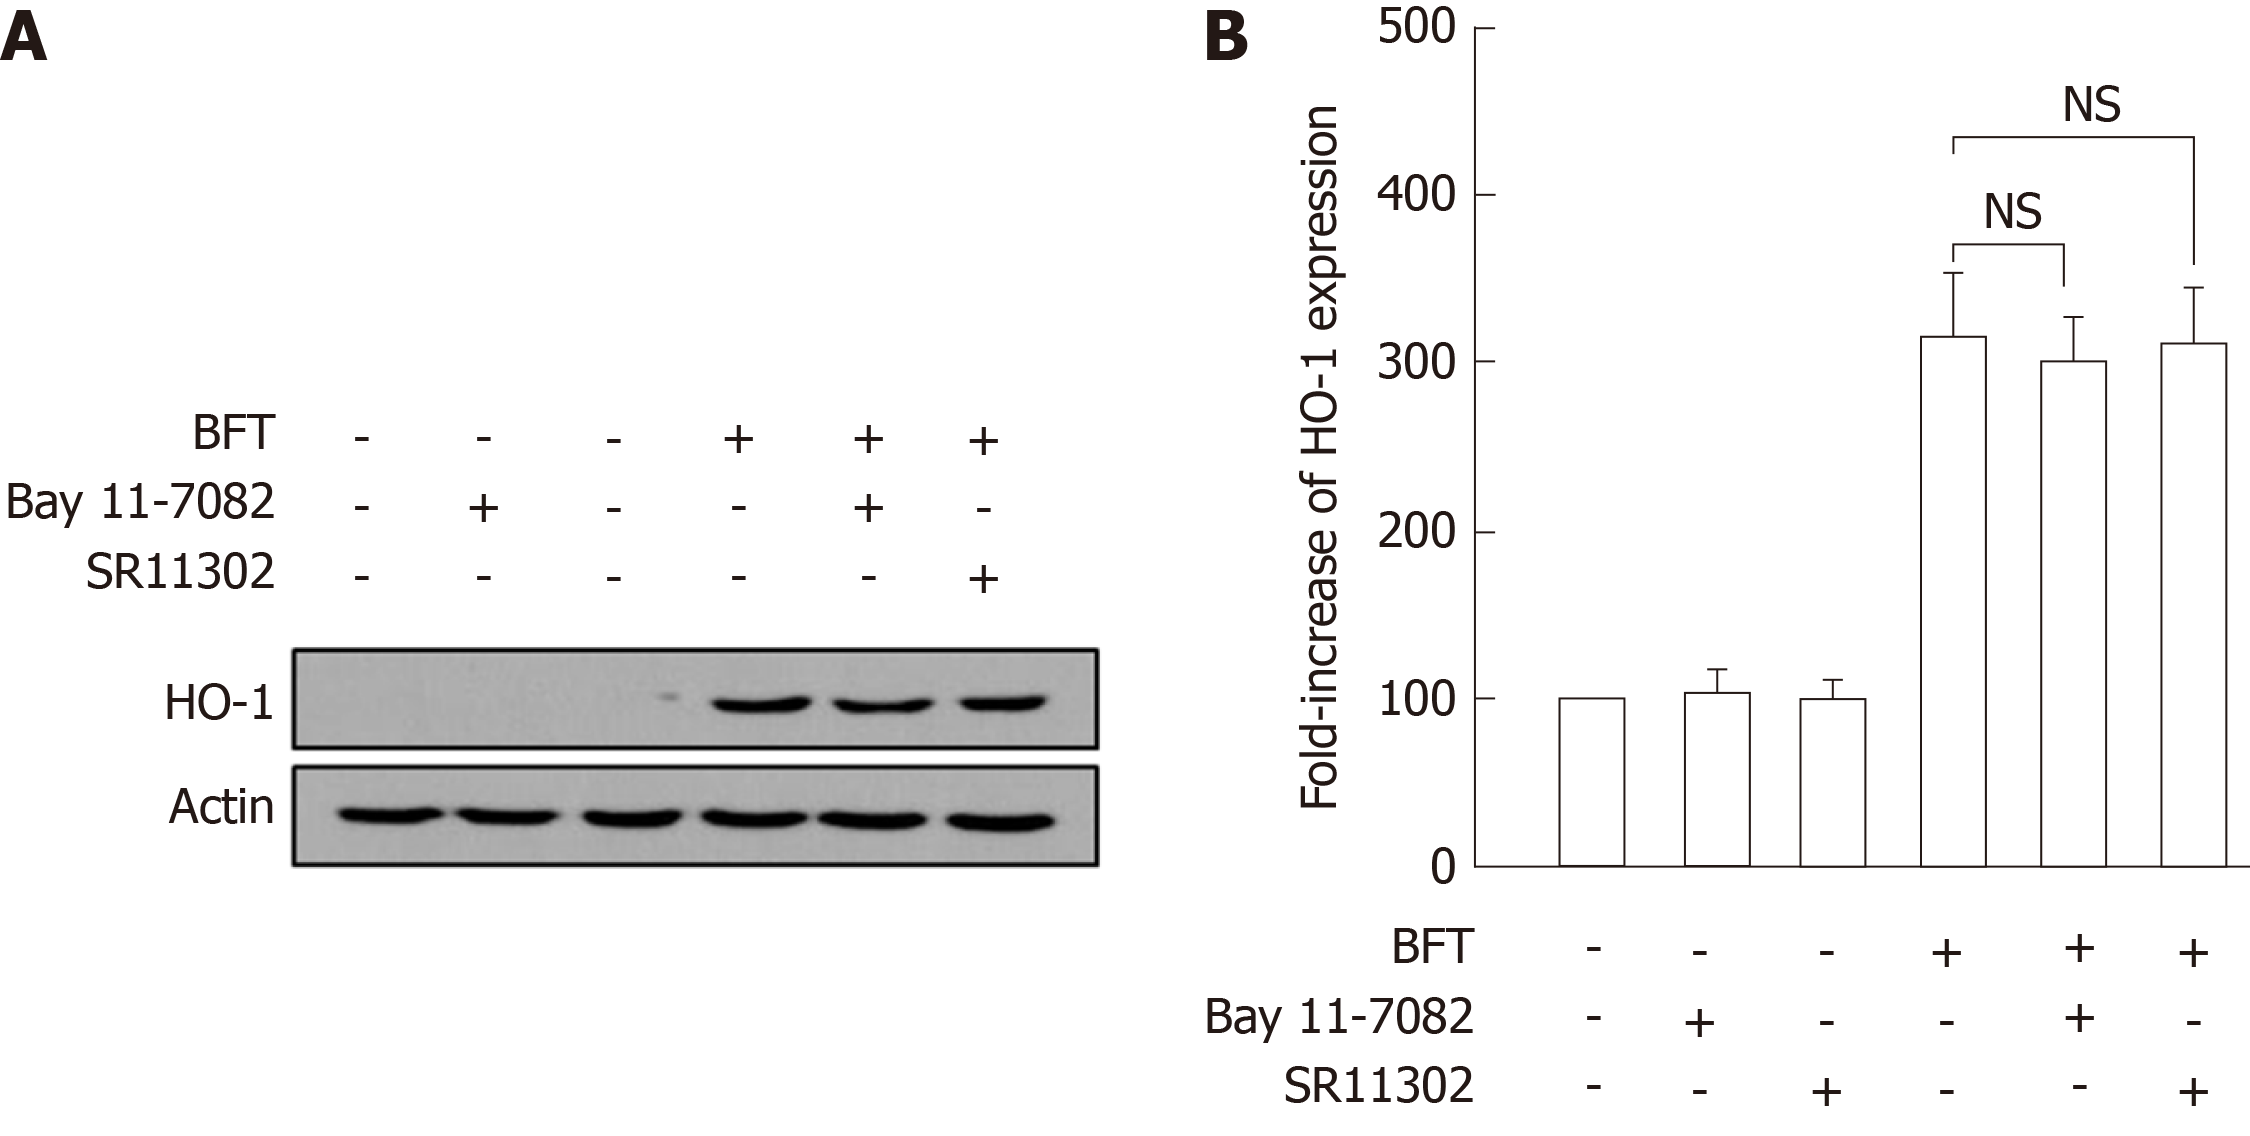
Figure 4 Relationship between the suppression of NF-κB or AP-1 activity and heme oxygenase-1 expression in bone marrow-derived dendritic cells stimulated with Bacteroides fragilis enterotoxin.
A: Bone marrow (BM)-derived dendritic cells (DCs) were treated with Bacteroides fragilis toxin (BFT) (100 ng/mL) for 24 h, respectively. The expression of heme oxygenase-1 (HO-1) and actin was analyzed by immunoblot. Results are representative of more than three independent experiments. B: BM-derived DCs were preincubated with the NF-κB inhibitor Bay 11-7082 (50 μmol/L) or the AP-1 inhibitor SR11302 (10 μmol/L) for 30 min, followed by stimulation with BFT (100 ng/mL) for an additional 24 h. Expression levels of HO-1 protein were measured by ELISA (mean ± SE, n = 5). NS: Statistically non-significant; HO-1: Heme oxygenase-1; BFT: Bacteroides fragilis toxin.
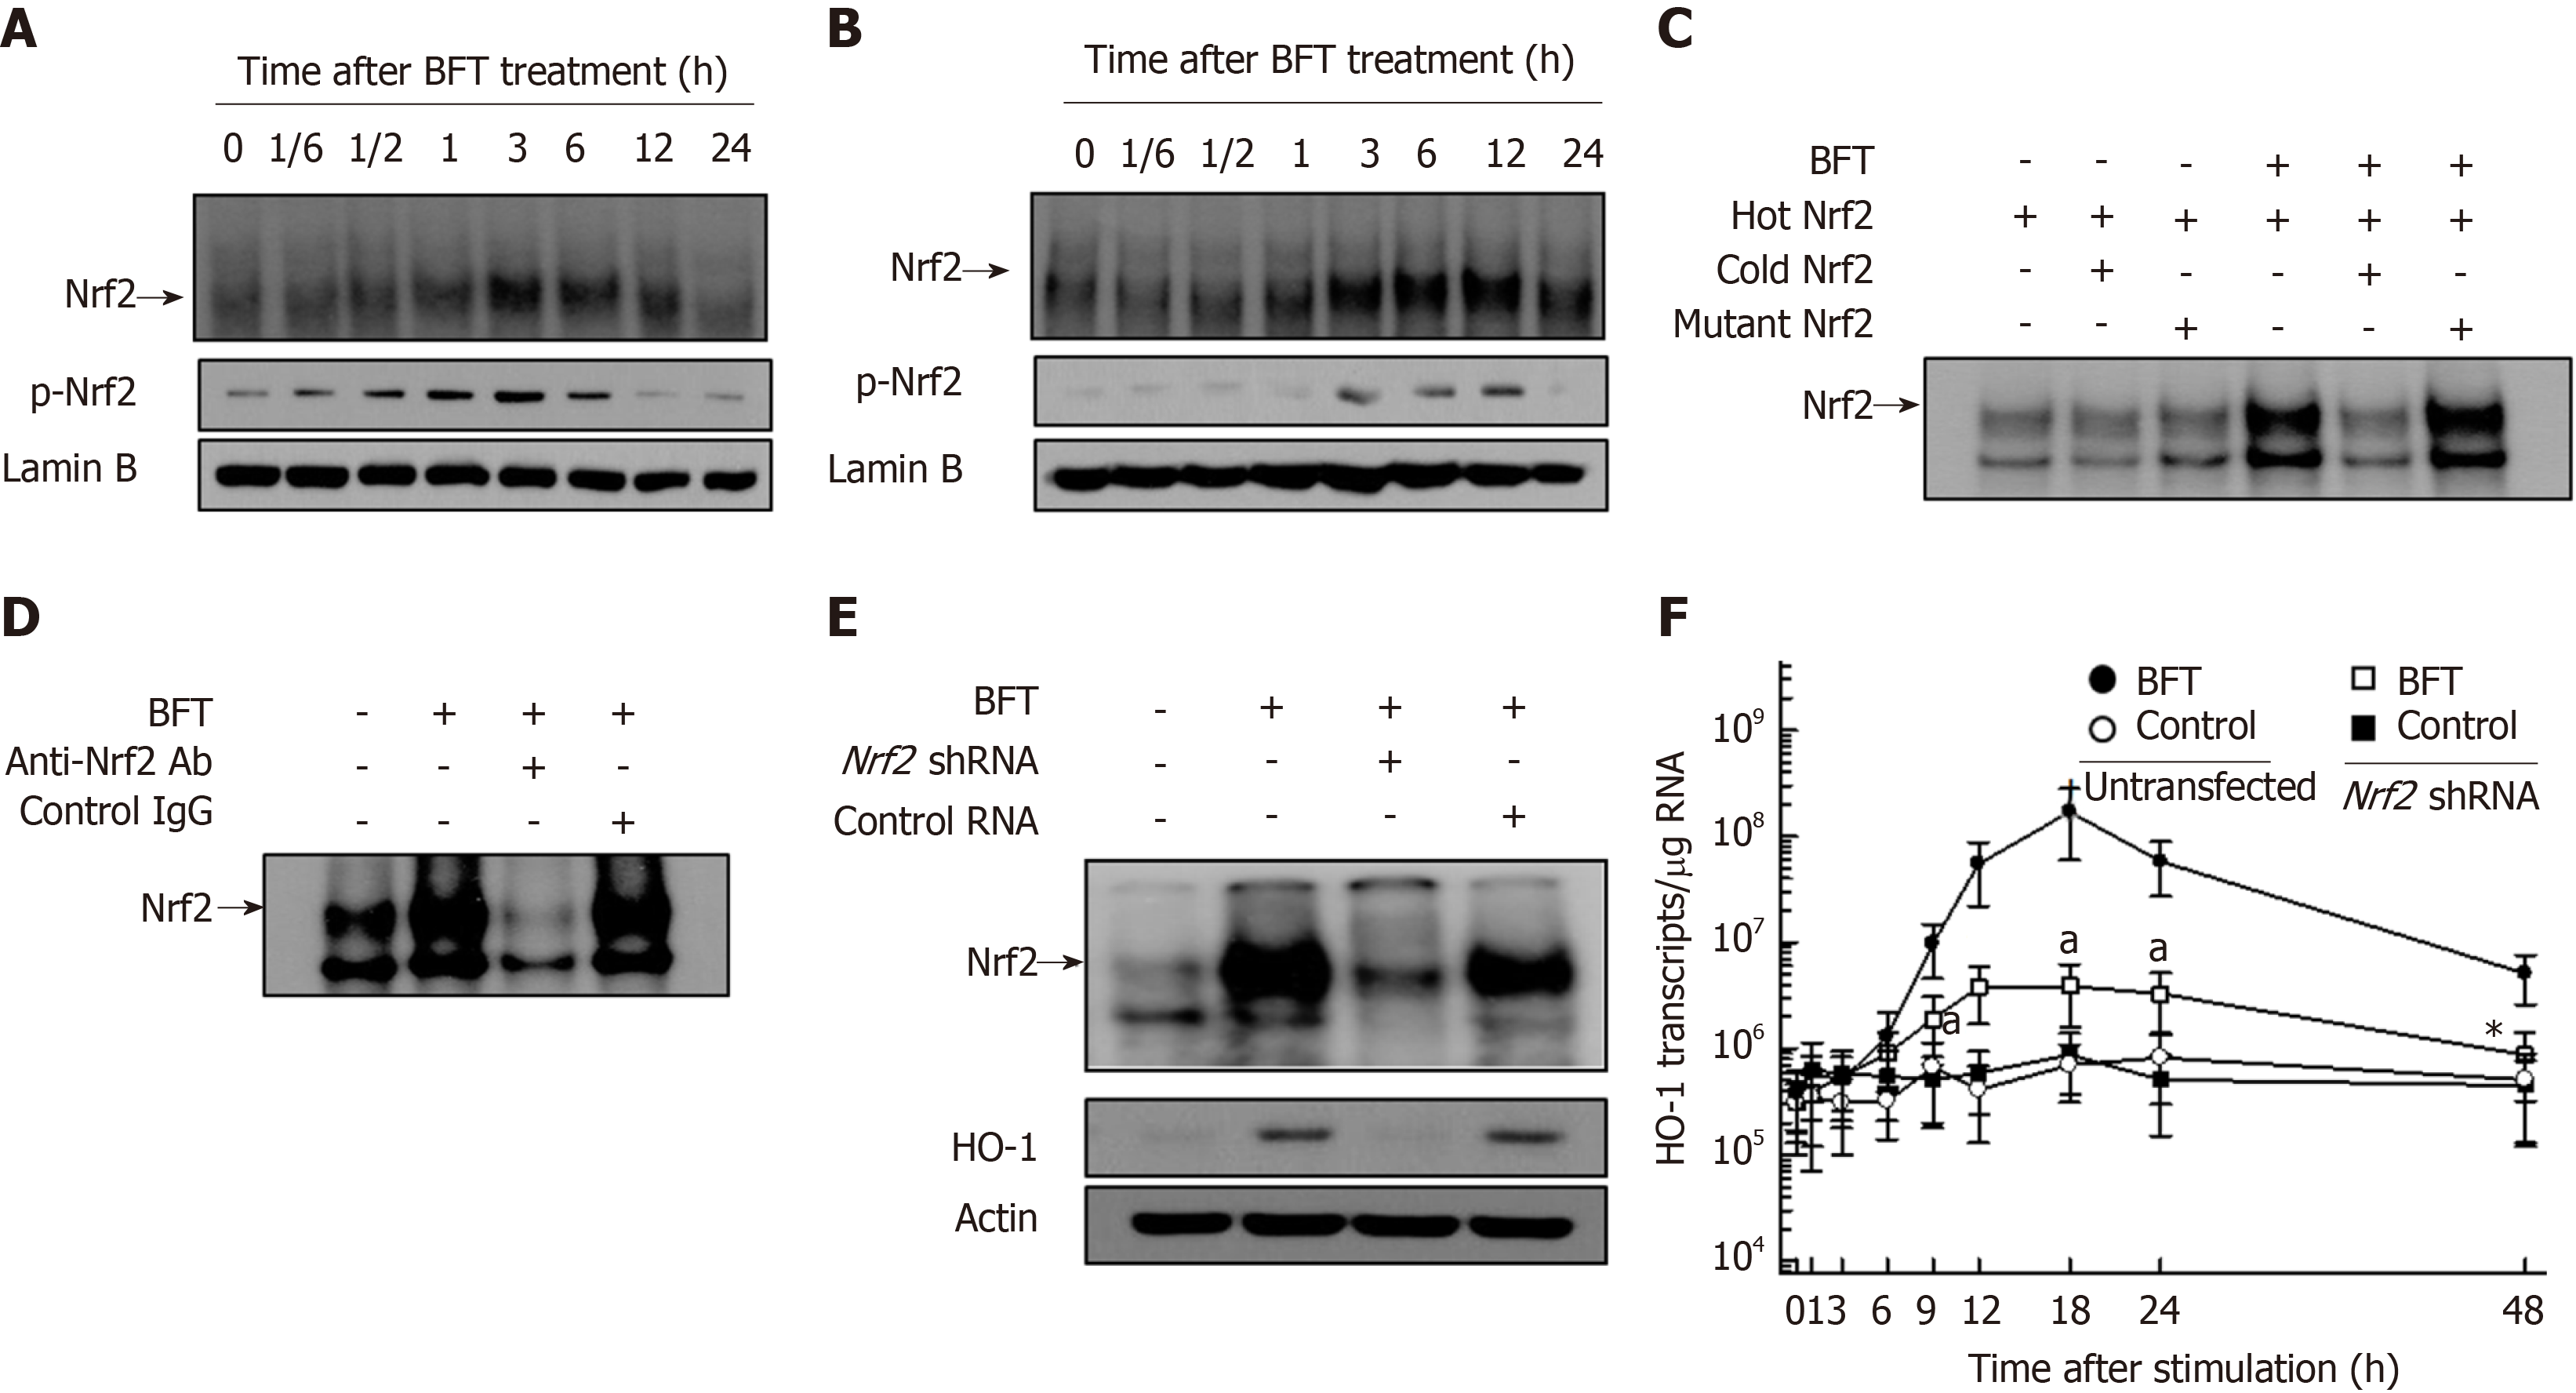
Figure 5 Activation of Nrf2 in dendritic cells stimulated with Bacteroides fragilis enterotoxin.
A and B: Bone marrow (BM)-derived dendritic cells (DCs) (A) and DC2.4 cells (B) were treated with BFT (100 ng/mL) for the indicated periods. Nrf2 DNA binding activity was assessed by EMSA. Immunoblot results for concurrent phospho-Nrf2 and lamin B in nuclear extracts are provided beneath the EMSA. C and D: Competition and supershift assays for Nrf2 signals. C: BM-derived DCs were treated with BFT (100 ng/mL) for 6 h and nuclear extracts were then prepared. The competition assay for Nrf2 signals was performed by adding a 100-fold excess of the unlabeled probe (“cold” probe) before the addition of the radiolabeled probe (“hot” probe) or a mutant probe to the reaction (top panel). D: Supershift assays using nuclear extracts were performed using anti-Nrf2 Ab and IgG isotype control Ab (bottom panel). Results are representative of more than three independent experiments. E: DC2.4 cells were transfected with Nrf2-specific shRNA or control RNA. Transfected cells were combined with BFT (100 ng/mL) for 12 h. Nrf2 binding activity was assayed by EMSA (top panel). Transfected cells were treated with BFT (100 ng/mL) for 24 h and the expression of heme oxygenase-1 (HO-1) and actin was analyzed by immunoblot (bottom panel). F: DC2.4 cells were treated with BFT (100 ng/mL) for the indicated periods. The levels of HO-1 mRNA were analyzed by quantitative RT-PCR using a standard RNA. The values are expressed as mean ± SD (n = 5). β-actin mRNA levels in each group remained relatively constant throughout the same periods (approximately 106 transcripts/μg total RNA). aP < 0.05 vs untransfected cells treated with BFT. HO-1: Heme oxygenase-1; BFT: Bacteroides fragilis toxin.
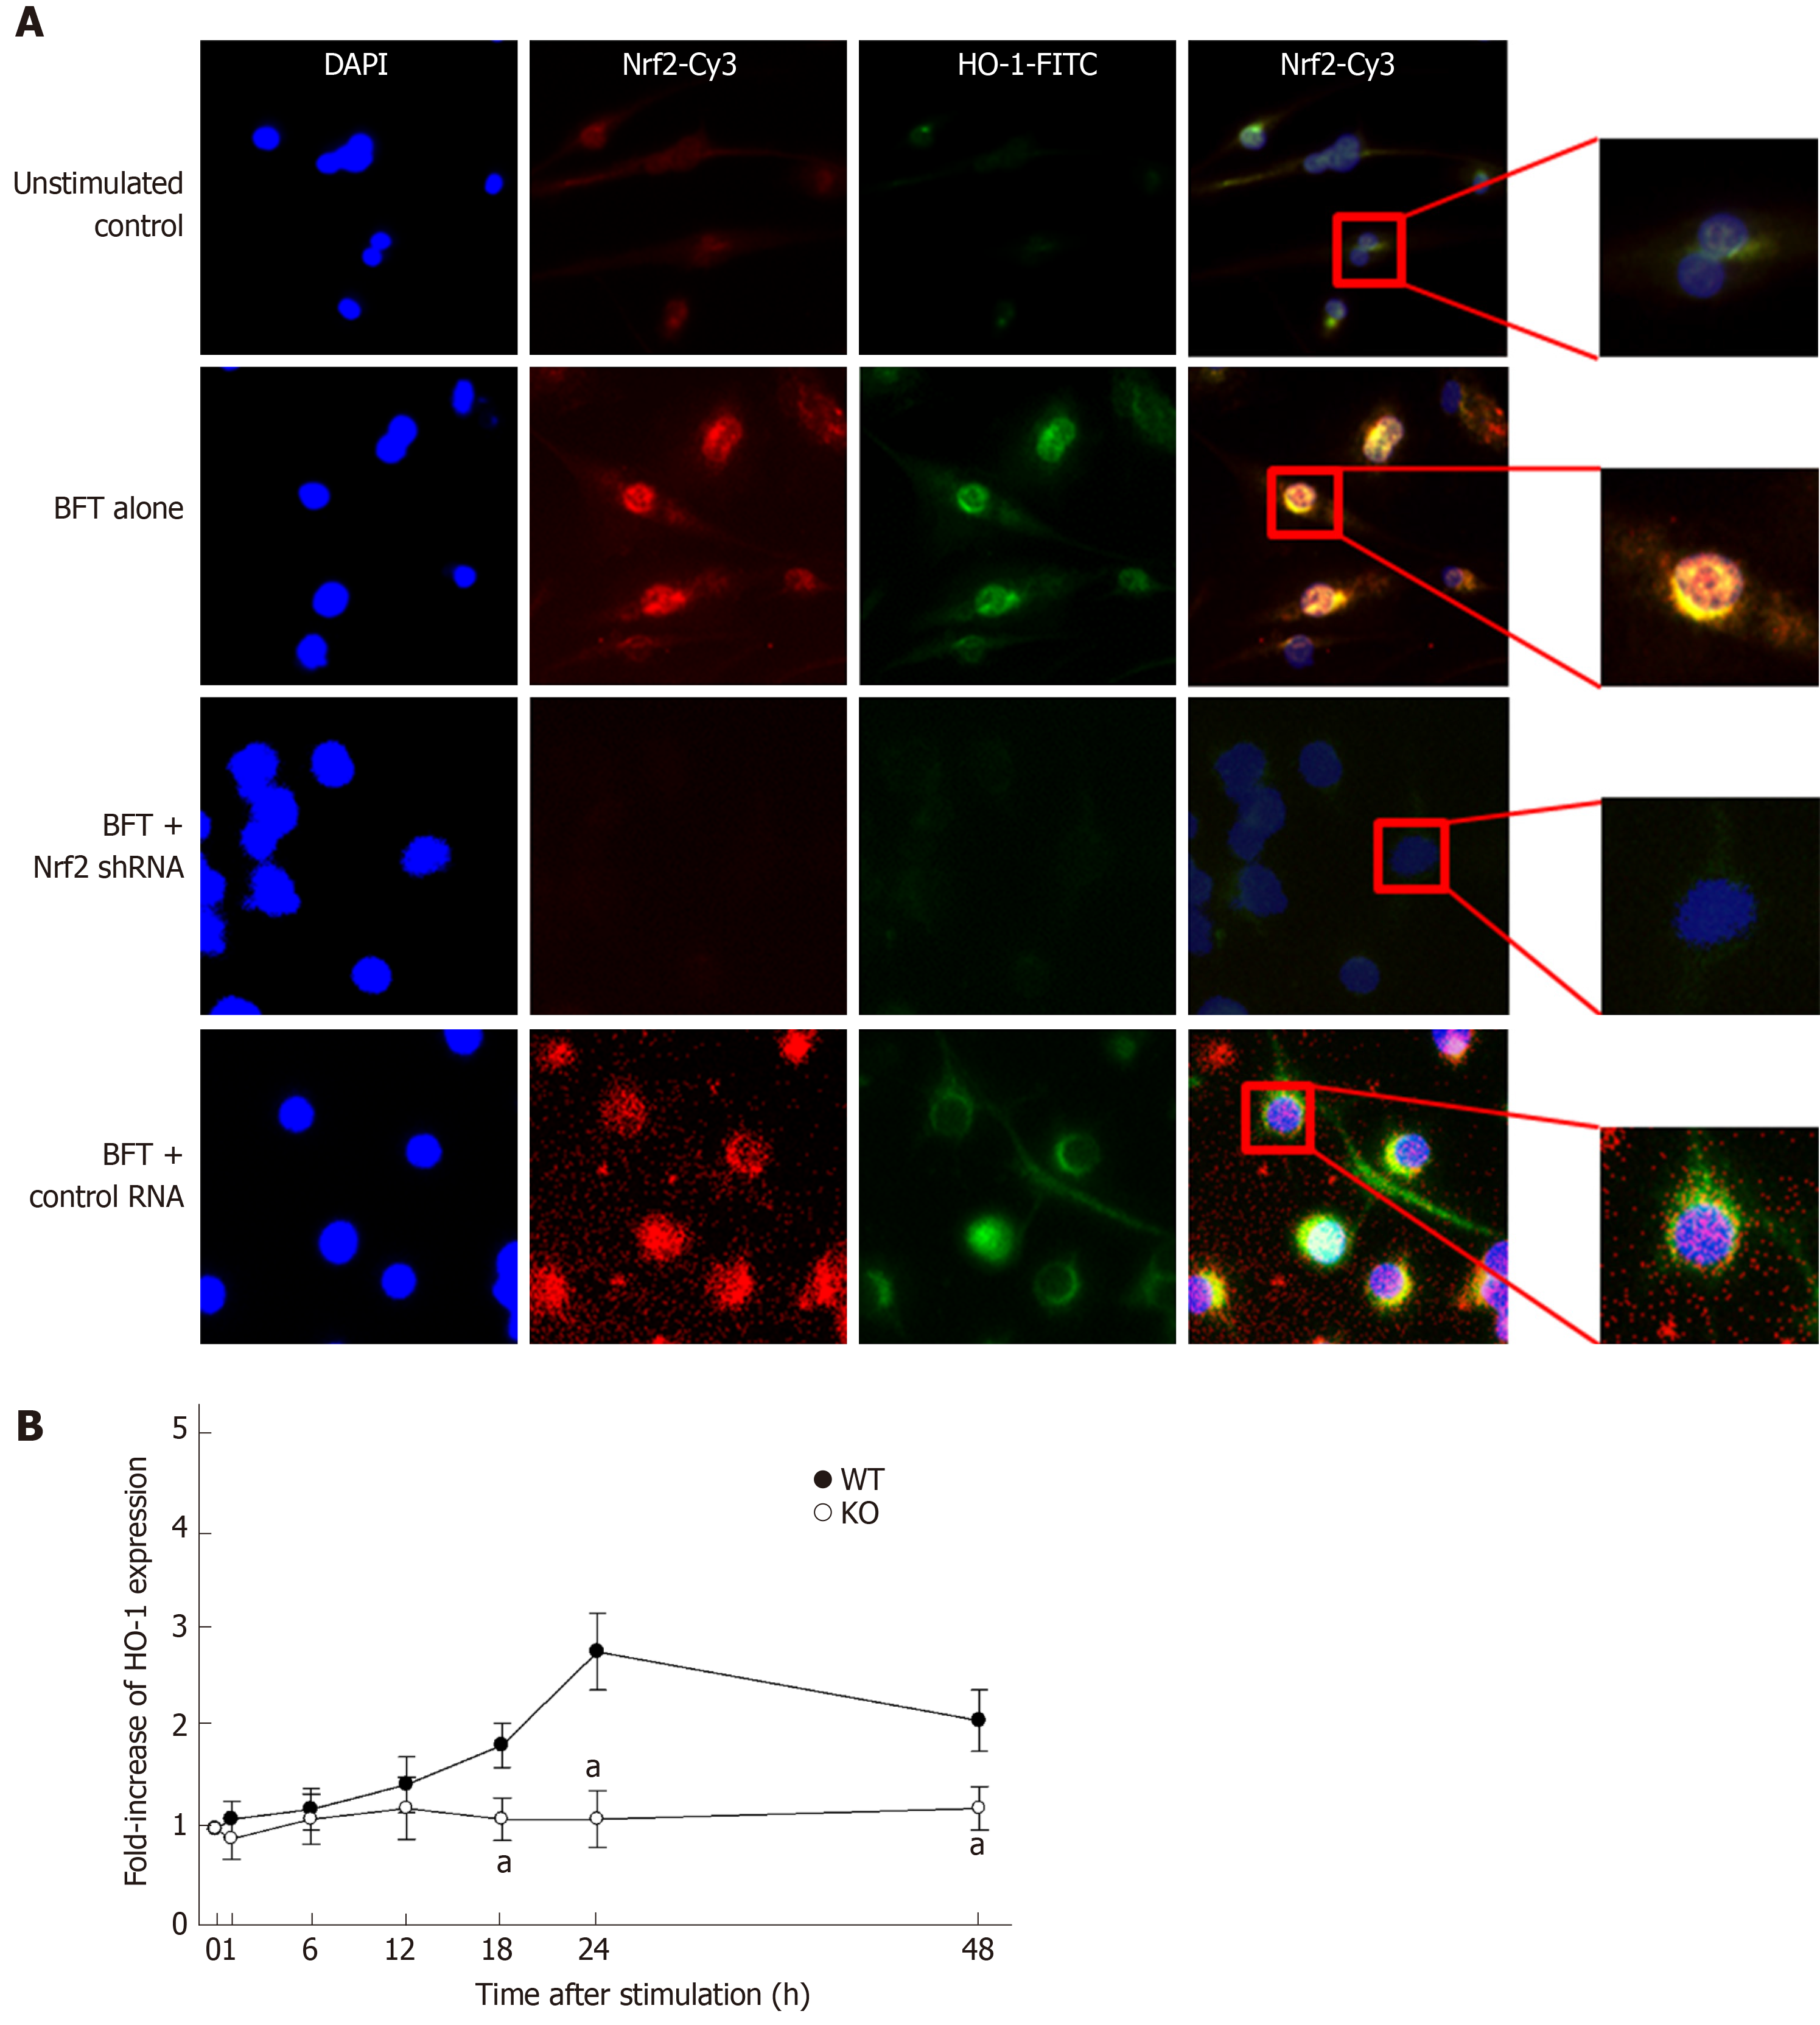
Figure 6 Effects of Nrf2 suppression on heme oxygenase-1 expression in dendritic cells stimulated with Bacteroides fragilis s enterotoxin.
A: Nrf2 translocation and heme oxygenase-1 (HO-1) expression in B. fragilis enterotoxin (BFT)-stimulated dendritic cells (DCs). DC2.4 cells were transfected with Nrf2-specific shRNA or control RNA. Cells were treated with BFT (100 ng/mL) for 24 h and immunofluorescent microscopy was performed. Each group of cells was stained with the active form-specific anti-Nrf2-Cys Ab (red), anti-HO-1 Ab (green), and DAPI (blue, nucleus). The data are representative of at least five experiments. B: HO-1 expression in cells derived from wild-type and Nrf2−/− knockout mice. BMDCs derived from wild-type or Nrf2−/− knockout mice were exposed to BFT (100 ng/mL) for the indicated periods. Expression of HO-1 protein in each panel was measured by ELISA (mean ± SE, n=5). aP < 0.05 vs each group of cells derived from wild-type mice. HO-1: Heme oxygenase-1; BFT: Bacteroides fragilis toxin; WT: Wild-type; KO: Knockout.
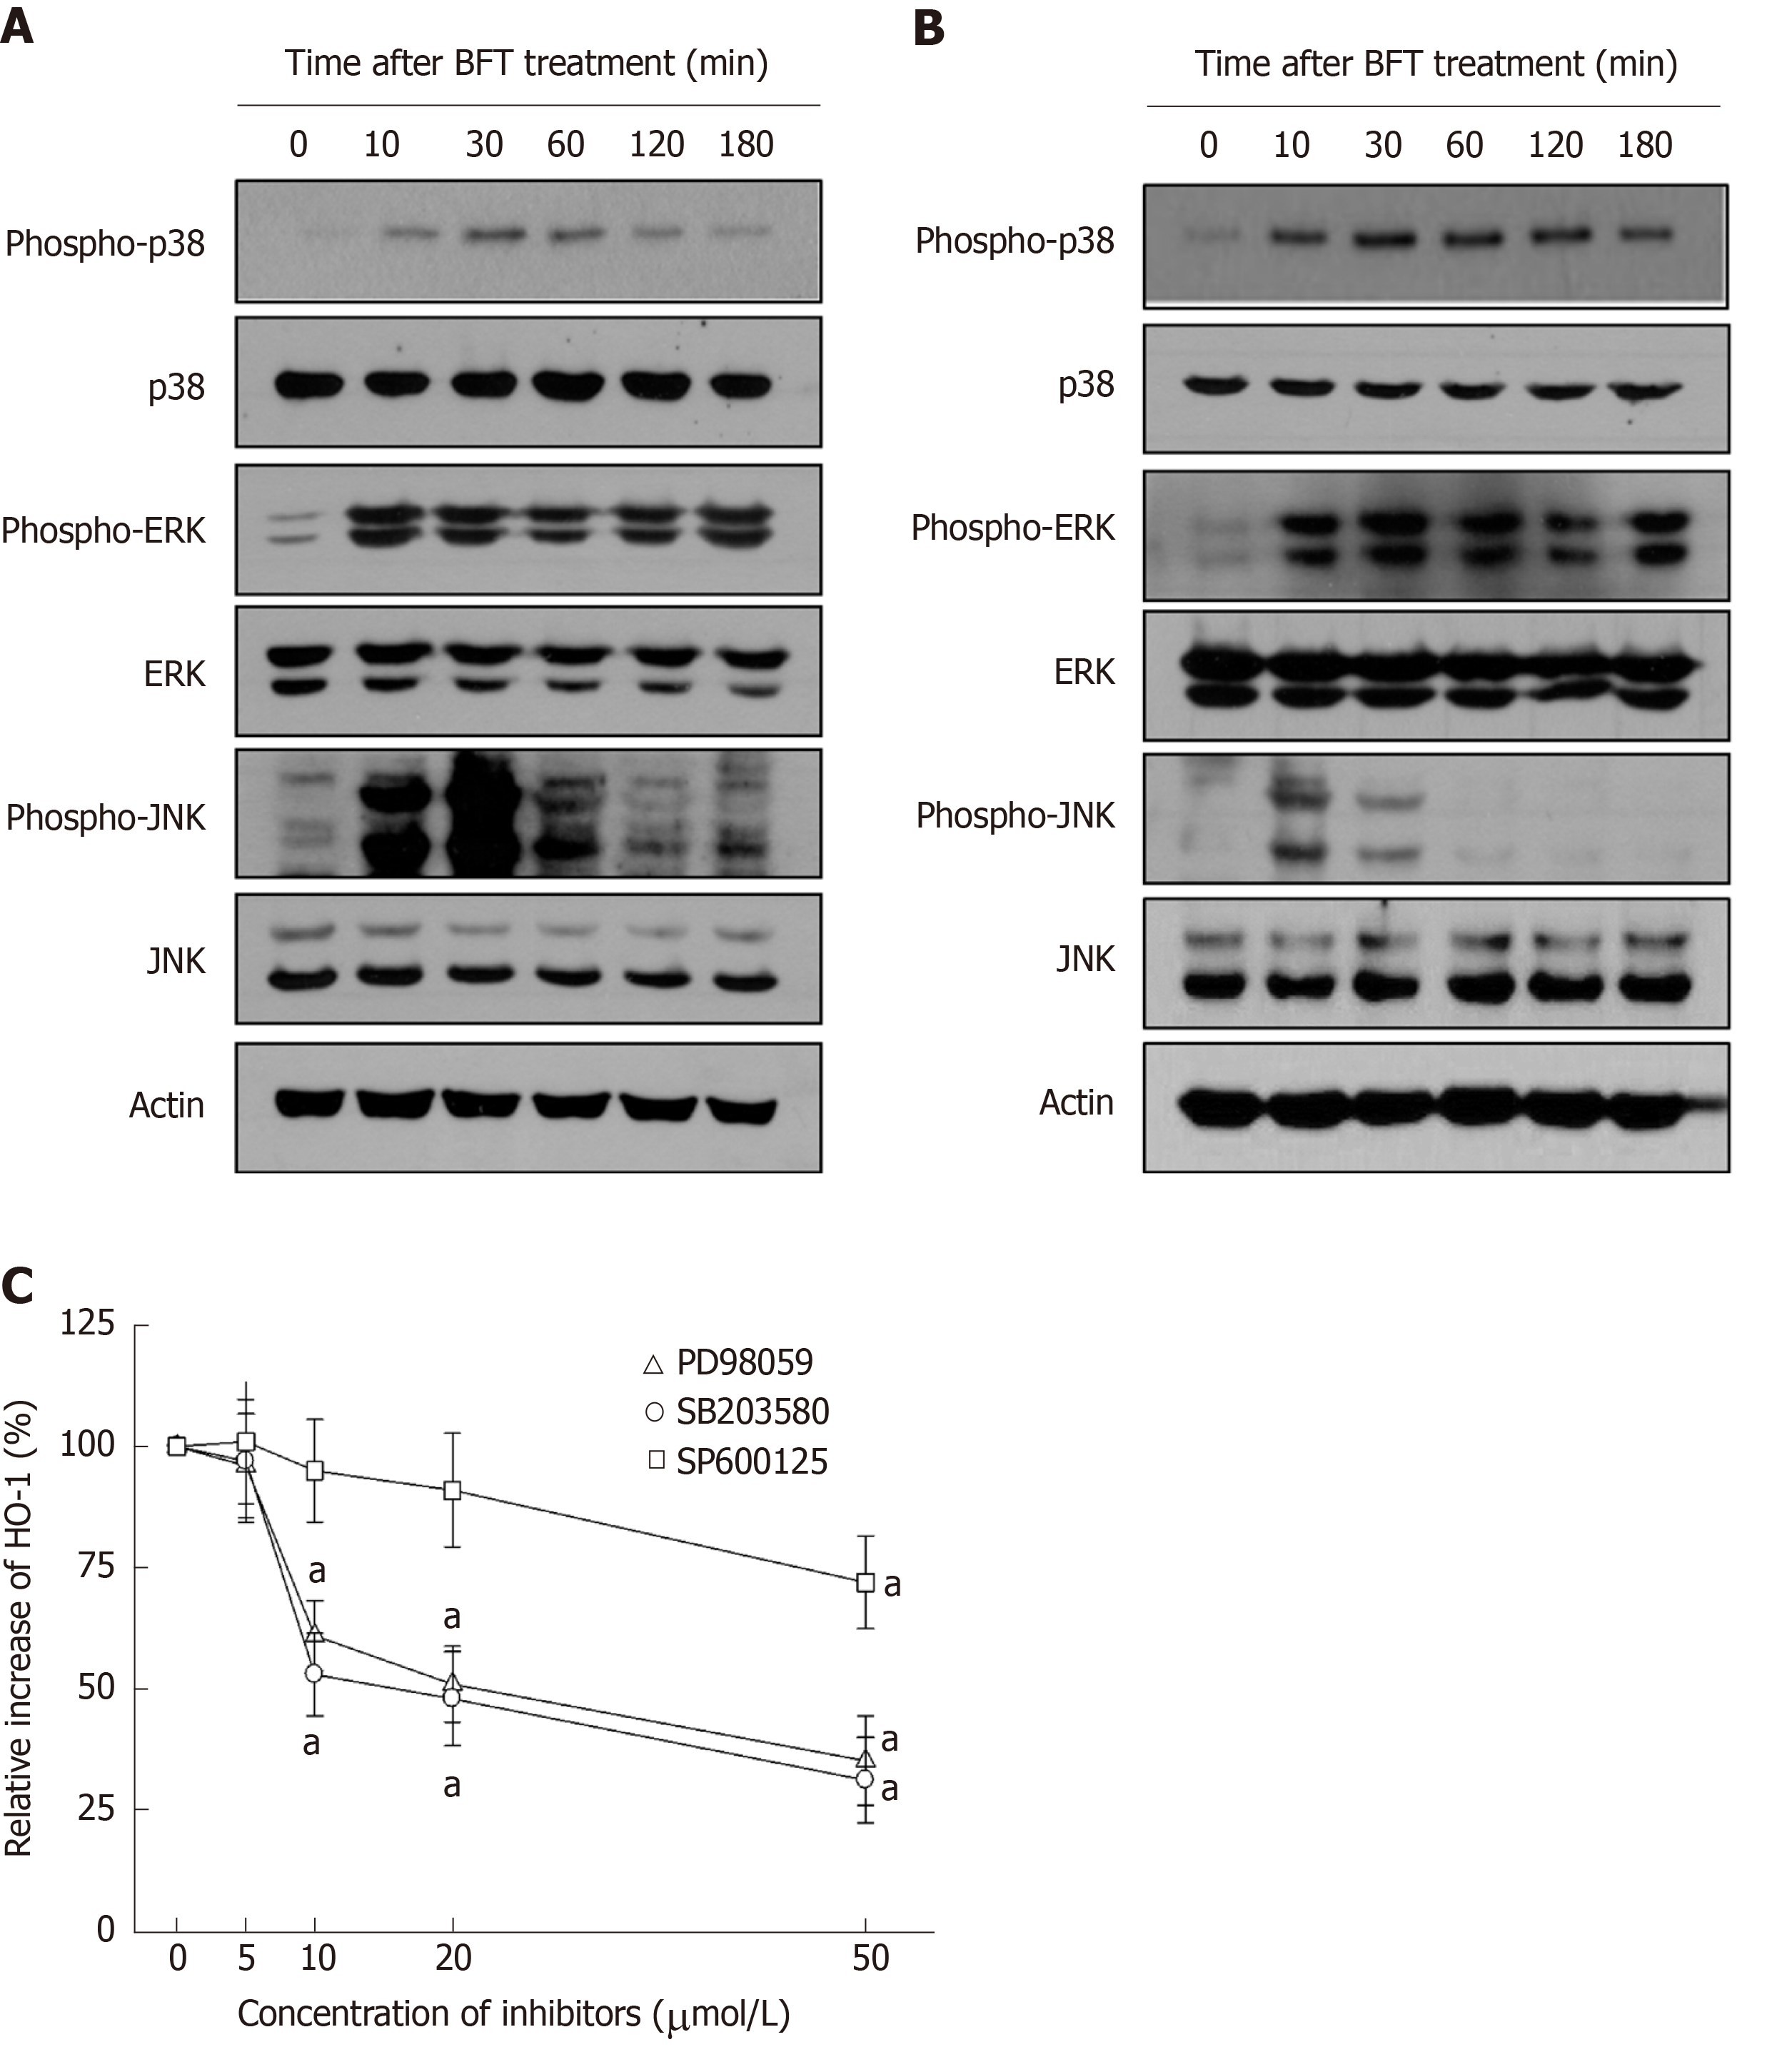
Figure 7 Mitogen-activated protein kinases signals associated with heme oxygenase-1 expression in Bacteroides fragilis enterotoxin-stimulated dendritic cells.
A and B: Bone marrow (BM)-derived dendritic cells (DCs) (A) and DC2.4 cells (B) were stimulated with Bacteroides fragilis toxin (BFT) (100 ng/mL) for the indicated periods. ERK1/2, p38, and JNK activities were measured by immunoblot analysis. Results are representative of three independent experiments. C: BM-derived DCs were preincubated with SB203580 (open circle), PD98059 (open triangle), or SP600125 (open square) for 30 min, and then stimulated with BFT (100 ng/mL) for another 24 h. Expression levels of heme oxygenase-1 (HO-1) protein were determined by ELISA. Data are expressed as the mean % increase relative to unstimulated controls ± SE (n = 5). aP < 0.05 vs BFT alone. HO-1: Heme oxygenase-1.
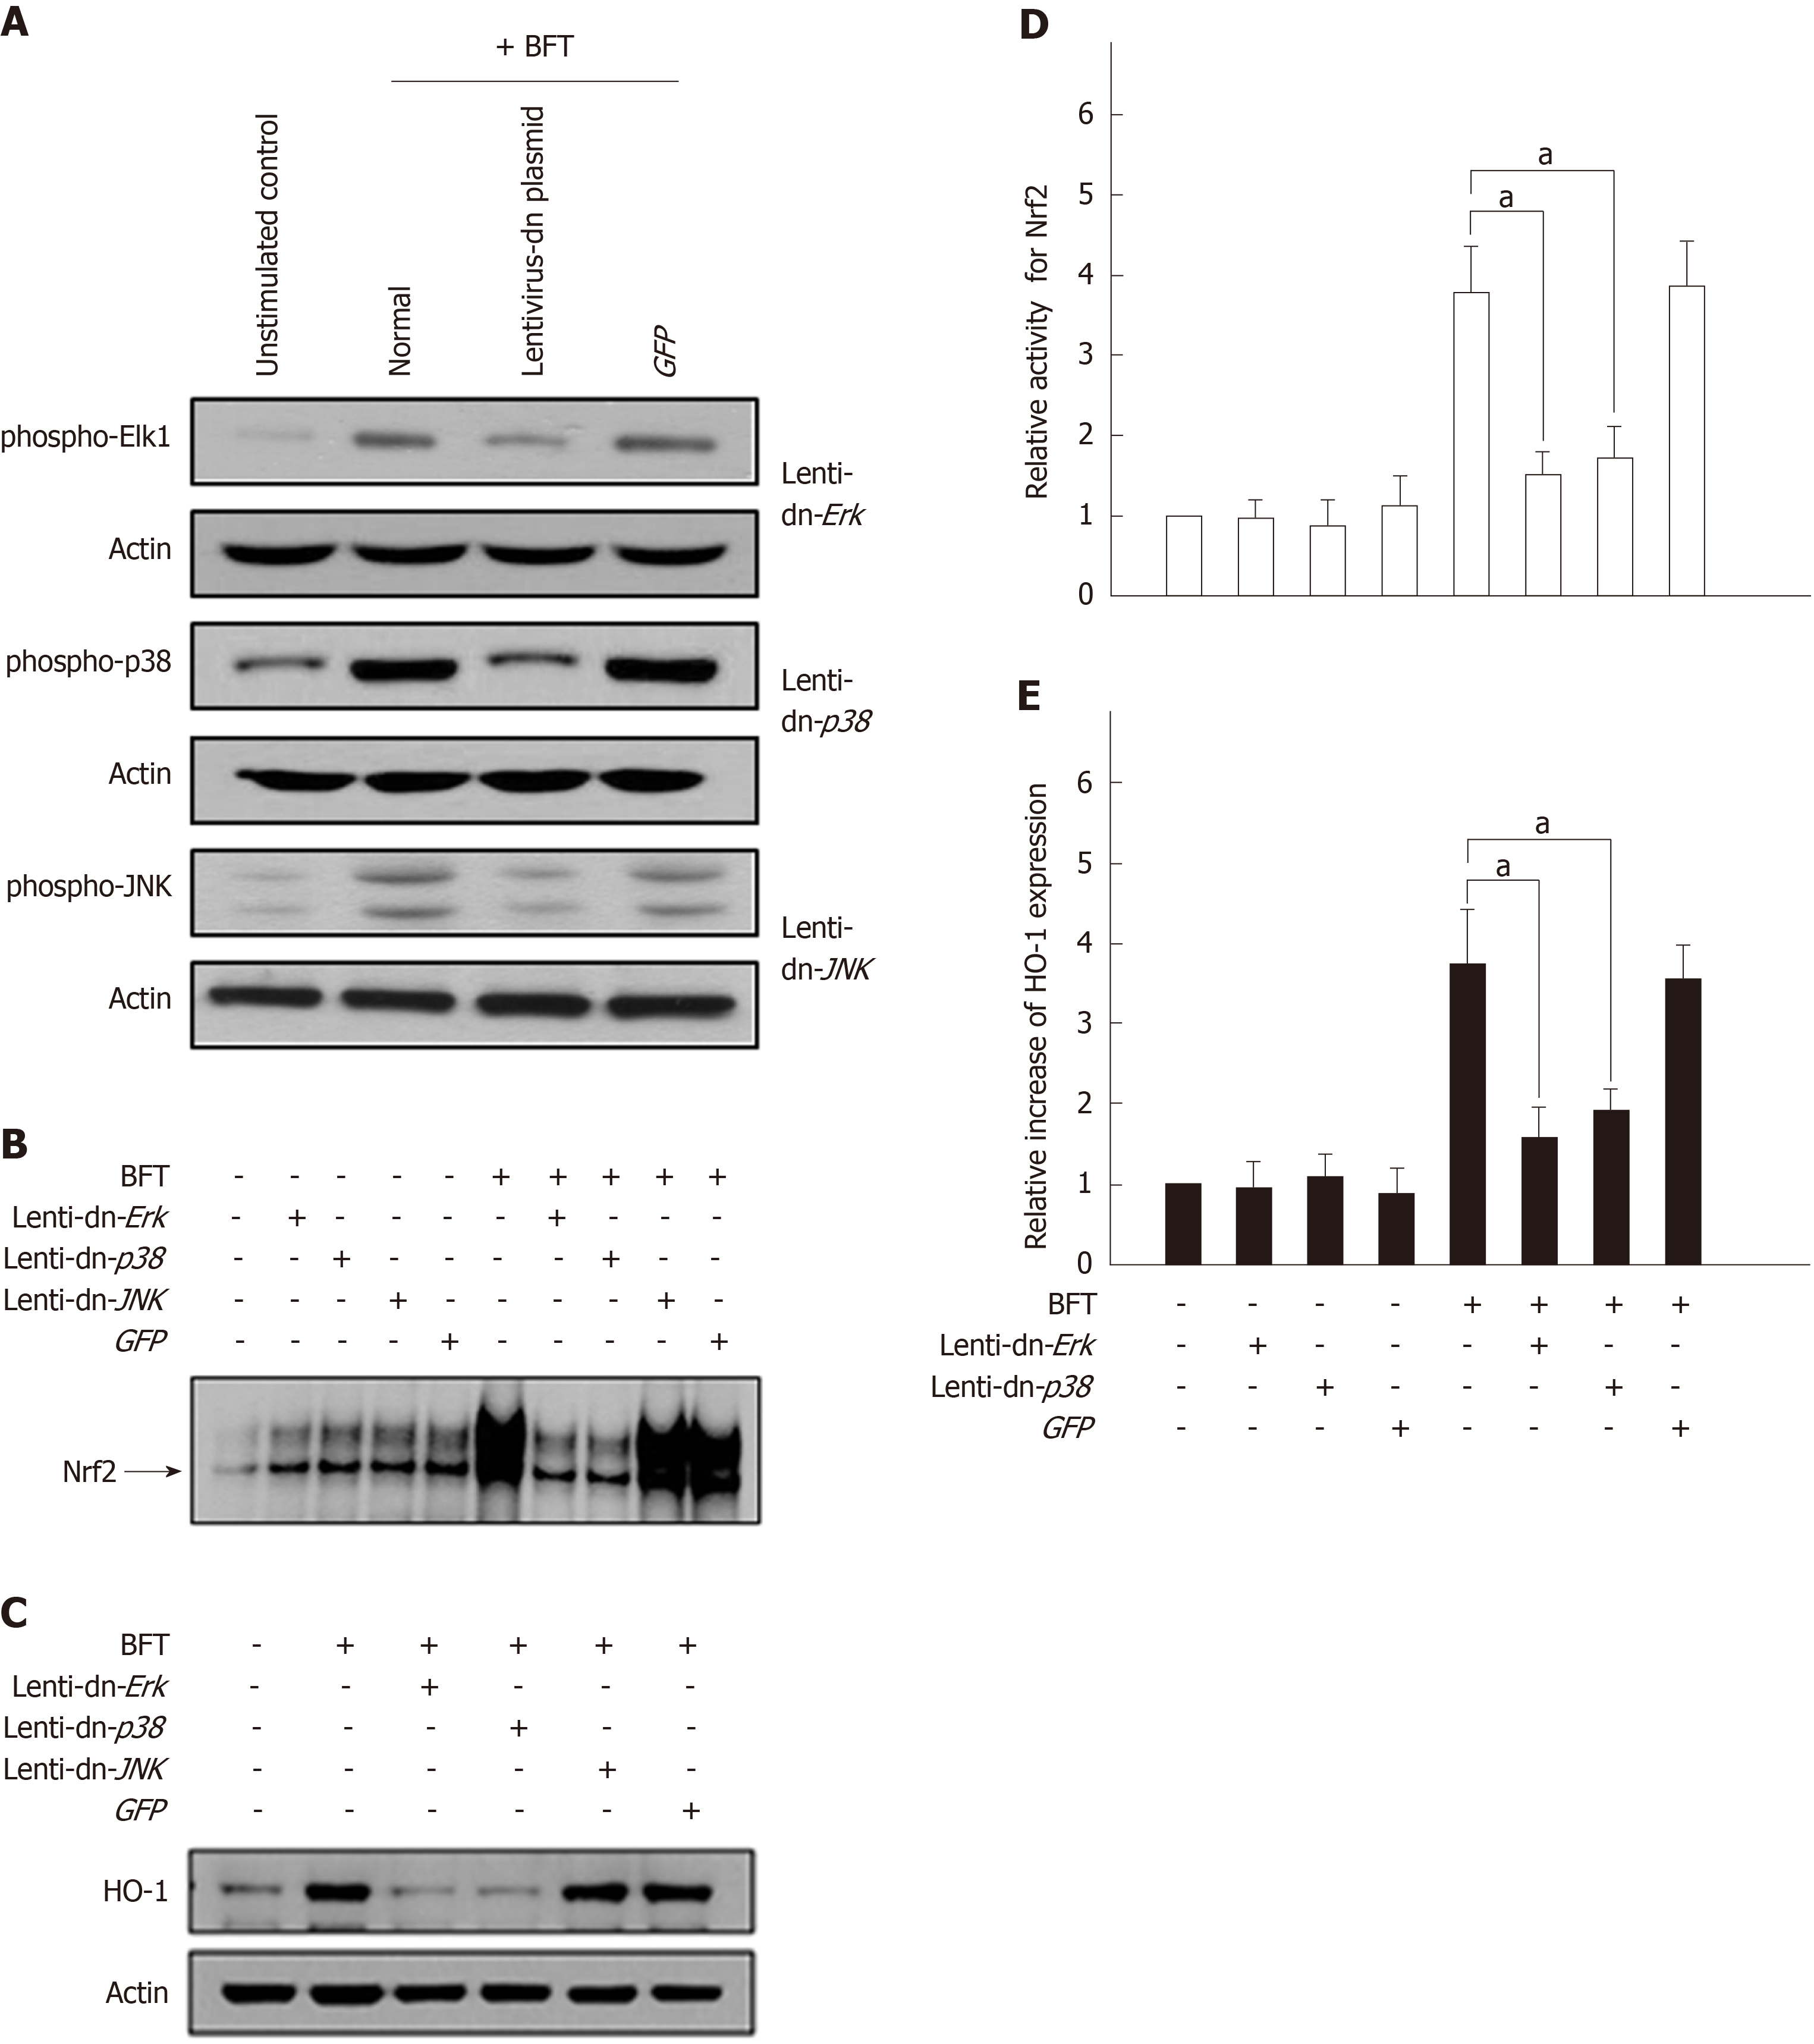
Figure 8 Effects of mitogen-activated protein kinases suppression on heme oxygenase-1 expression in dendritic cells stimulated with Bacteroides fragilis enterotoxin.
A: DC2.4 cells were infected with lentiviruses containing either a dominant-negative or control plasmid (GFP). Transfected cells were stimulated with BFT (100 ng/mL) for 30 min and immunoblots were then performed. Results are representative of three independent experiments. B and C: Transfected cells were stimulated with BFT (100 ng/mL) for 3 h (Nrf2) or 24 h (heme oxygenase-1, HO-1). B: DNA binding activities of Nrf2 were evaluated by EMSA. C: Expression of HO-1 and actin was analyzed by immunoblot. Results are representative of more than three independent experiments. D: Transfected cells were stimulated with BFT (100 ng/mL) for 3 h. Phospho-Nrf2 activities were measured using an ELISA kit. Data are expressed as mean fold induction ± SE of Nrf2 relative to untreated controls (n = 5). E: Transfected cells were stimulated with BFT (100 ng/mL) for 24 h. Transfected cells were either left untreated or stimulated with BFT (100 ng/mL) for another 6 h (Nrf2) or 24 h (HO-1). Each ELISA kit measured activities of phospho-IκBα and Nrf2, as well as HO-1 expression. Data are expressed as mean fold induction ± SE (%) relative to untreated controls (n = 5). aP < 0.05. HO-1: Heme oxygenase-1; BFT: Bacteroides fragilis toxin.
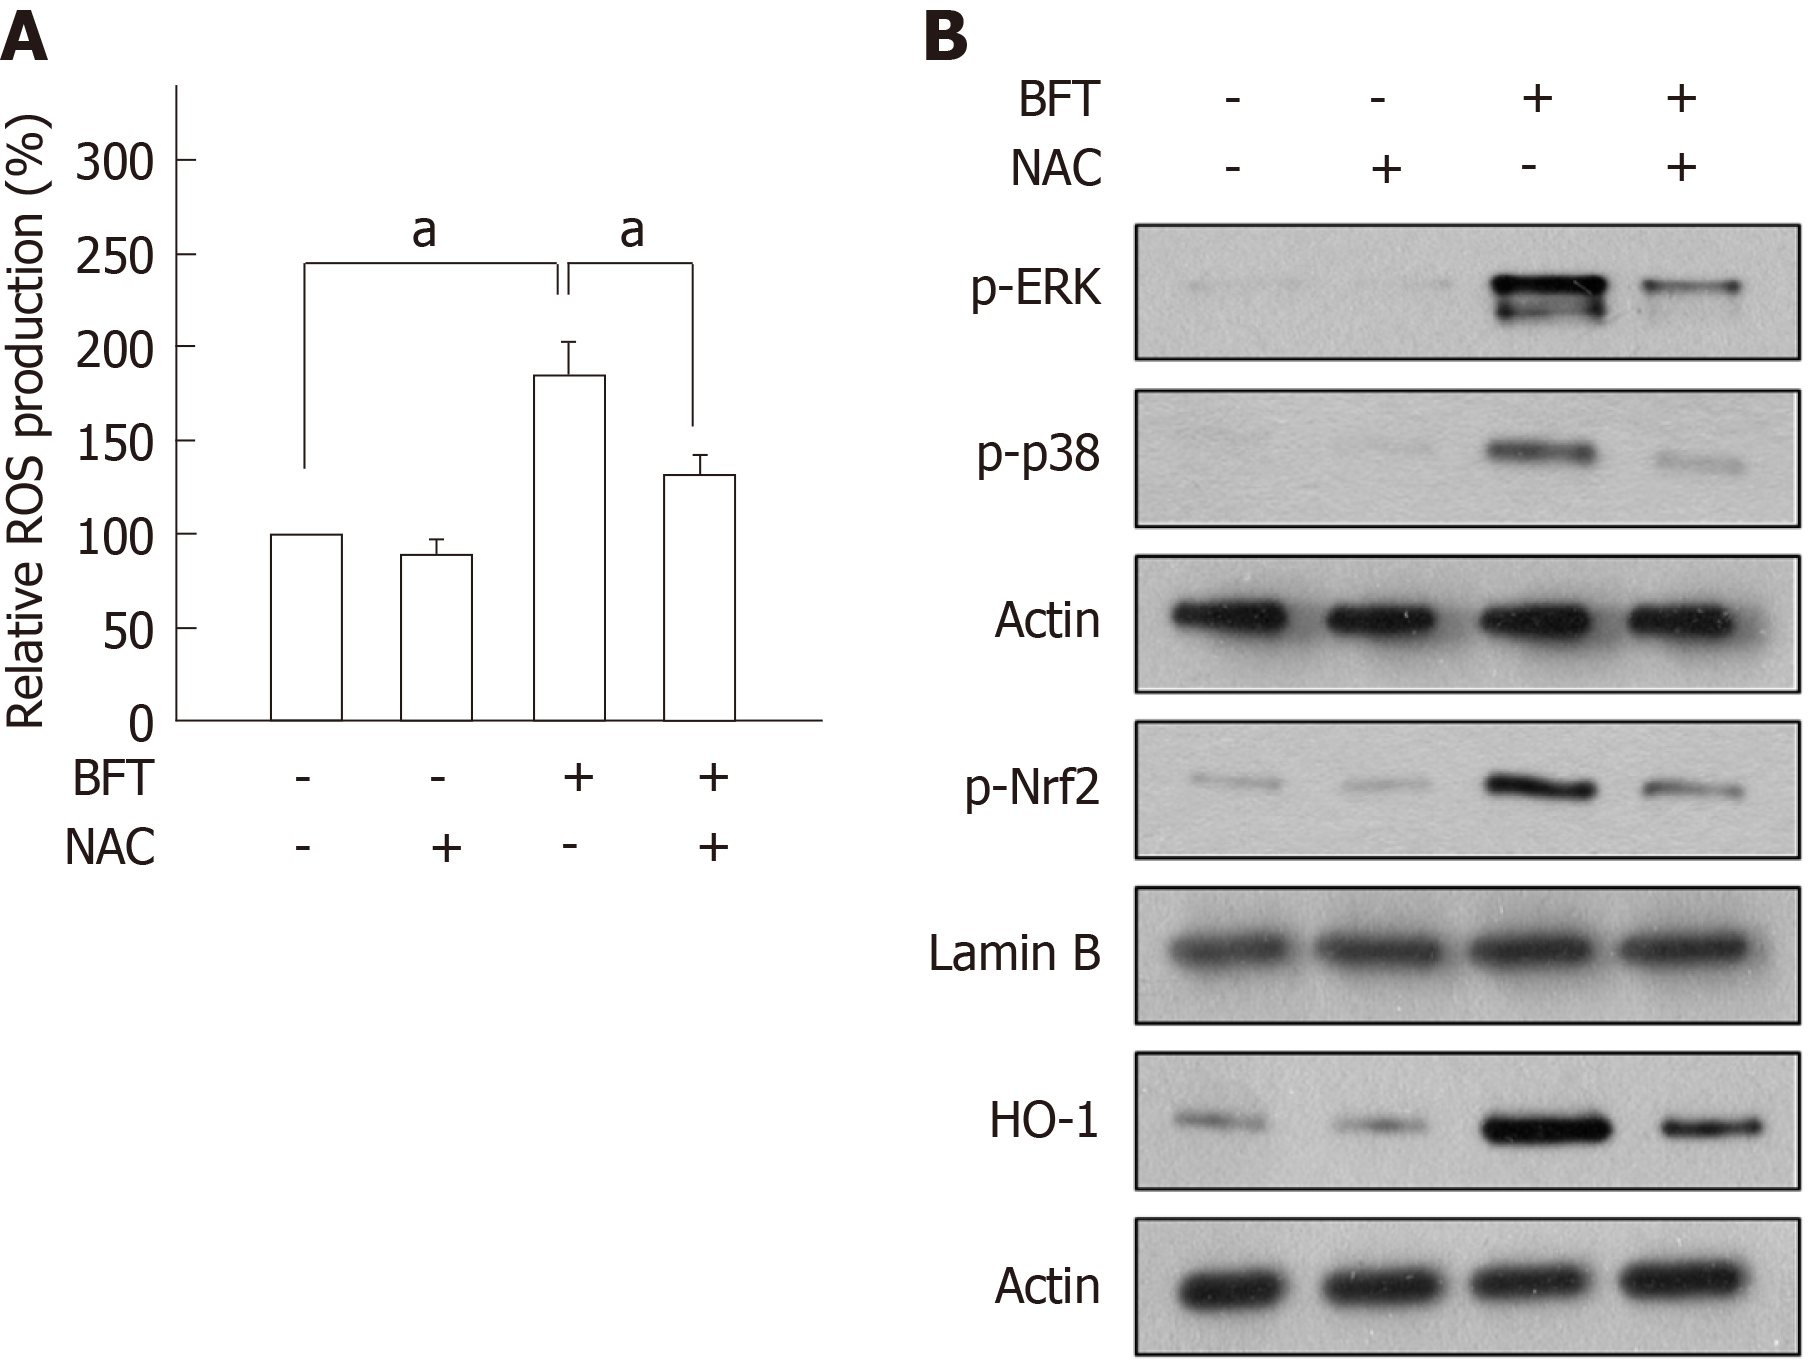
Figure 9 Reactive oxygen species mediated Bacteroides fragilis enterotoxin-induced heme oxygenase-1 expression in dendritic cells.
A: DC2.4 cells were stimulated with BFT (100 ng/mL) in the absence or presence of the antioxidant N-acetyl-L-cysteine (NAC, 0.5 mmol/L) for 6 h. Production of reactive oxygen species (ROS) was measured by a commercially available ROS detection kit. Data are expressed as mean fold induction ± SE (%) relative to untreated controls (n = 5). aP < 0.05. B: DC2.4 cells were stimulated with BFT (100 ng/mL) in the absence or presence of NAC (0.5 mmol/L) for 30 min (phospho-ERK and phospho-p38), 3 h (phospho-Nrf2), or 24 h (heme oxygenase-1, HO-1). The effects of NAC on each protein level were determined using immunoblot. Results are representative of three independent experiments. NAC: N-acetyl-L-cysteine; HO-1: Heme oxygenase-1; BFT: Bacteroides fragilis toxin.
- Citation: Ko SH, Jeon JI, Woo HA, Kim JM. Bacteroides fragilis enterotoxin upregulates heme oxygenase-1 in dendritic cells via reactive oxygen species-, mitogen-activated protein kinase-, and Nrf2-dependent pathway. World J Gastroenterol 2020; 26(3): 291-306
- URL: https://www.wjgnet.com/1007-9327/full/v26/i3/291.htm
- DOI: https://dx.doi.org/10.3748/wjg.v26.i3.291


