Copyright
©The Author(s) 2020.
World J Gastroenterol. Jun 14, 2020; 26(22): 3024-3033
Published online Jun 14, 2020. doi: 10.3748/wjg.v26.i22.3024
Published online Jun 14, 2020. doi: 10.3748/wjg.v26.i22.3024
Figure 1 COL10A1 expression in gastric cancer tissue.
A: Overexpression of COL10A1 gene in gastric tumor tissue compared to normal gastric tissue. Values are represented as mean ± SD; B: Overexpression of COL10A1 protein in gastric tumor tissue compared to normal gastric tissue. aP < 0.05. TNM: Tumor, node, and metastasis.
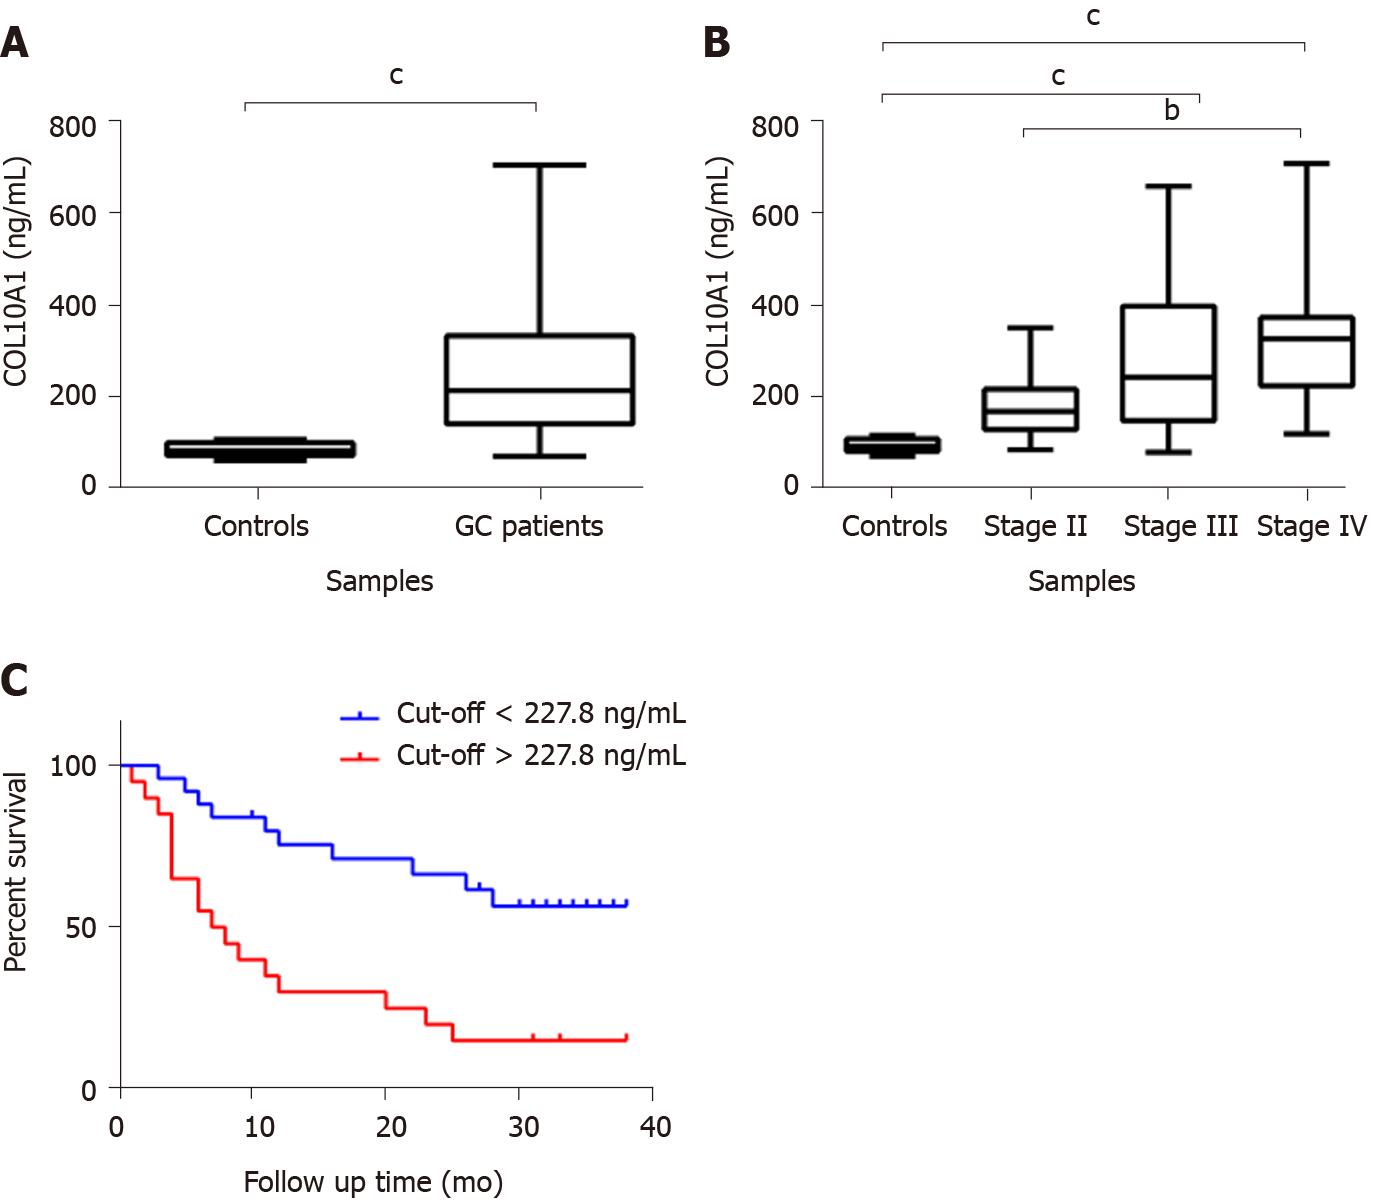
Figure 2 COL10A1 expression in gastric cancer plasma.
A: Overexpression of circulating COL10A1 in gastric adenocarcinoma patients compared to cancer-free controls. Values are represented as mean ± SD; B: Increased COL10A1 plasma level is correlated with tumor progression. C: Kaplan-Meier survival plots for gastric adenocarcinoma patients. Tick marks represent the time of the last follow-up. High COL10A1 plasma levels (> 227.8 ng/mL) were significantly associated with shorter survival in gastric adenocarcinoma patients. bP < 0.02, cP < 0.007. GC: Gastric cancer.
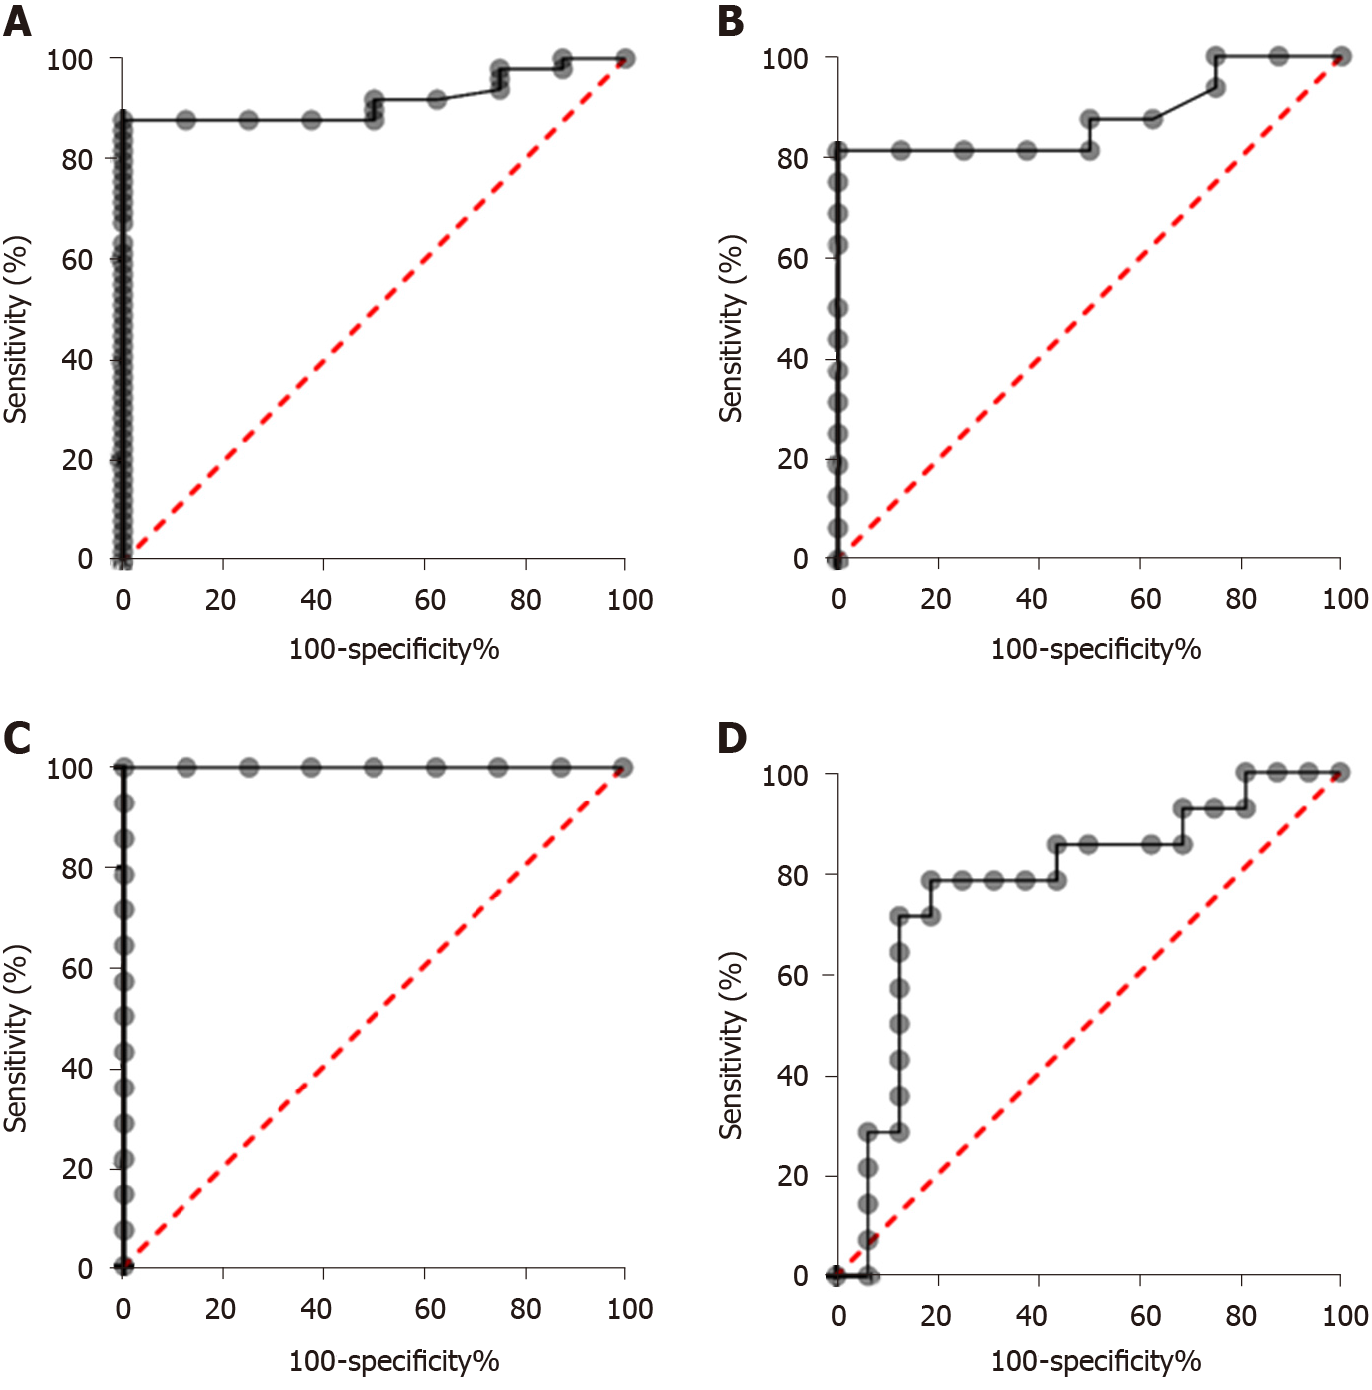
Figure 3 Receiver operating characteristic curve analysis in the diagnosis of gastric cancer.
A: Patients vs control; B: Early-stage gastric cancer (GC) patients vs control; C: Advanced-stage GC patients vs control; D: Early-stage GC patients vs advanced-stage GC patients.
- Citation: Necula L, Matei L, Dragu D, Pitica I, Neagu AI, Bleotu C, Dima S, Popescu I, Diaconu CC, Chivu-Economescu M. High plasma levels of COL10A1 are associated with advanced tumor stage in gastric cancer patients. World J Gastroenterol 2020; 26(22): 3024-3033
- URL: https://www.wjgnet.com/1007-9327/full/v26/i22/3024.htm
- DOI: https://dx.doi.org/10.3748/wjg.v26.i22.3024


