Copyright
©The Author(s) 2020.
World J Gastroenterol. May 14, 2020; 26(18): 2203-2220
Published online May 14, 2020. doi: 10.3748/wjg.v26.i18.2203
Published online May 14, 2020. doi: 10.3748/wjg.v26.i18.2203
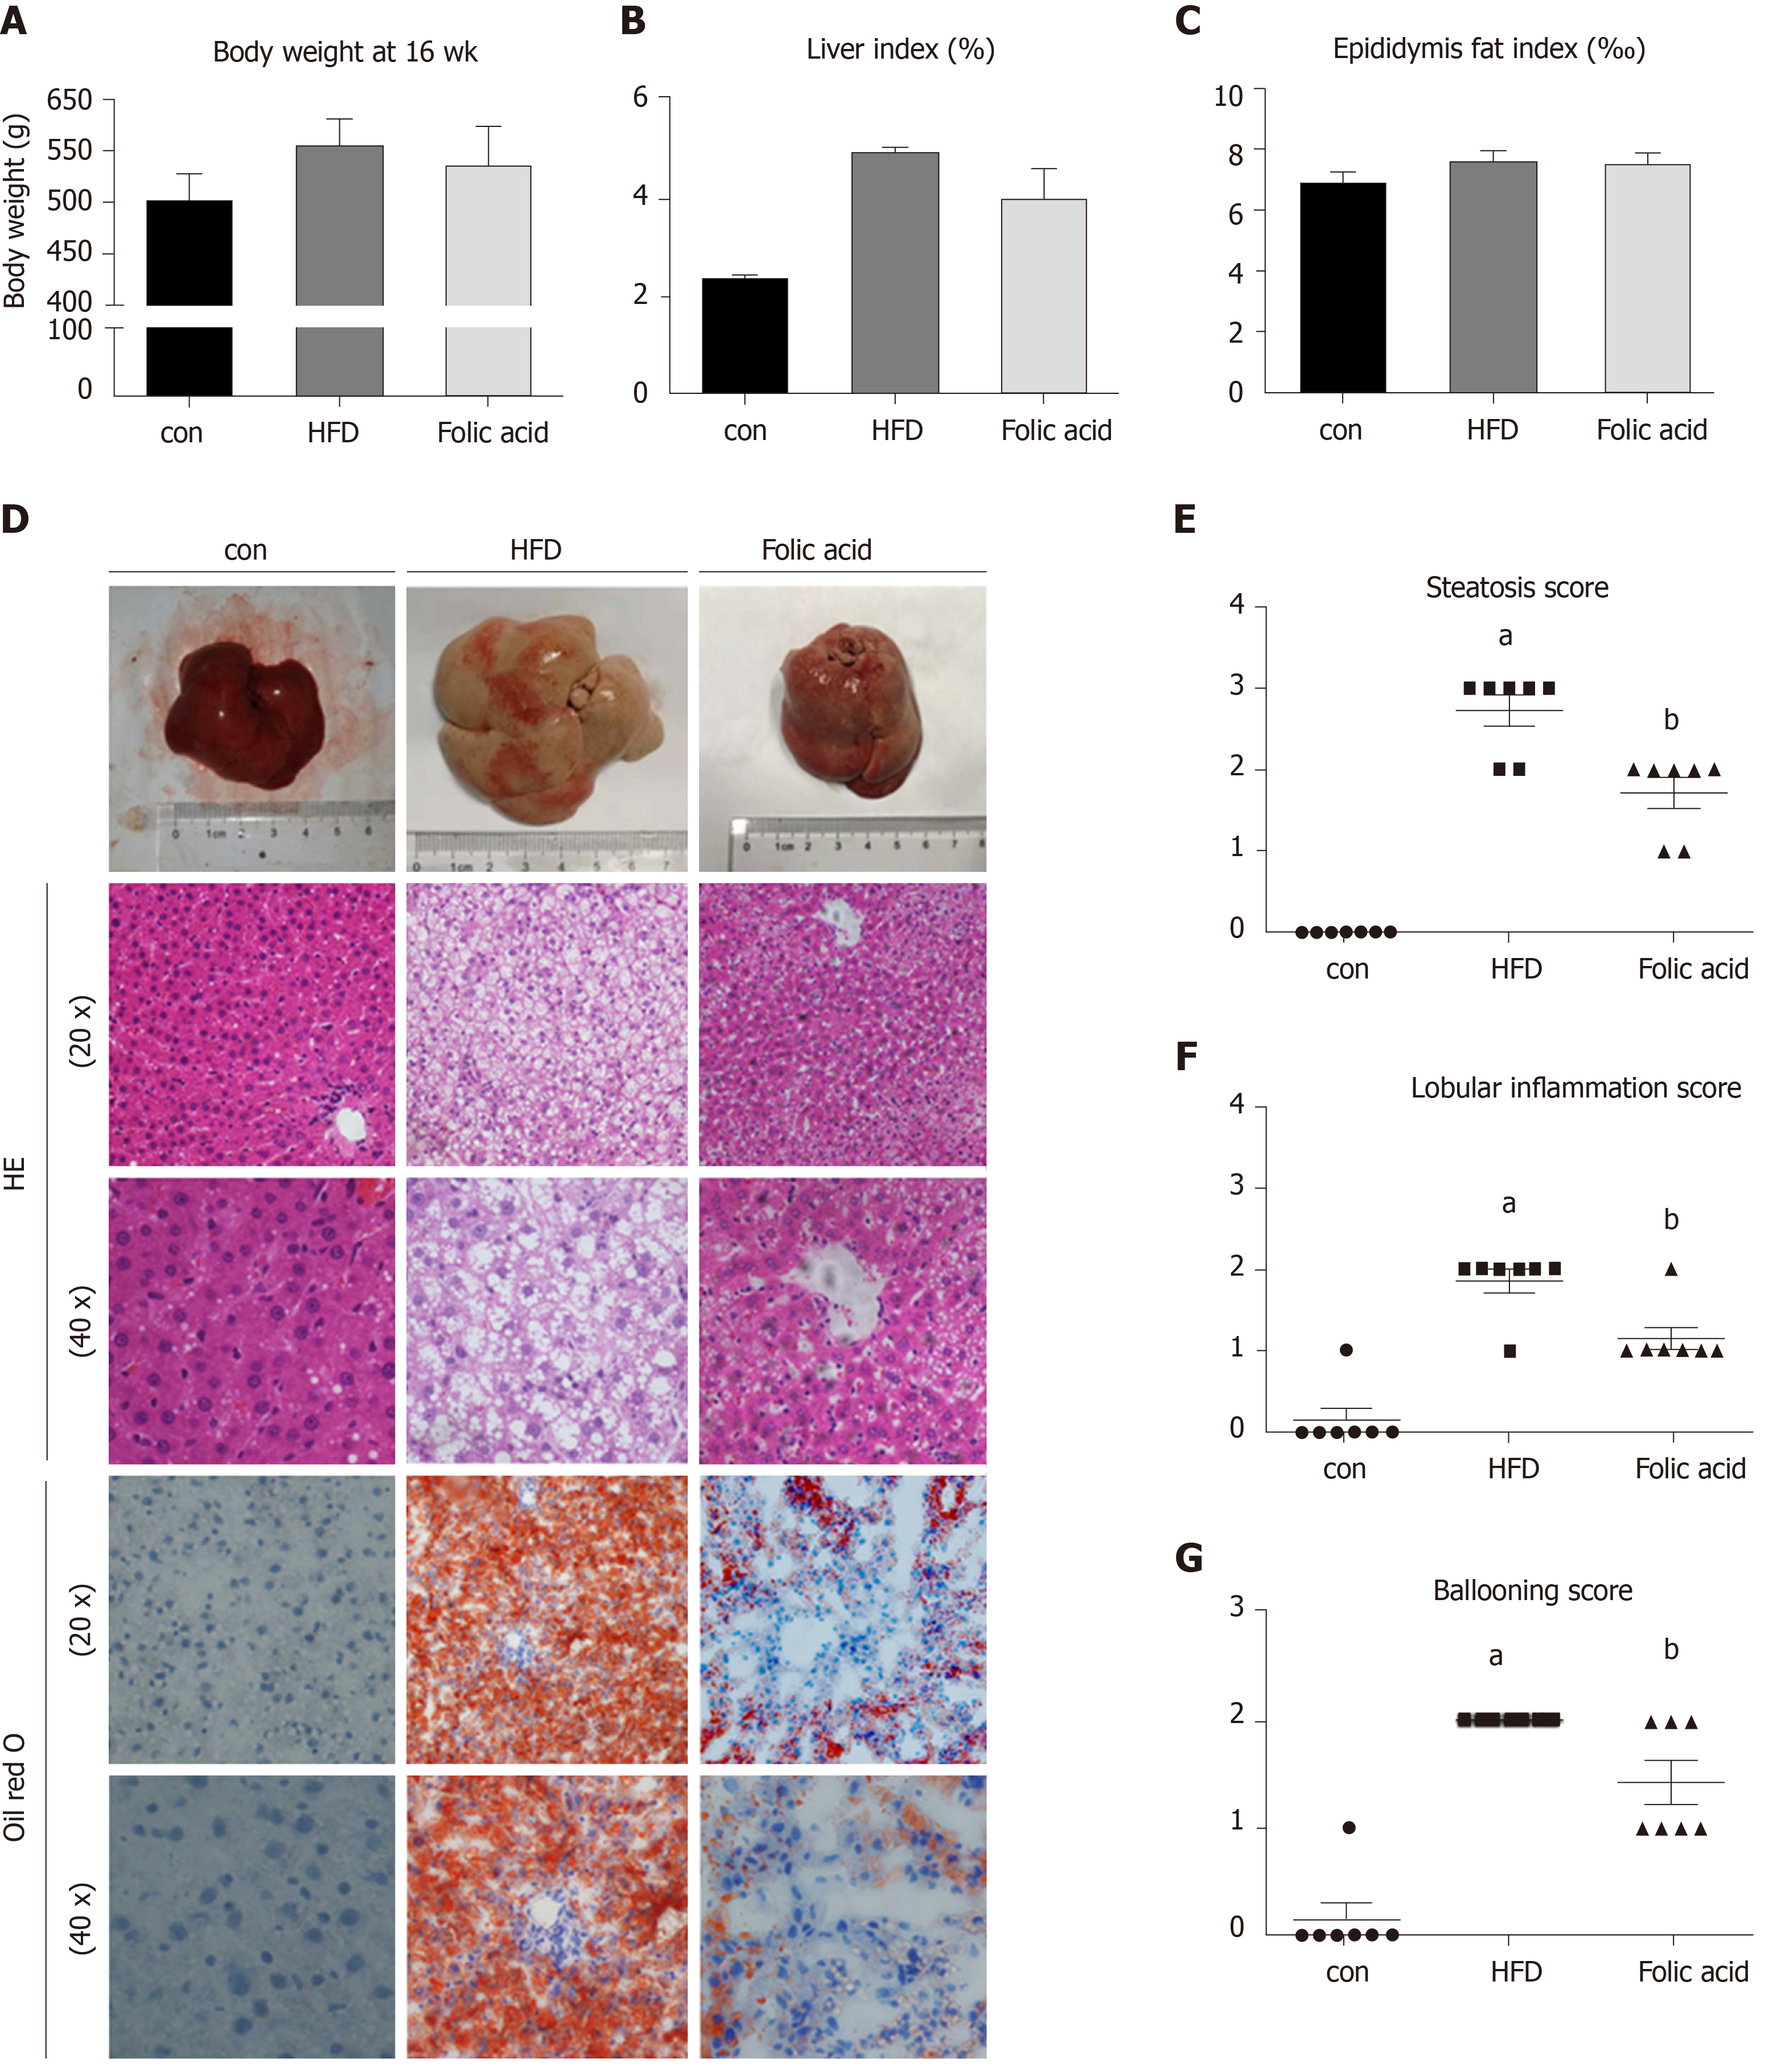
Figure 1 Folic acid ameliorates histological alterations in high-fat diet-induced steatohepatitis independent of affecting body weight.
A: Body weight at 16 wk in each group; B: Liver index in each group; C: Epididymis fat index in each group; D: Hematoxylin-eosin and Oil red staining in each group. Scale bars: 50 μm; E-G: Steatosis score, lobular inflammation score, and ballooning score in each group. All the data are expressed as the mean ± SE (n = 4-7). aP < 0.05 vs con group; bP < 0.05 vs HFD group. HFD: High-fat diet; HE: Hematoxylin-eosin.
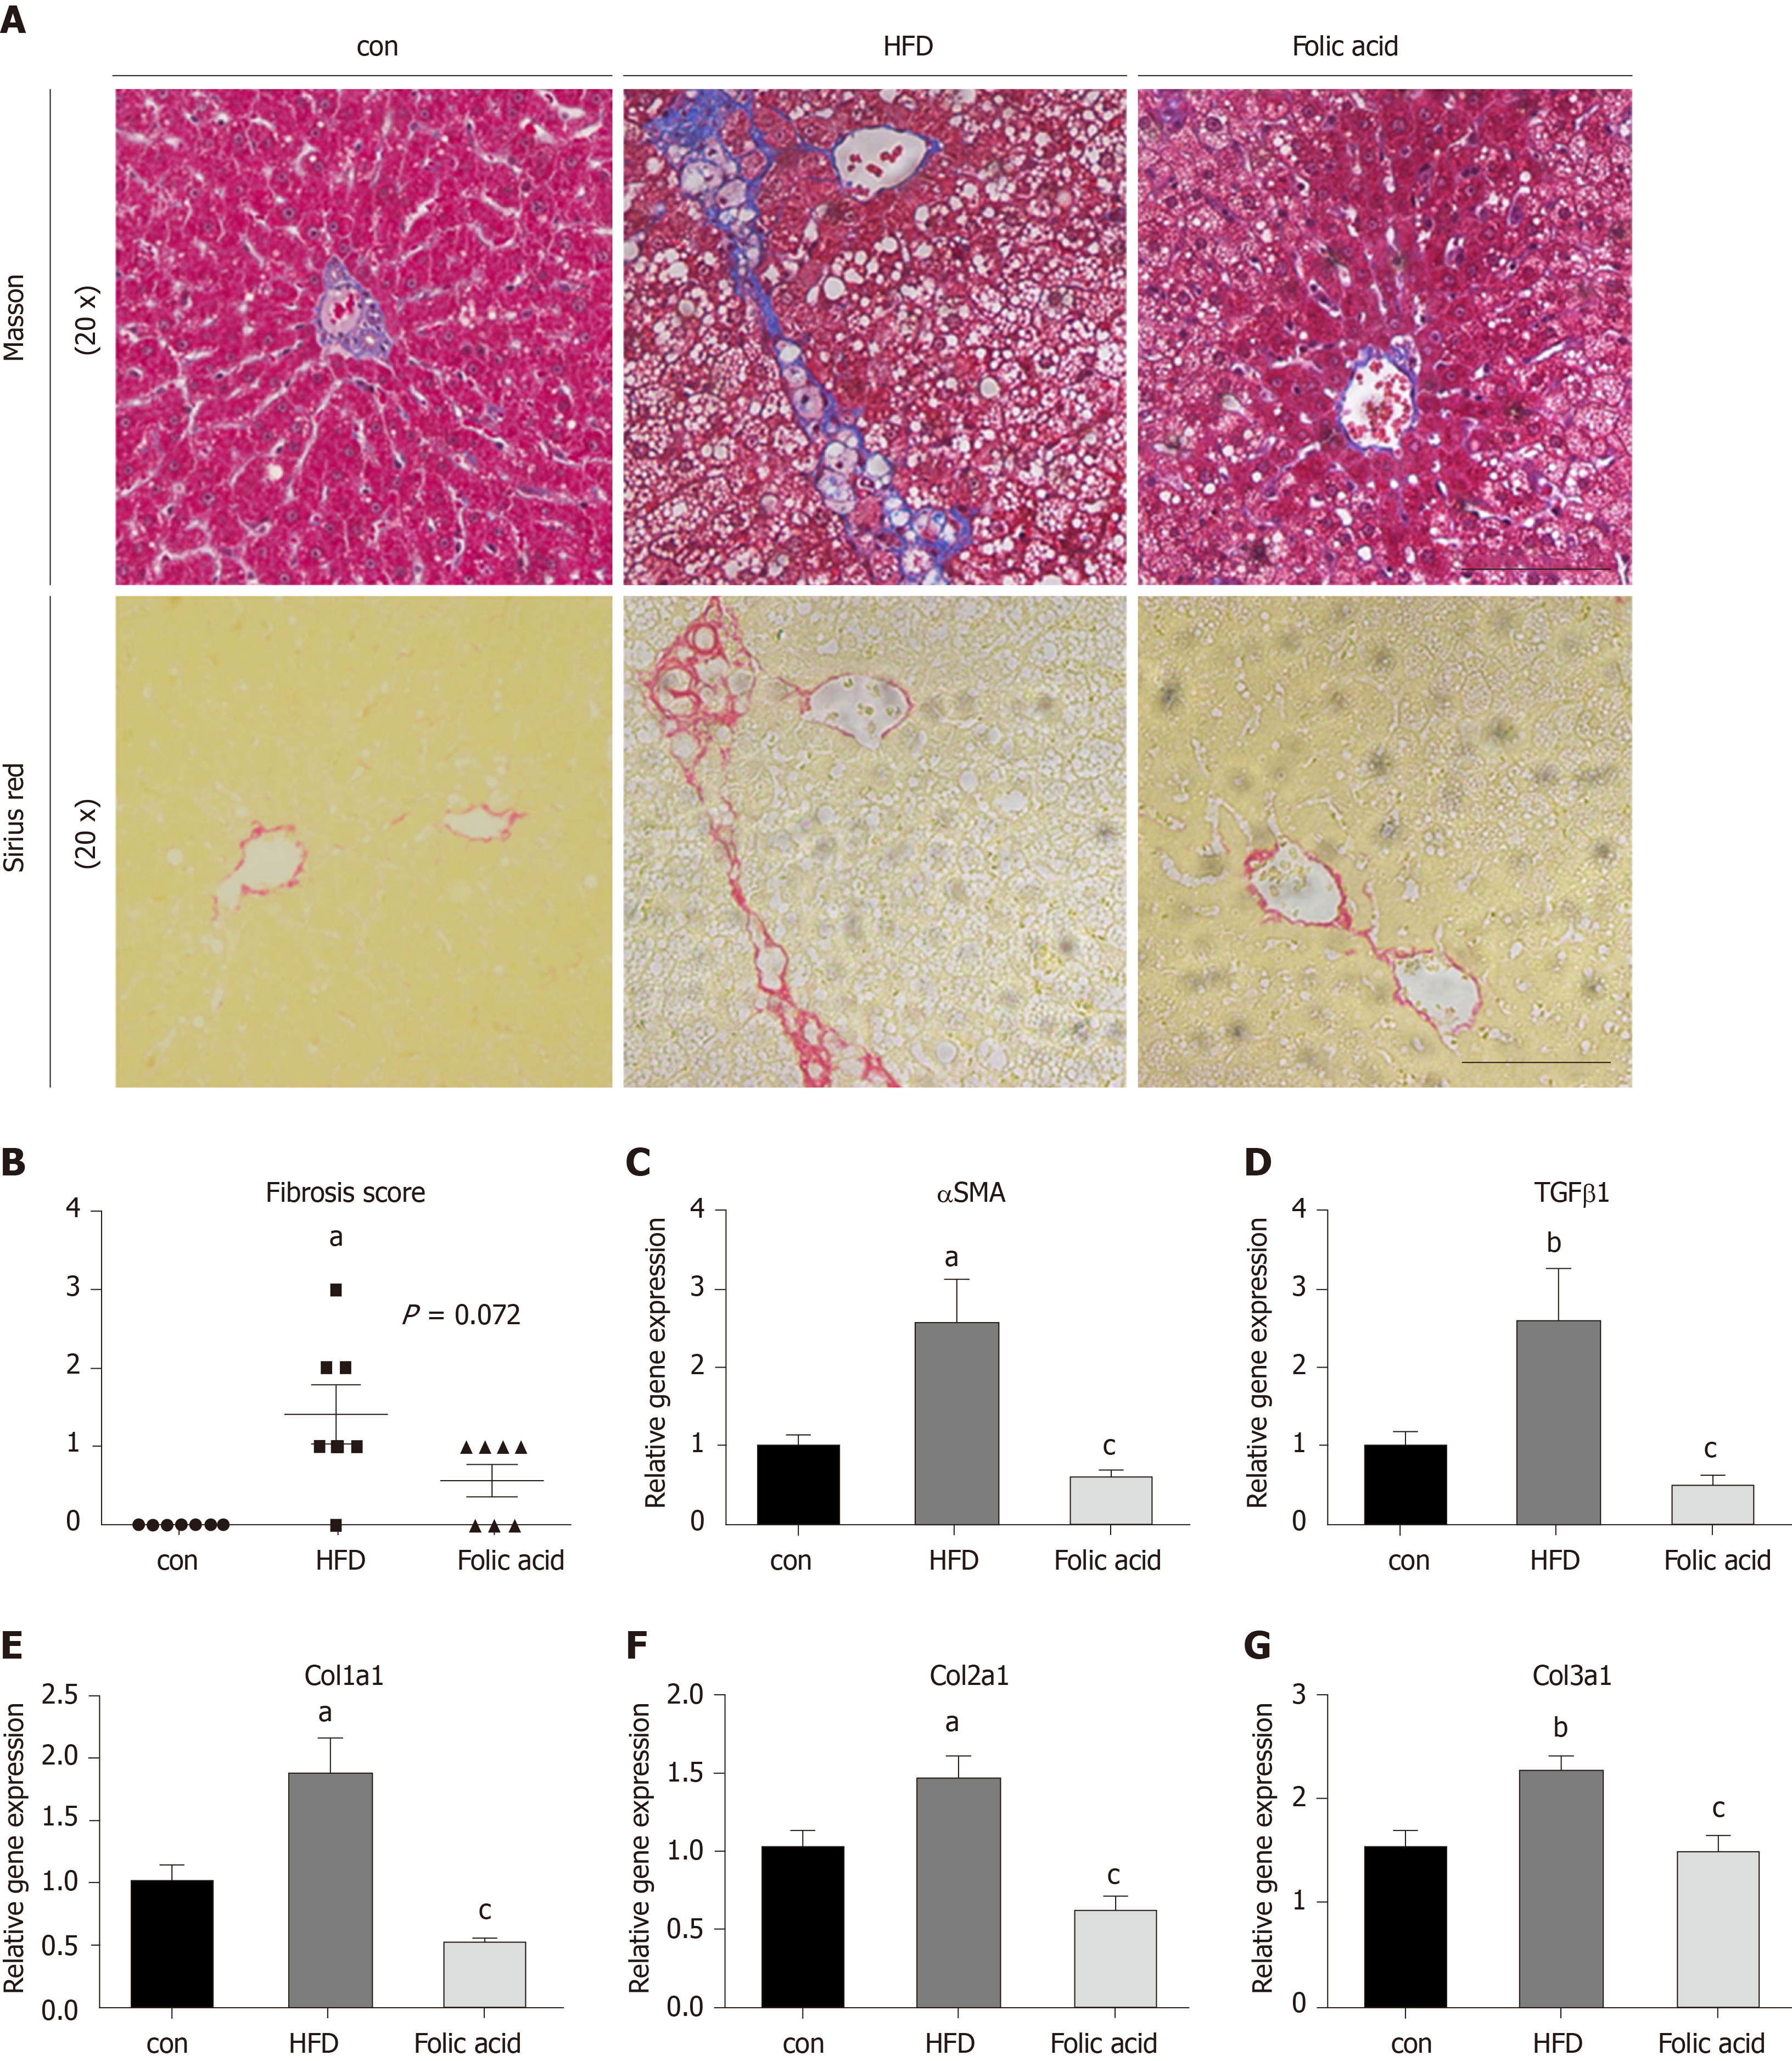
Figure 2 Folic acid ameliorates liver fibrosis in the rat model.
A: Masson and Sirius red staining in each group. Scale bars: 100 μm; B: Fibrosis score in each group; C-G: Hepatic αSMA, TGFβ1, Col1a1, Col2a1, and Col3a1 in each group. All the data are expressed as the mean ± SE (n = 4-7). aP < 0.05 vs con group; bP < 0.01 vs con group; cP < 0.01 vs HFD group. HFD: High-fat diet; αSMA: α-smooth muscle actin; TGFβ1: Transforming growth factor beta 1; Col1a1: Collagen type I alpha 1; Col2a1: Collagen type II alpha 1; Col3a1: Collagen type III alpha 1.
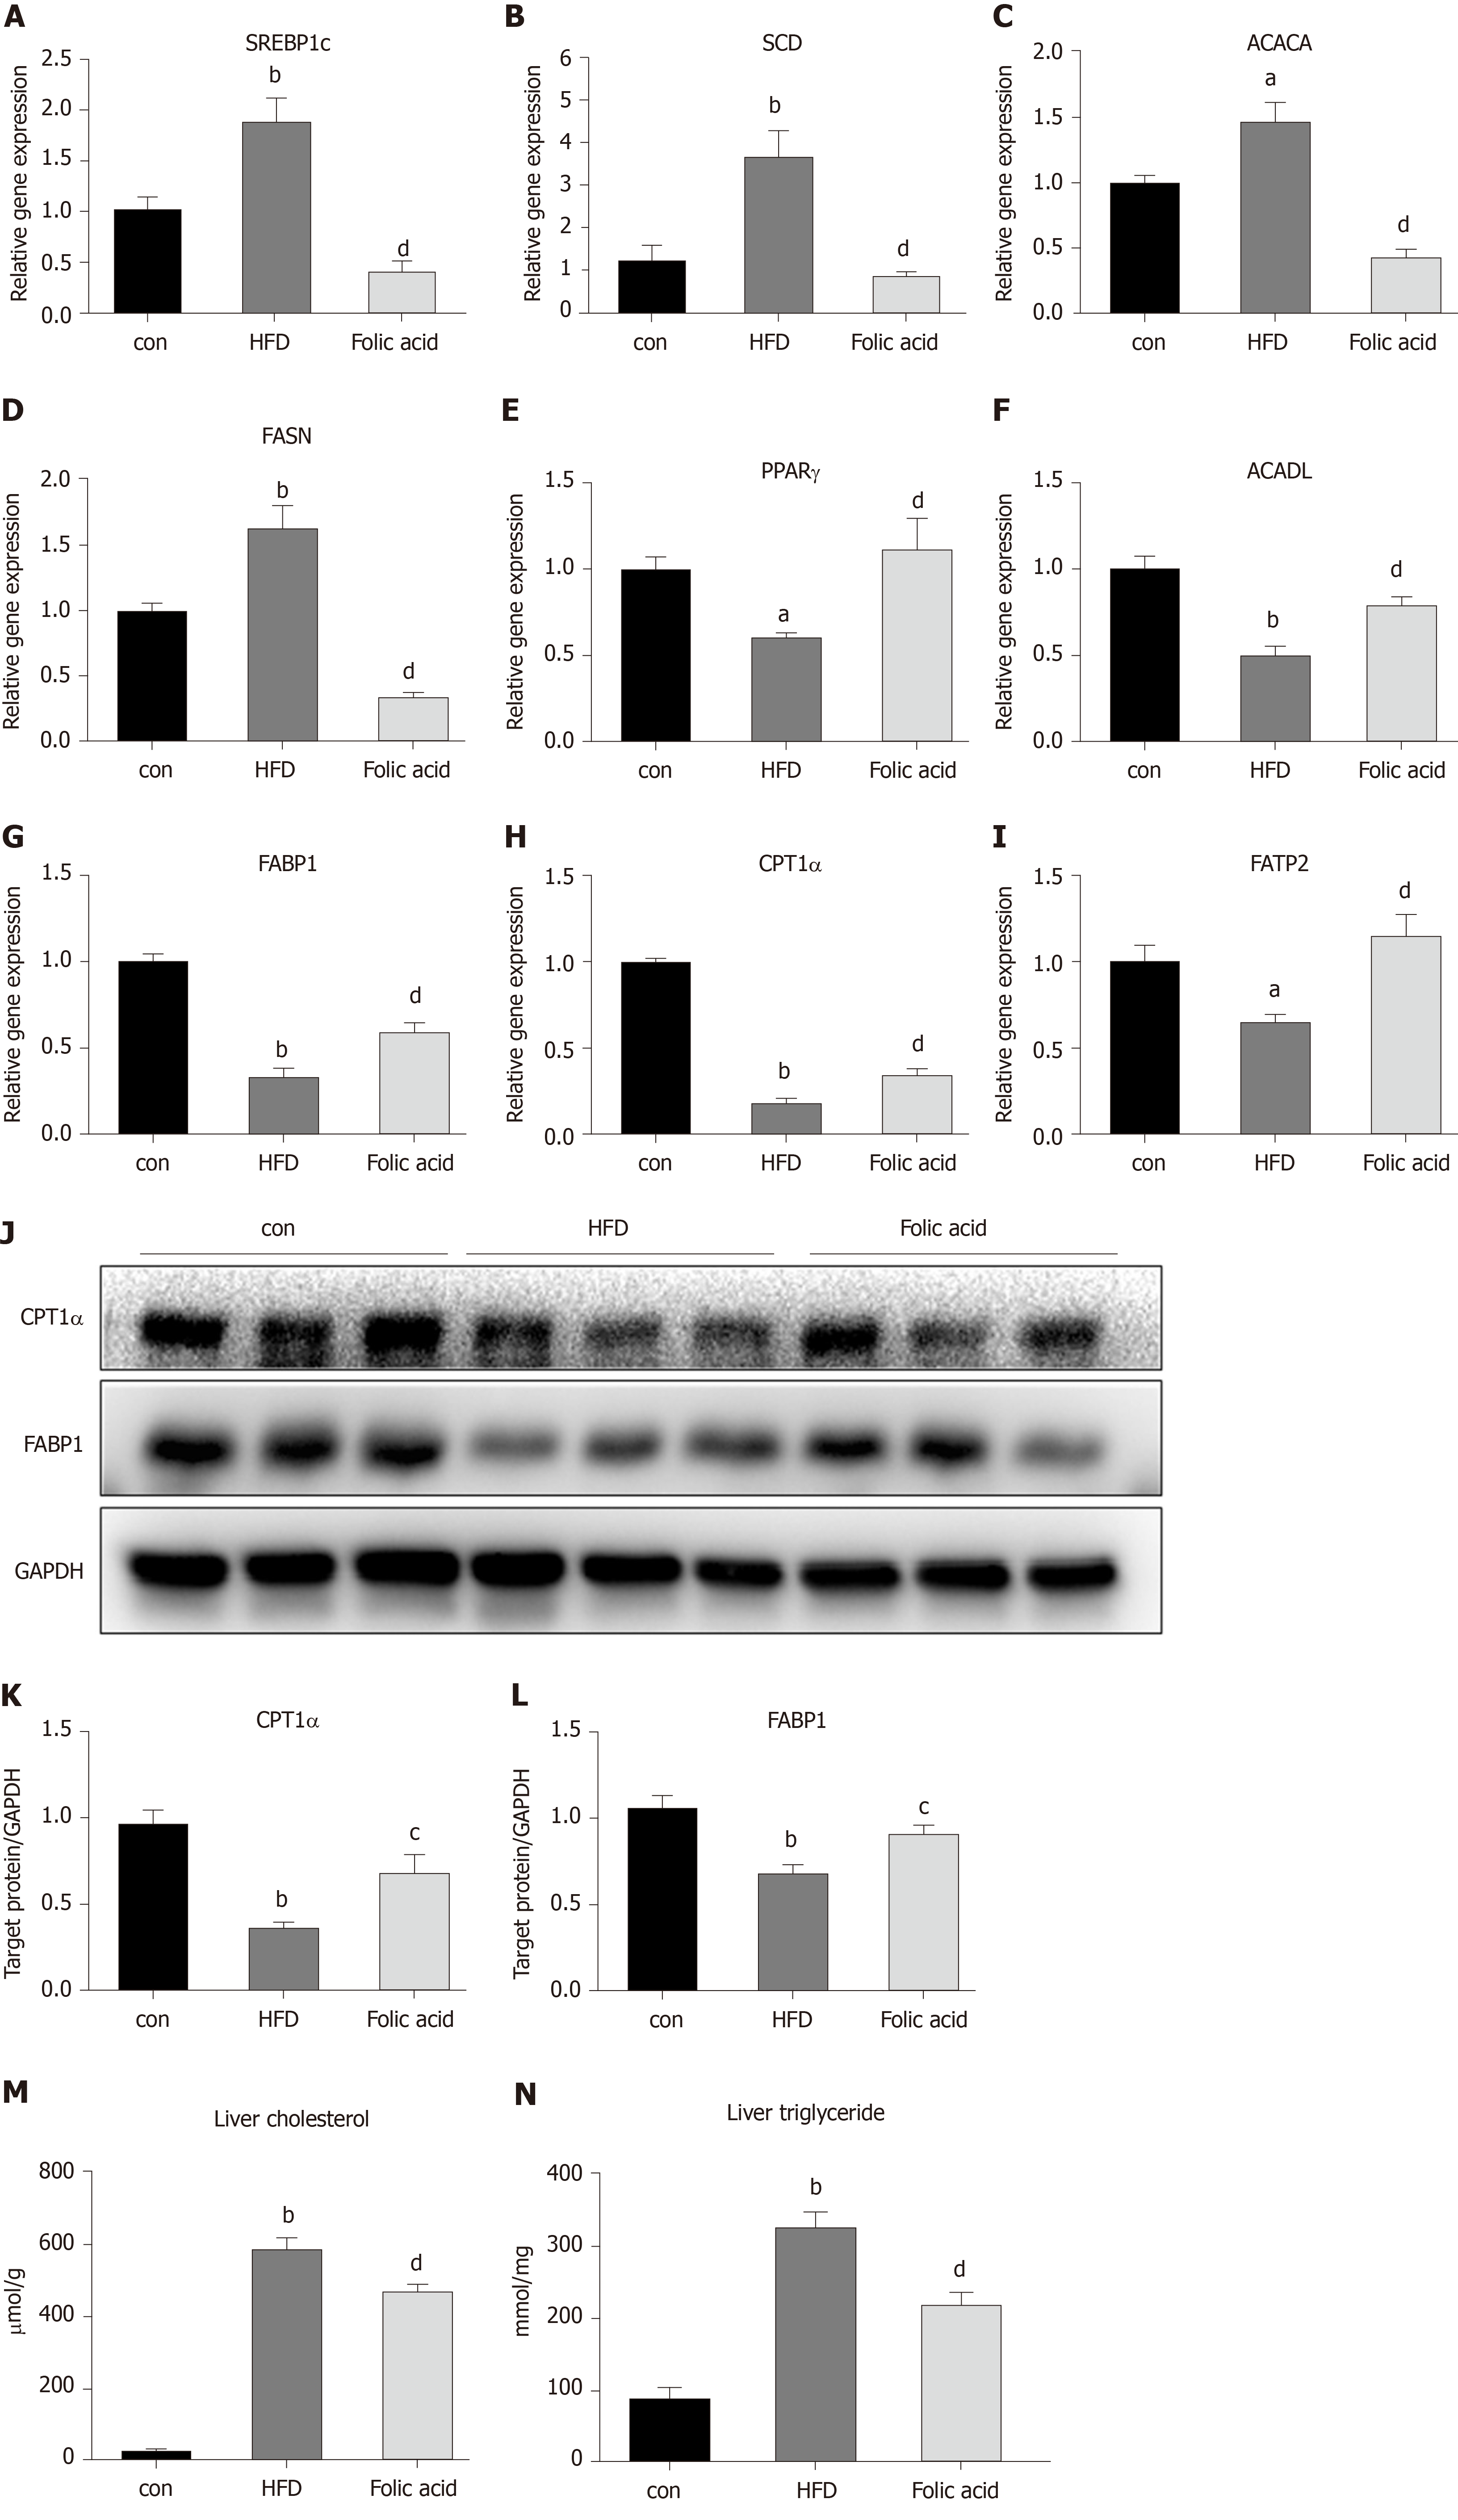
Figure 3 Folic acid inhibits hepatic lipogenesis and promotes hepatic fatty acid oxidation in high-fat diet-induced steatohepatitis rats.
A-I: mRNA expression levels of SREBP1c, SCD, ACACA, FASN, PPARγ, ACADL, FABP1, CPT1α, and FATP2 in each group; J-L: Protein expression levels of CPT1α and FABP1 in each group; M and N: Liver cholesterol and triglyceride levels. All the data are expressed as the mean ± SE (n = 3-6). aP < 0.05 vs con group; bP < 0.01 vs con group; cP < 0.05 vs HFD group; dP < 0.01 vs HFD group. HFD: High-fat diet; SREBP1c: Sterol regulatory element binding transcription protein 1c; SCD: Stearoyl-CoA desaturase; ACACA: Acetyl-CoA carboxylase; FASN: Fatty acid synthase; PPARγ: Peroxisome proliferator-activated receptor gamma; ACADL: Long-chain specific acyl-CoA dehydrogenase; FABP1: Fatty acid binding protein 1; CPT1α: Carnitine palmitoyltransferase 1A; FATP2: Fatty acid transport protein 2.
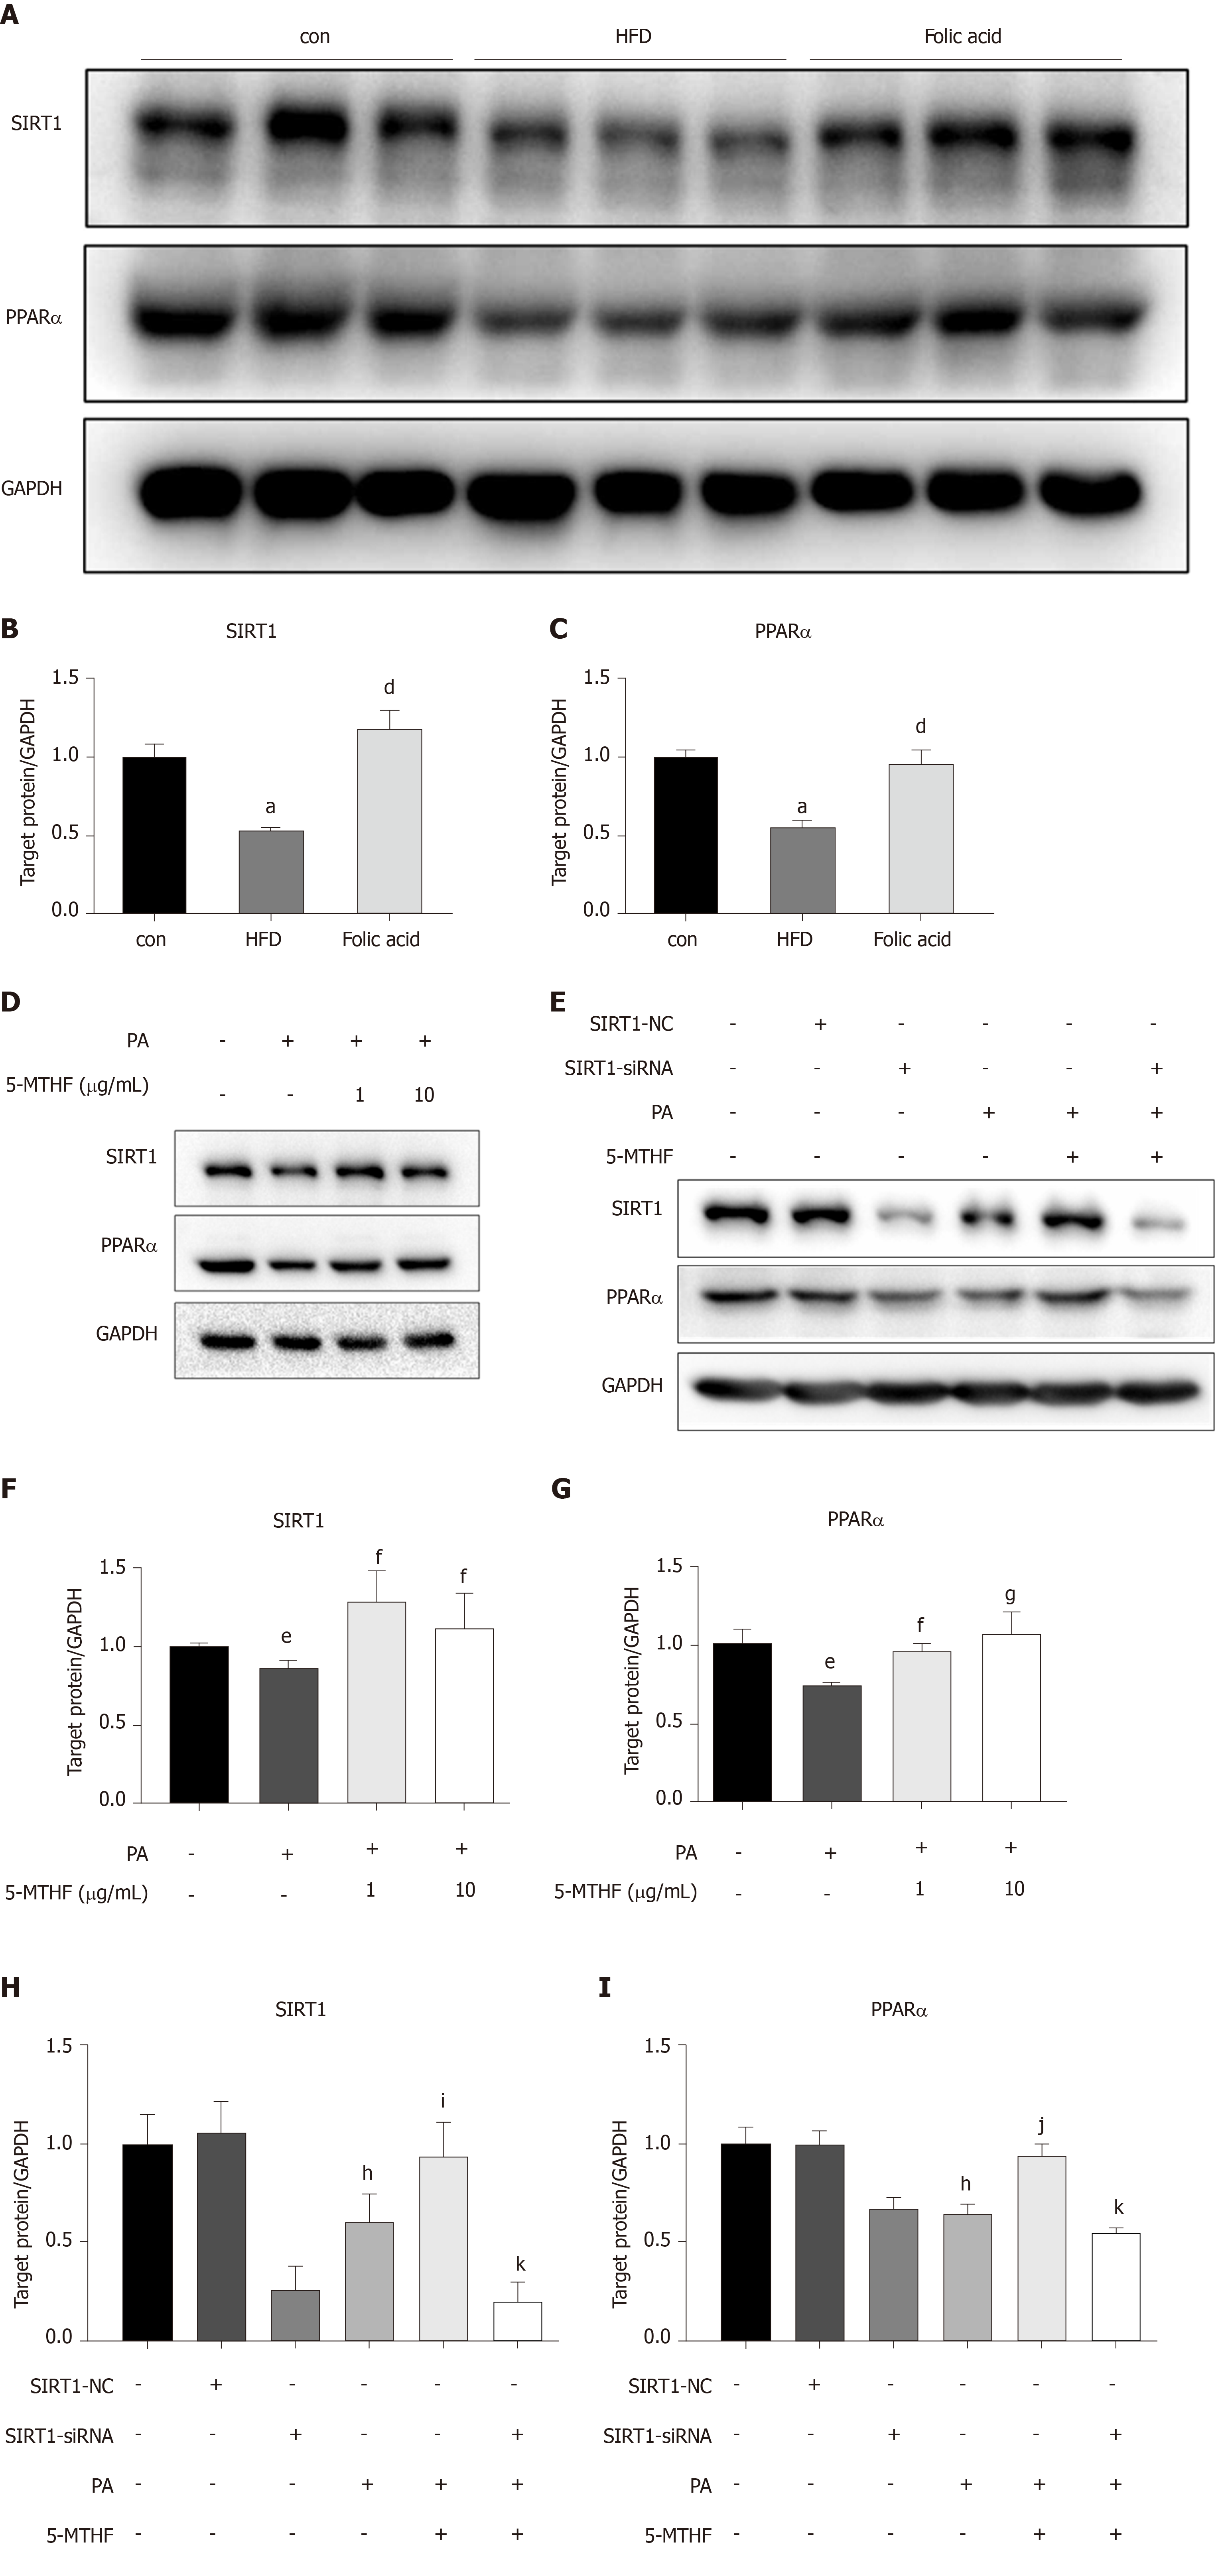
Figure 4 Folic acid restores the expression levels of PPARα via SIRT1 in rats with high-fat diet-induced steatohepatitis and Huh7 cell line.
A-C: The expression levels of SIRT1 and PPARα in each group of rats; D, F, and G: The expression levels of SIRT1 and PPARα in Huh7 cell line exposed to 0.3 mmol/L PA; E, H, and I: The expression levels of SIRT1 and PPARα in Huh7 cell line transfected with SIRT1 siRNA and then exposed to 0.3 mmol/L PA. All the data are expressed as the mean ± SE (n = 3). aP < 0.05 vs con group; bP< 0.01 vs con group; dP < 0.01 vs HFD group; eP < 0.05 vs control; fP < 0.05 vs 0.3 PA group; gP < 0.01 vs 0.3 PA group; hP < 0.01 vs SIRT1-NC group; iP < 0.05 vs 0.3 PA group; jP < 0.01 vs 0.3PA group; kP <0.01 vs 5-MTHF and 0.3 PA group. HFD: High-fat diet; PPARα: Peroxisome proliferator-activated receptor alpha; SIRT1: Silence information regulation factor 1; PA: Palmitic acid; 5-MTHF: 5-methyltetrahydrofolic acid.
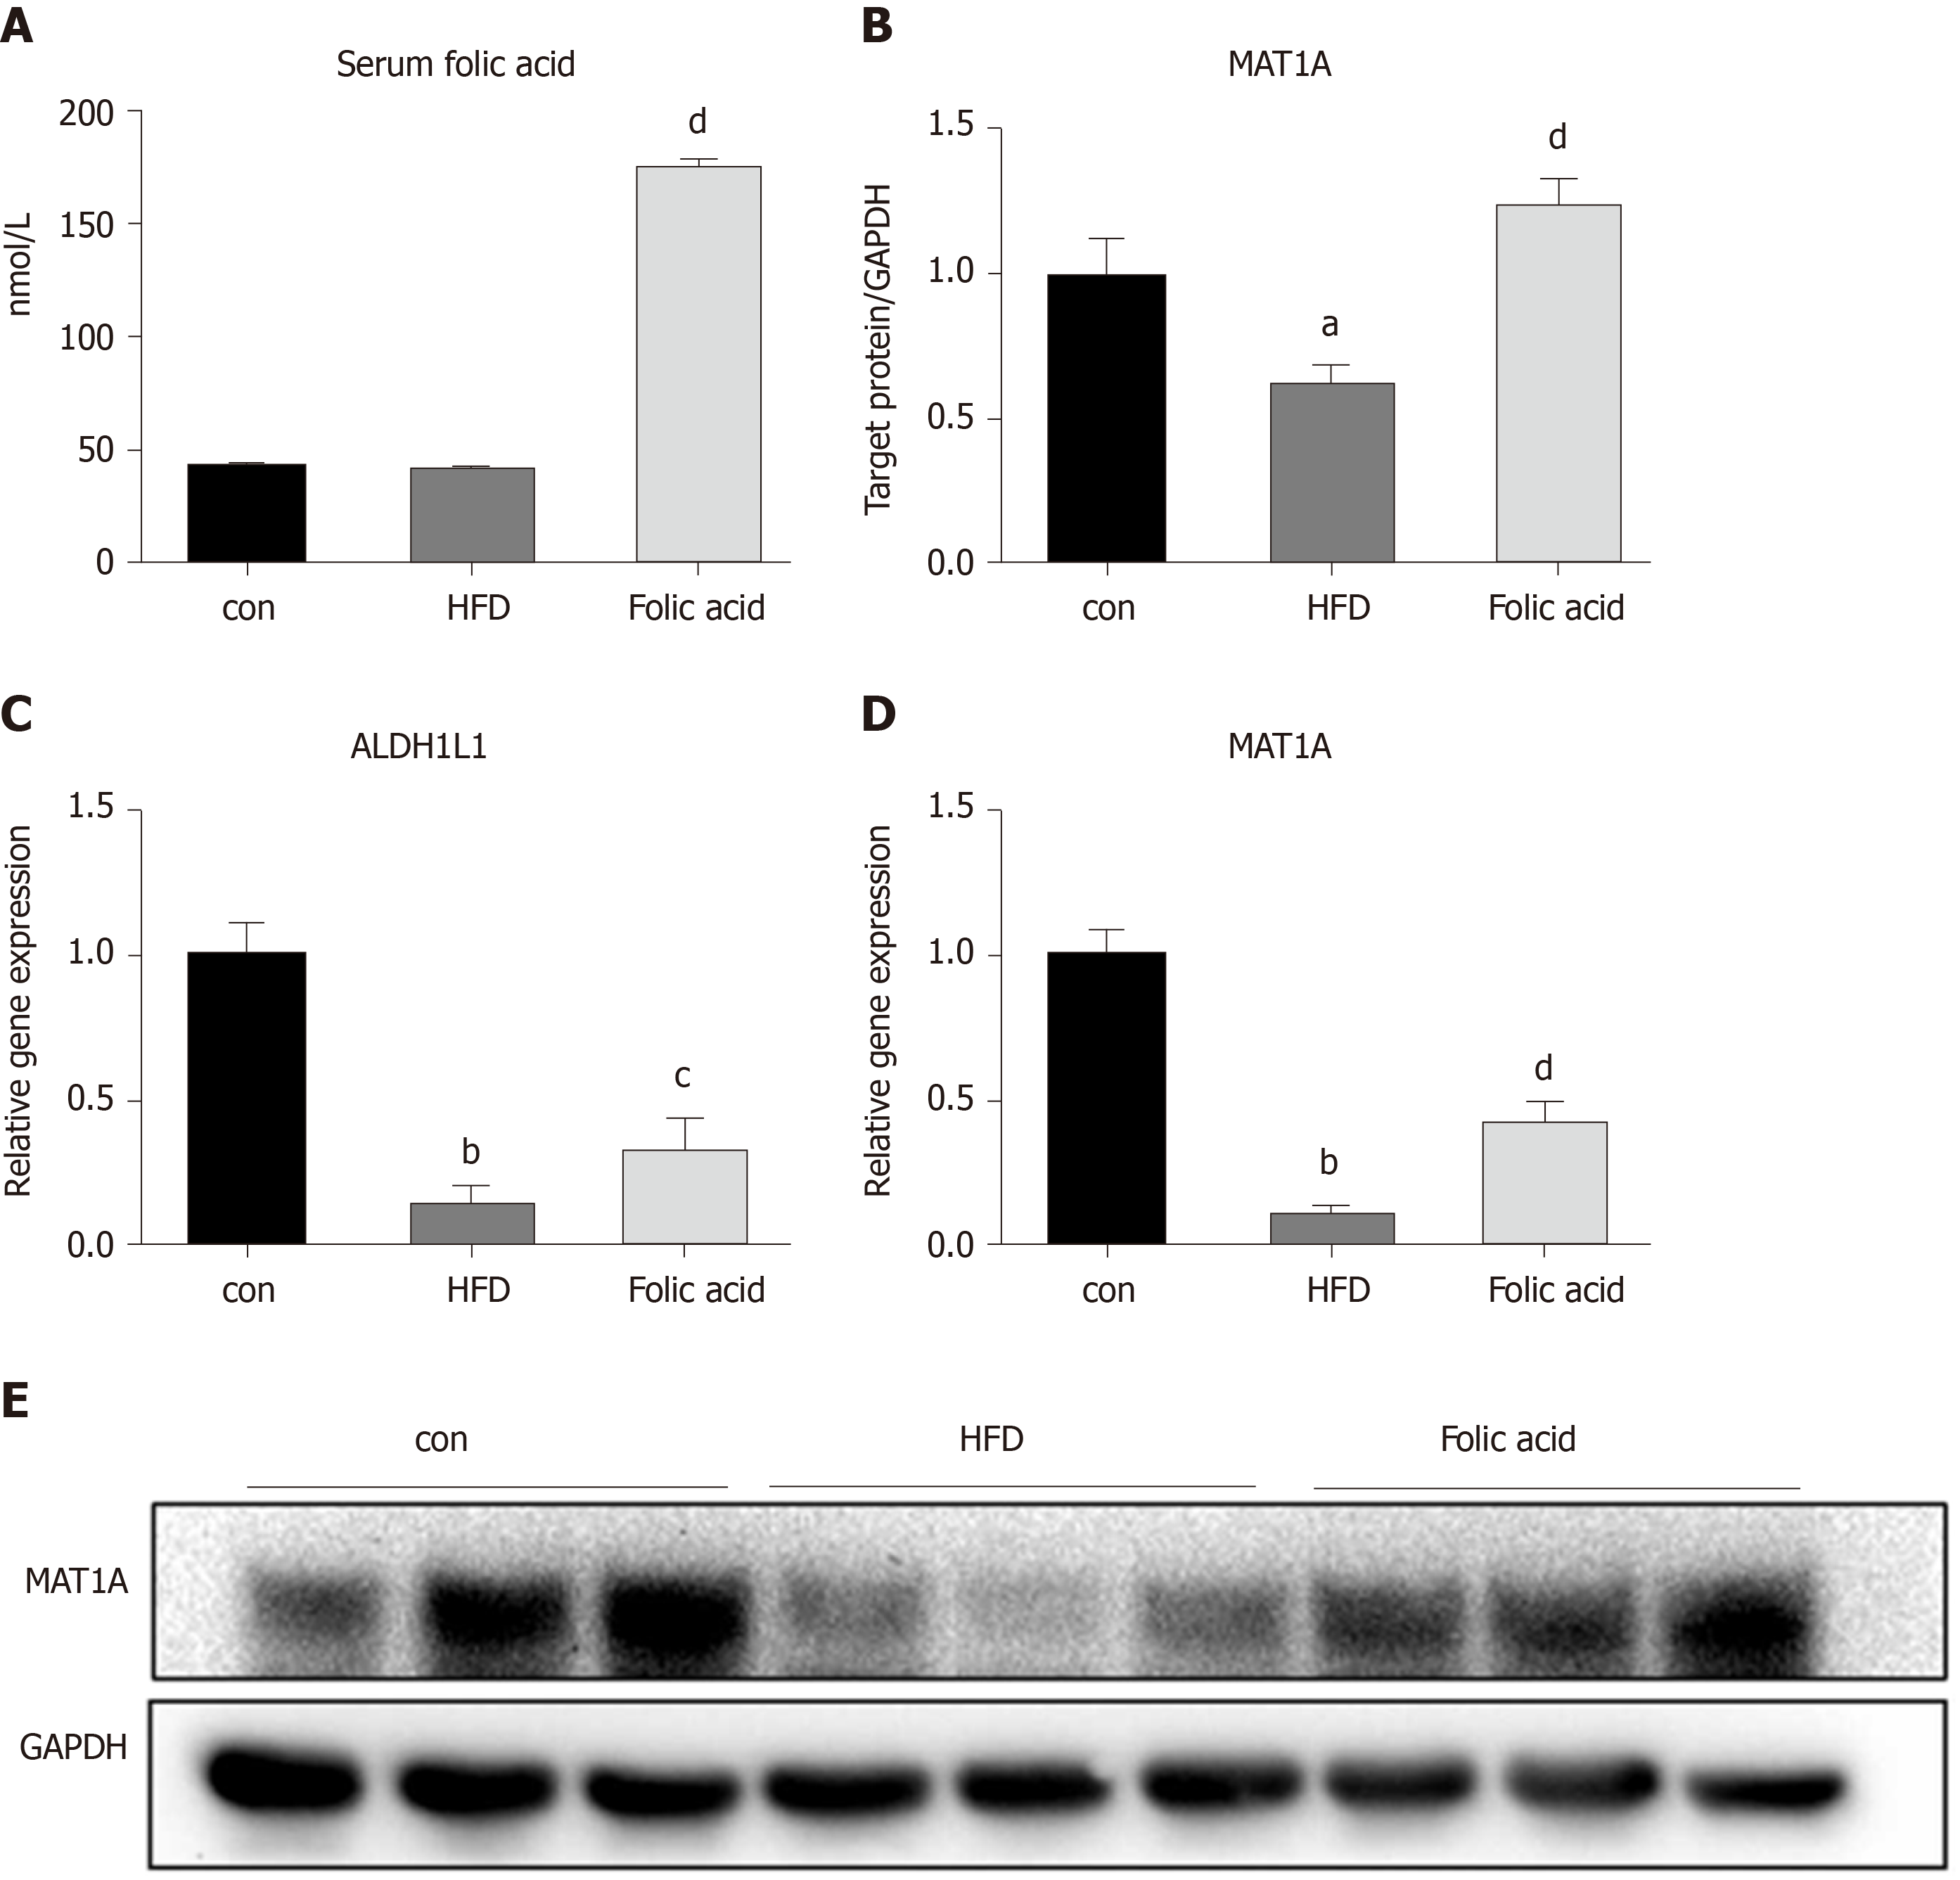
Figure 5 Folic acid improves hepatic one-carbon metabolism in rats with high-fat diet-induced steatohepatitis.
A: Serum folic acid levels in each group; C and D: mRNA levels of MAT1A and ALDH1L1 in each group; B and E: Protein levels of MAT1A in each group. All the data are expressed as the mean ± SE (n = 3-8). aP < 0.05 vs con group bP < 0.01 vs con group; cP < 0.05 vs HFD group; dP < 0.01 vs HFD group. HFD: High-fat diet; MAT1A: Methionine adenosyltransferase 1A.
Figure 6 Folic acid restores the diversity of the gut microbiota and the gut barrier and improves endotoxemia and liver inflammation in a non-alcoholic steatohepatitis rat model.
A: Alpha diversity of the gut microbiota; B: Principal coordinates analysis; C and D: Unweighted pair-group method with arithmetic mean analysis; E: Hematoxylin-eosin and Occludin immunochemical staining of the ileum. Scale bars: 100 μm; F: Serum endotoxin levels in each group; G-N: Hepatic TNF-α, Il-6, IL-2β, CCR2, p47phox, p67phox, p22phox, and gp91phox levels in each group. All the data are expressed as the mean ± SE (n = 4-6). aP < 0.05 vs con group bP < 0.01 vs con group; cP < 0.05 vs HFD group; dP < 0.01 vs HFD group. HFD: High-fat diet; HE: Hematoxylin-eosin; TNF-α: Tumor necrosis factor alpha; IL: Interleukin; CCR2: Chemokine receptor C-C chemokine receptor type 2.
- Citation: Xin FZ, Zhao ZH, Zhang RN, Pan Q, Gong ZZ, Sun C, Fan JG. Folic acid attenuates high-fat diet-induced steatohepatitis via deacetylase SIRT1-dependent restoration of PPARα. World J Gastroenterol 2020; 26(18): 2203-2220
- URL: https://www.wjgnet.com/1007-9327/full/v26/i18/2203.htm
- DOI: https://dx.doi.org/10.3748/wjg.v26.i18.2203


