Copyright
©The Author(s) 2020.
World J Gastroenterol. Mar 28, 2020; 26(12): 1352-1364
Published online Mar 28, 2020. doi: 10.3748/wjg.v26.i12.1352
Published online Mar 28, 2020. doi: 10.3748/wjg.v26.i12.1352
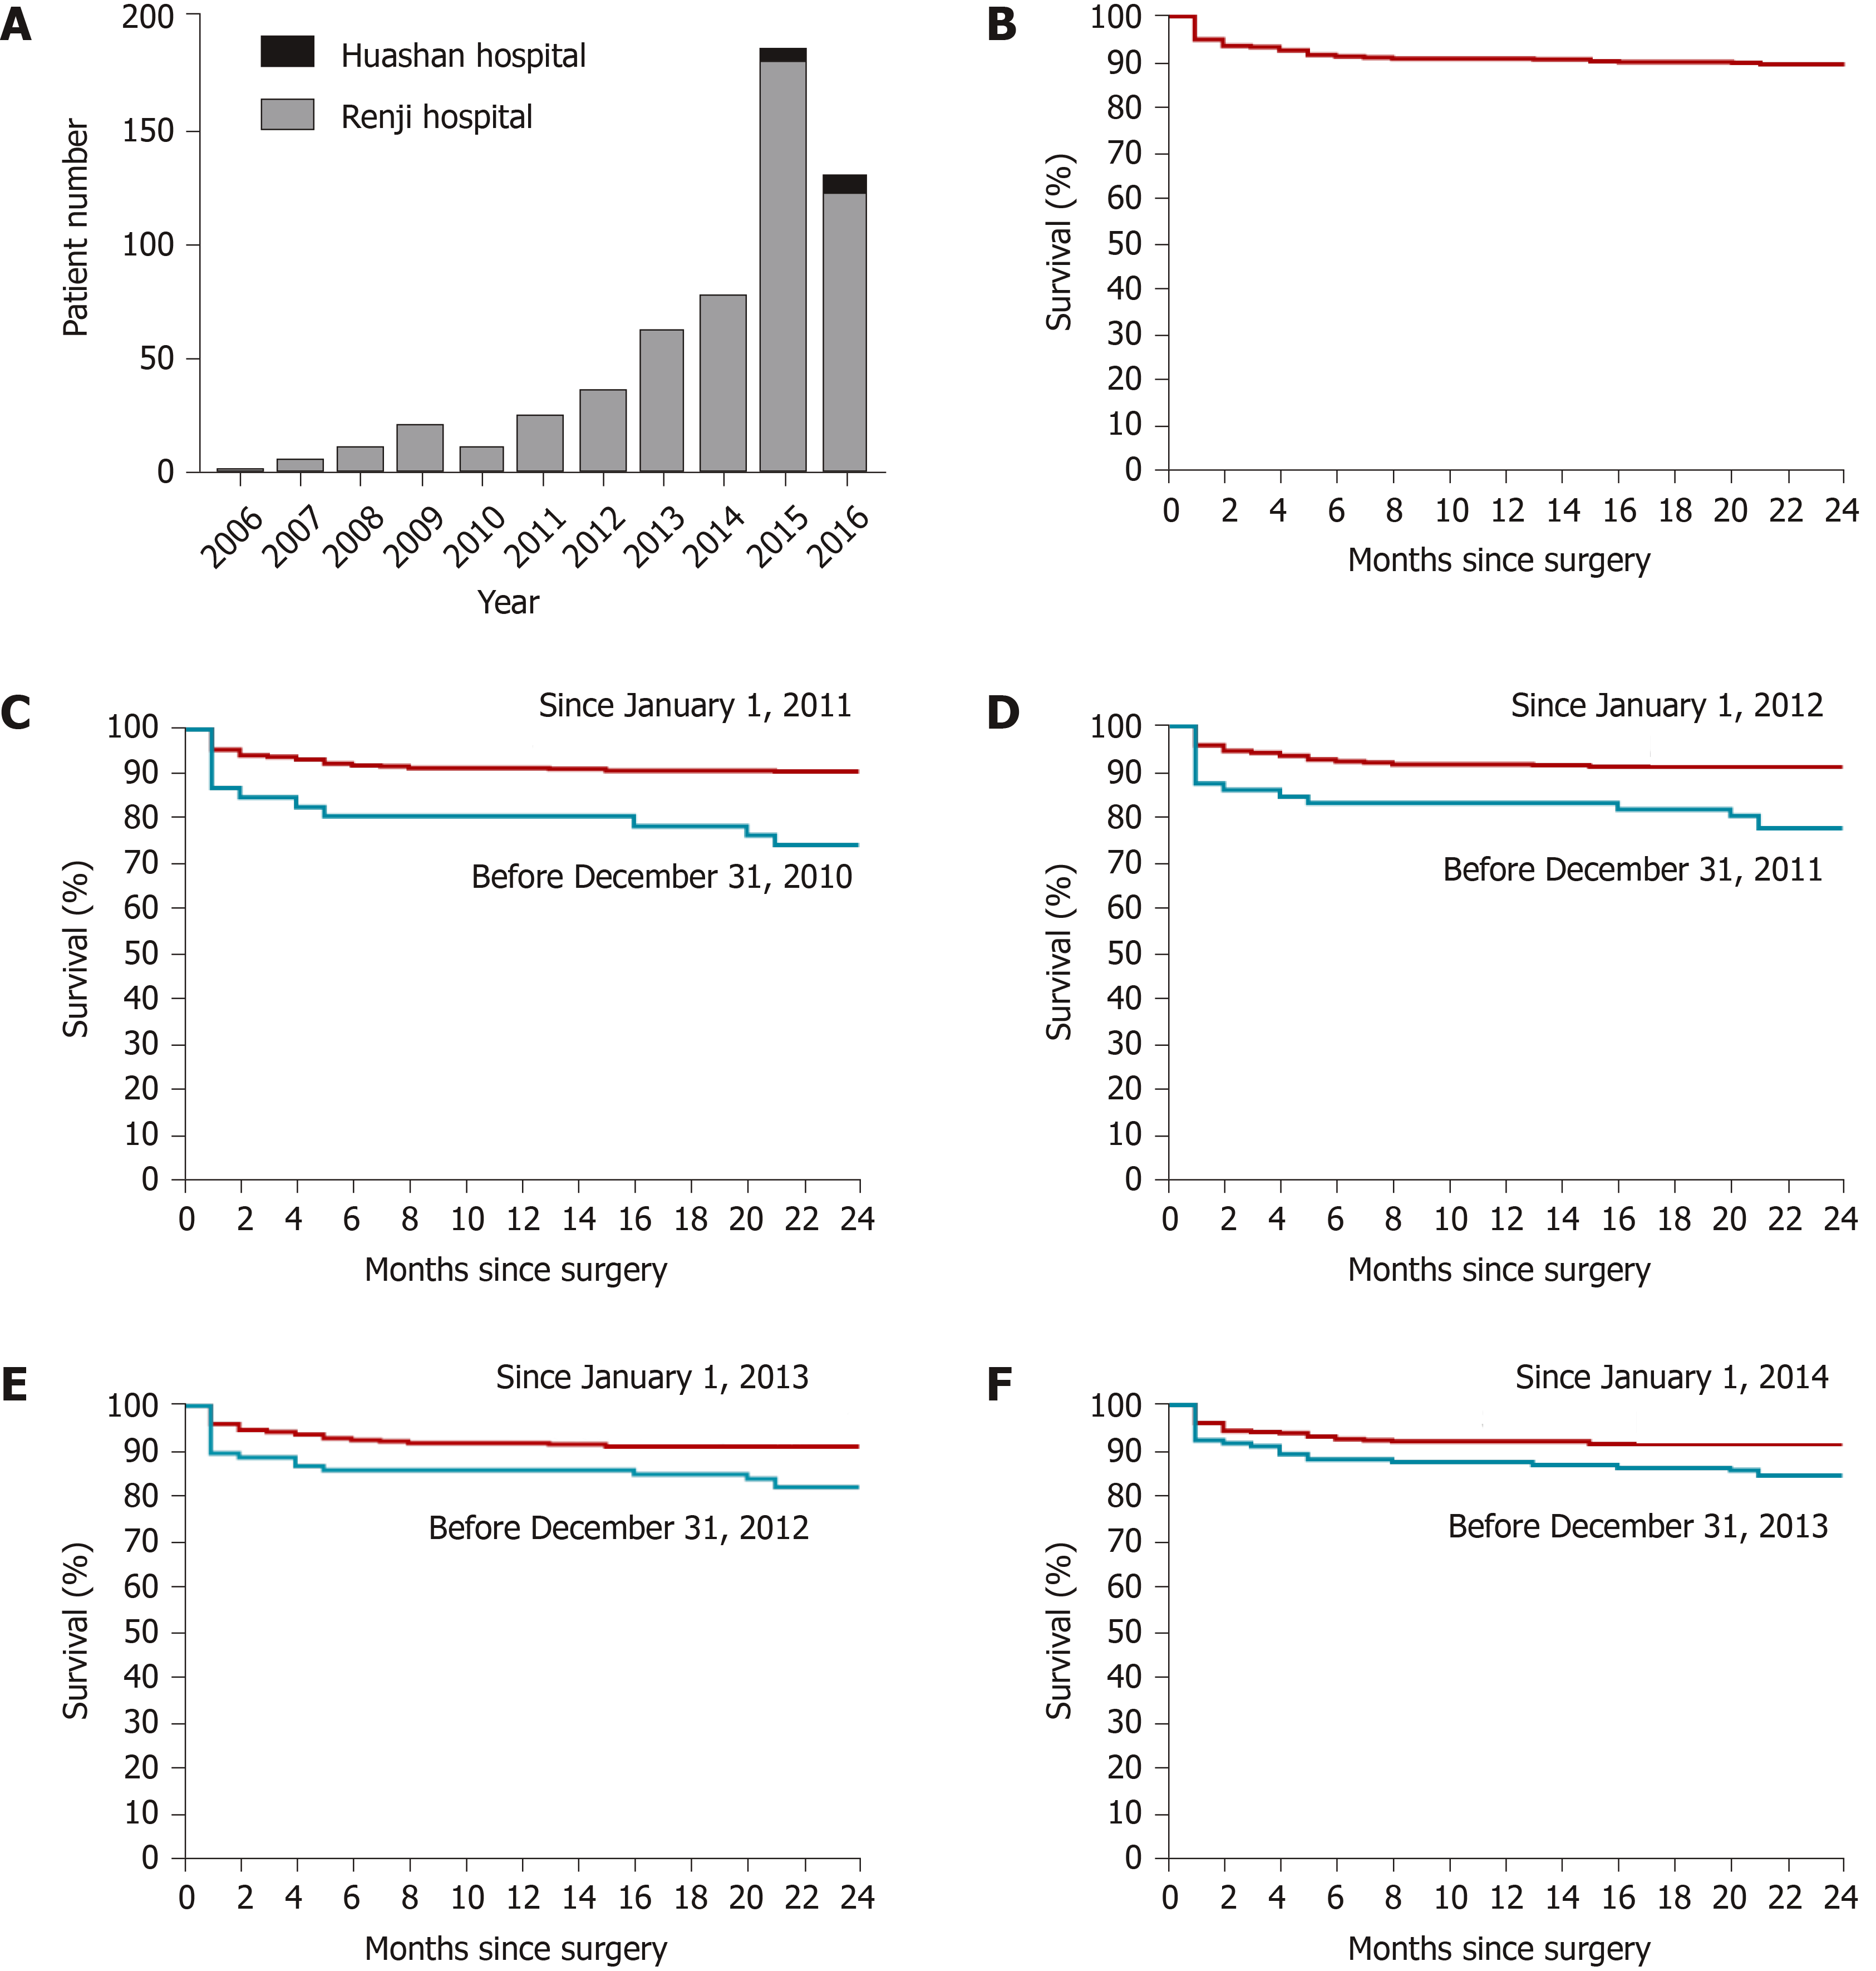
Figure 1 Patient number and the survival rates from 2006 to 2016 (n = 544).
A: Annual caseload of pediatric living donor liver transplantation from 2006 to 2016; B: Overall survival rates; C: Patient survival rates before and after January 1, 2011 (2-year: 74.47% vs 90.74%, P = 0.0004); D: Patient survival rates before and after January 1, 2012 (77.78% vs 91.10%, P = 0.0005); E: Patient survival rates before and after January 1, 2013 (2-year: 82.24% vs 91.08%, P = 0.007); F: Patient survival rates before and after January 1, 2014 (2-year: 84.52% vs 91.48%, P = 0.016).
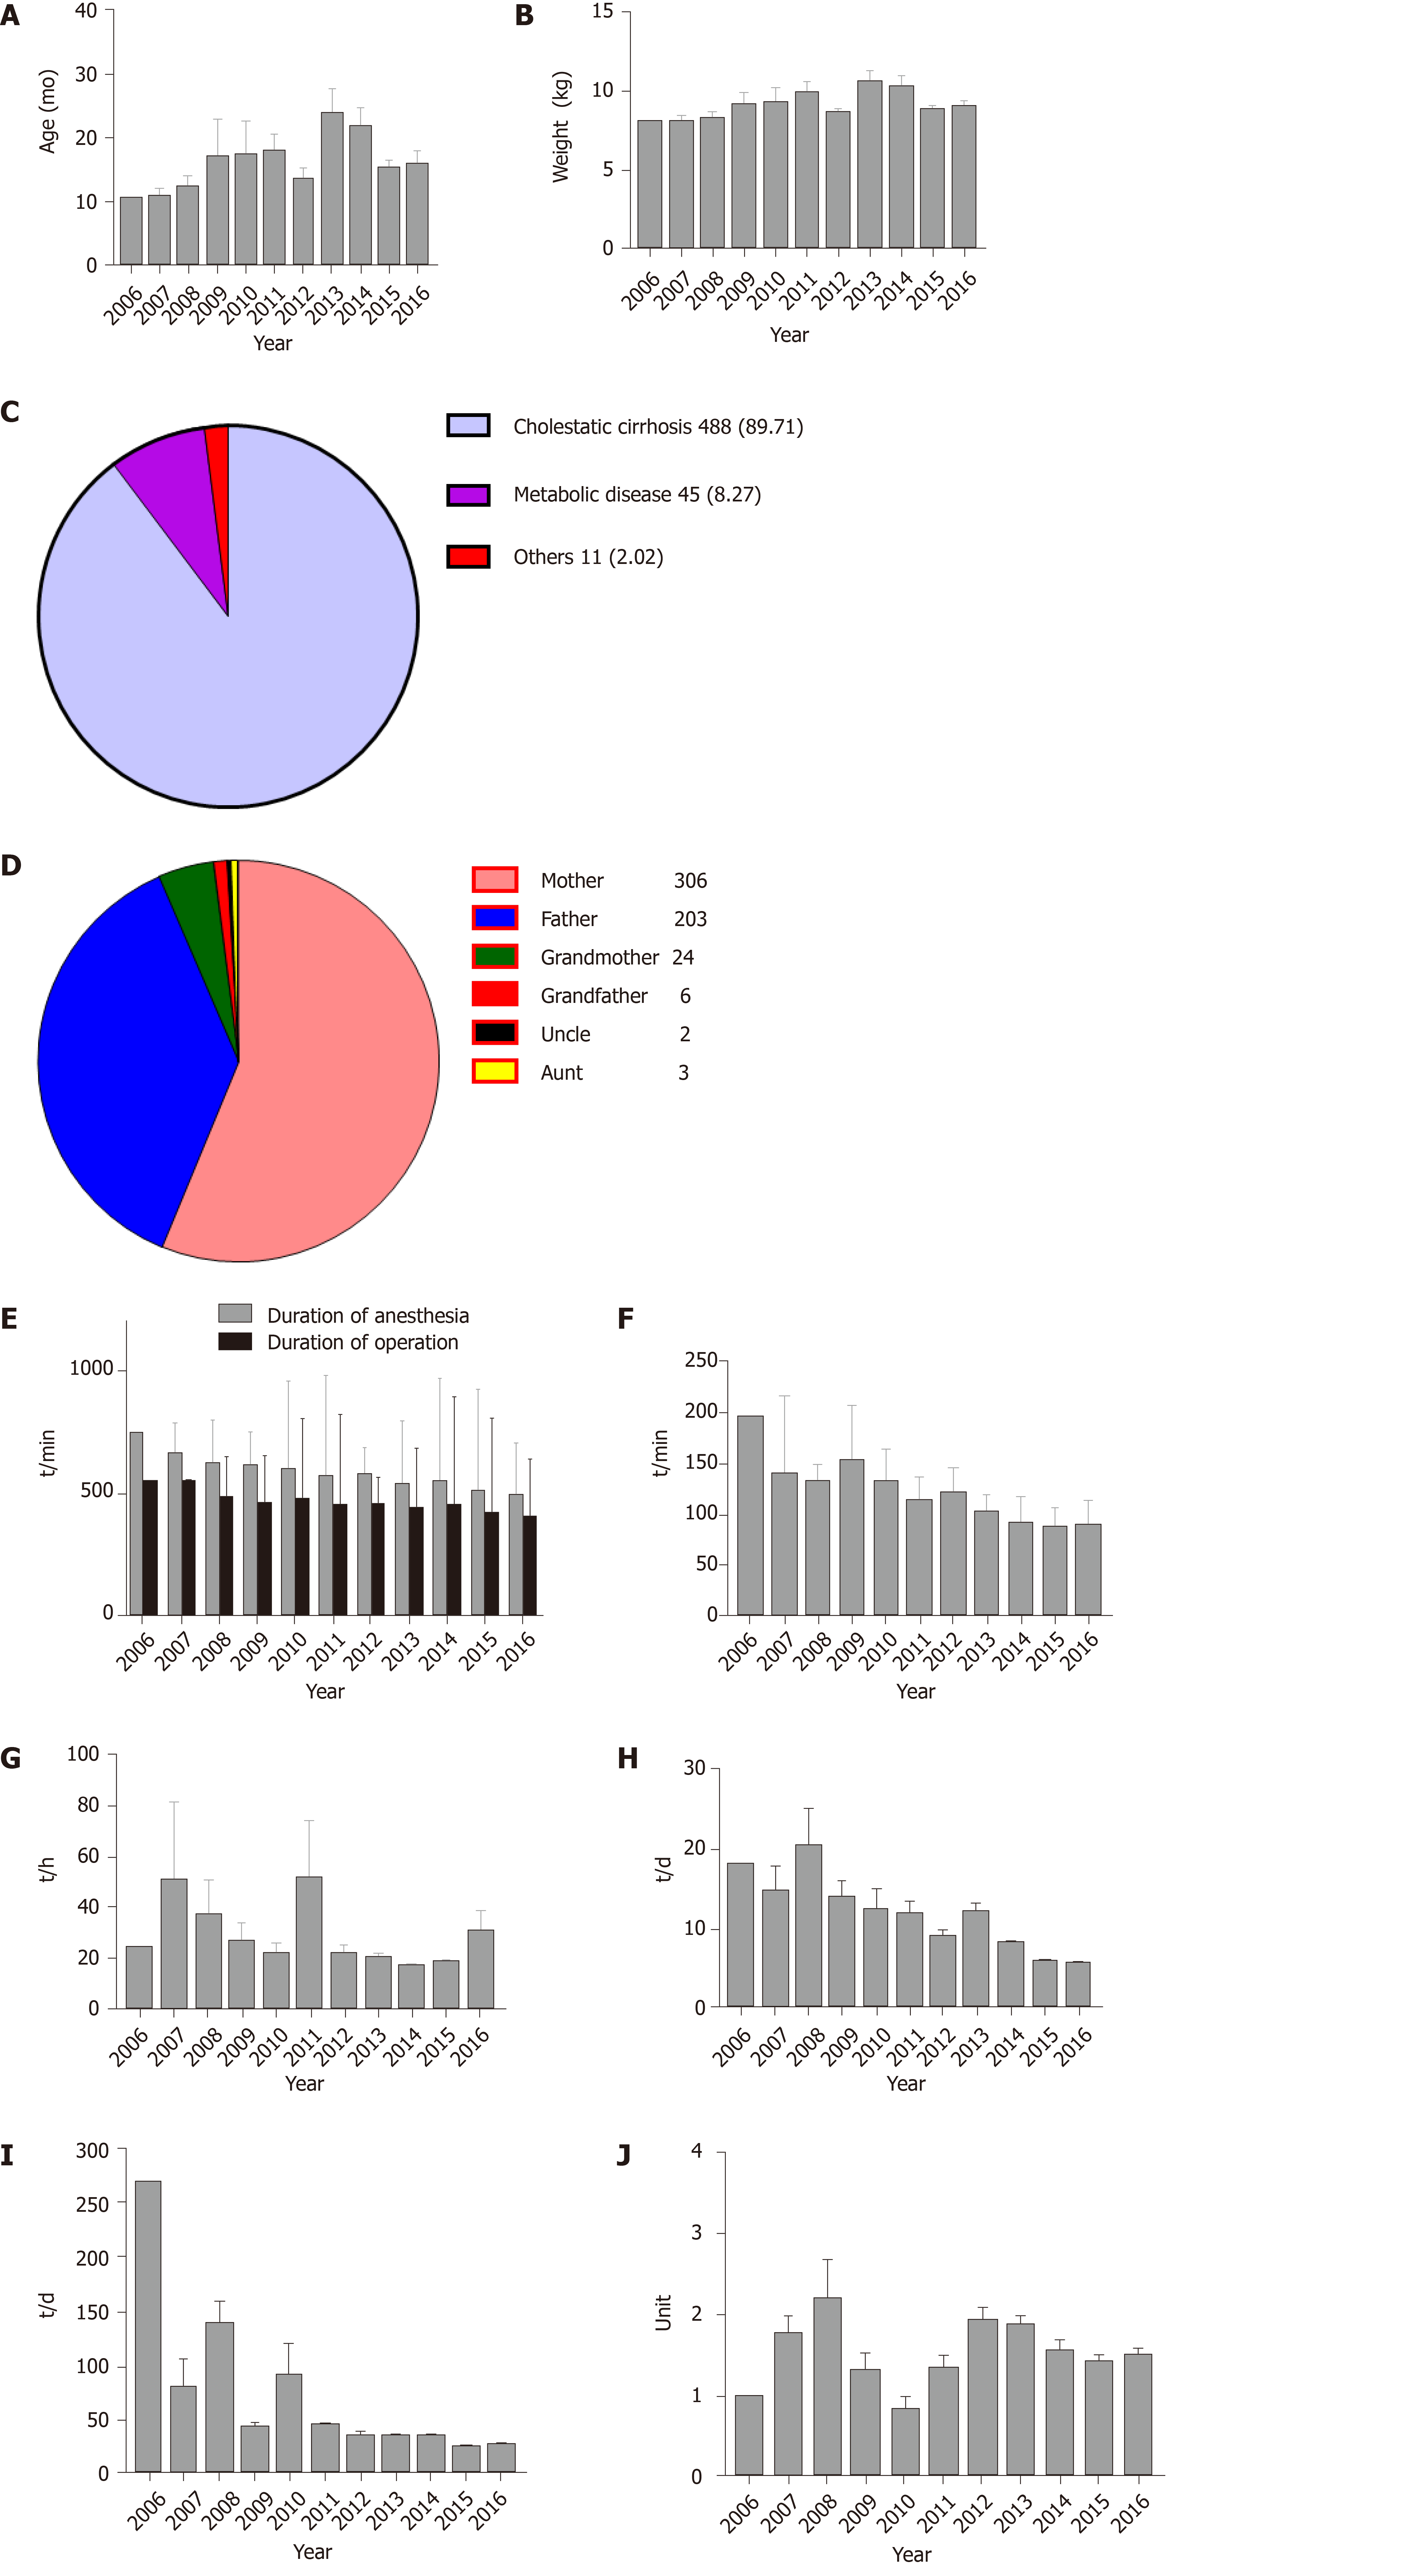
Figure 2 Characteristics of donors and recipients.
A: Age of the recipients; B: Weight of the recipients; C: Demographics of the recipients; D: The relationship between donors and recipients; E: Duration of anesthesia and operation; F: Time period between anesthesia induction and surgery initiation. G: Duration of MV in ICU; H: ICU length of stay; I: Postoperative length of stay; J: Perioperative RBC transfusion. LDLT: Living donor liver transplantation; MV: Mechanical ventilation; ICU: Intensive care unit; RBC: Red blood cell.
- Citation: Pan ZY, Fan YC, Wang XQ, Chen LK, Zou QQ, Zhou T, Qiu BJ, Lu YF, Shen CH, Yu WF, Luo Y, Su DS. Pediatric living donor liver transplantation decade progress in Shanghai: Characteristics and risks factors of mortality. World J Gastroenterol 2020; 26(12): 1352-1364
- URL: https://www.wjgnet.com/1007-9327/full/v26/i12/1352.htm
- DOI: https://dx.doi.org/10.3748/wjg.v26.i12.1352


