Copyright
©The Author(s) 2019.
World J Gastroenterol. Mar 7, 2019; 25(9): 1116-1131
Published online Mar 7, 2019. doi: 10.3748/wjg.v25.i9.1116
Published online Mar 7, 2019. doi: 10.3748/wjg.v25.i9.1116
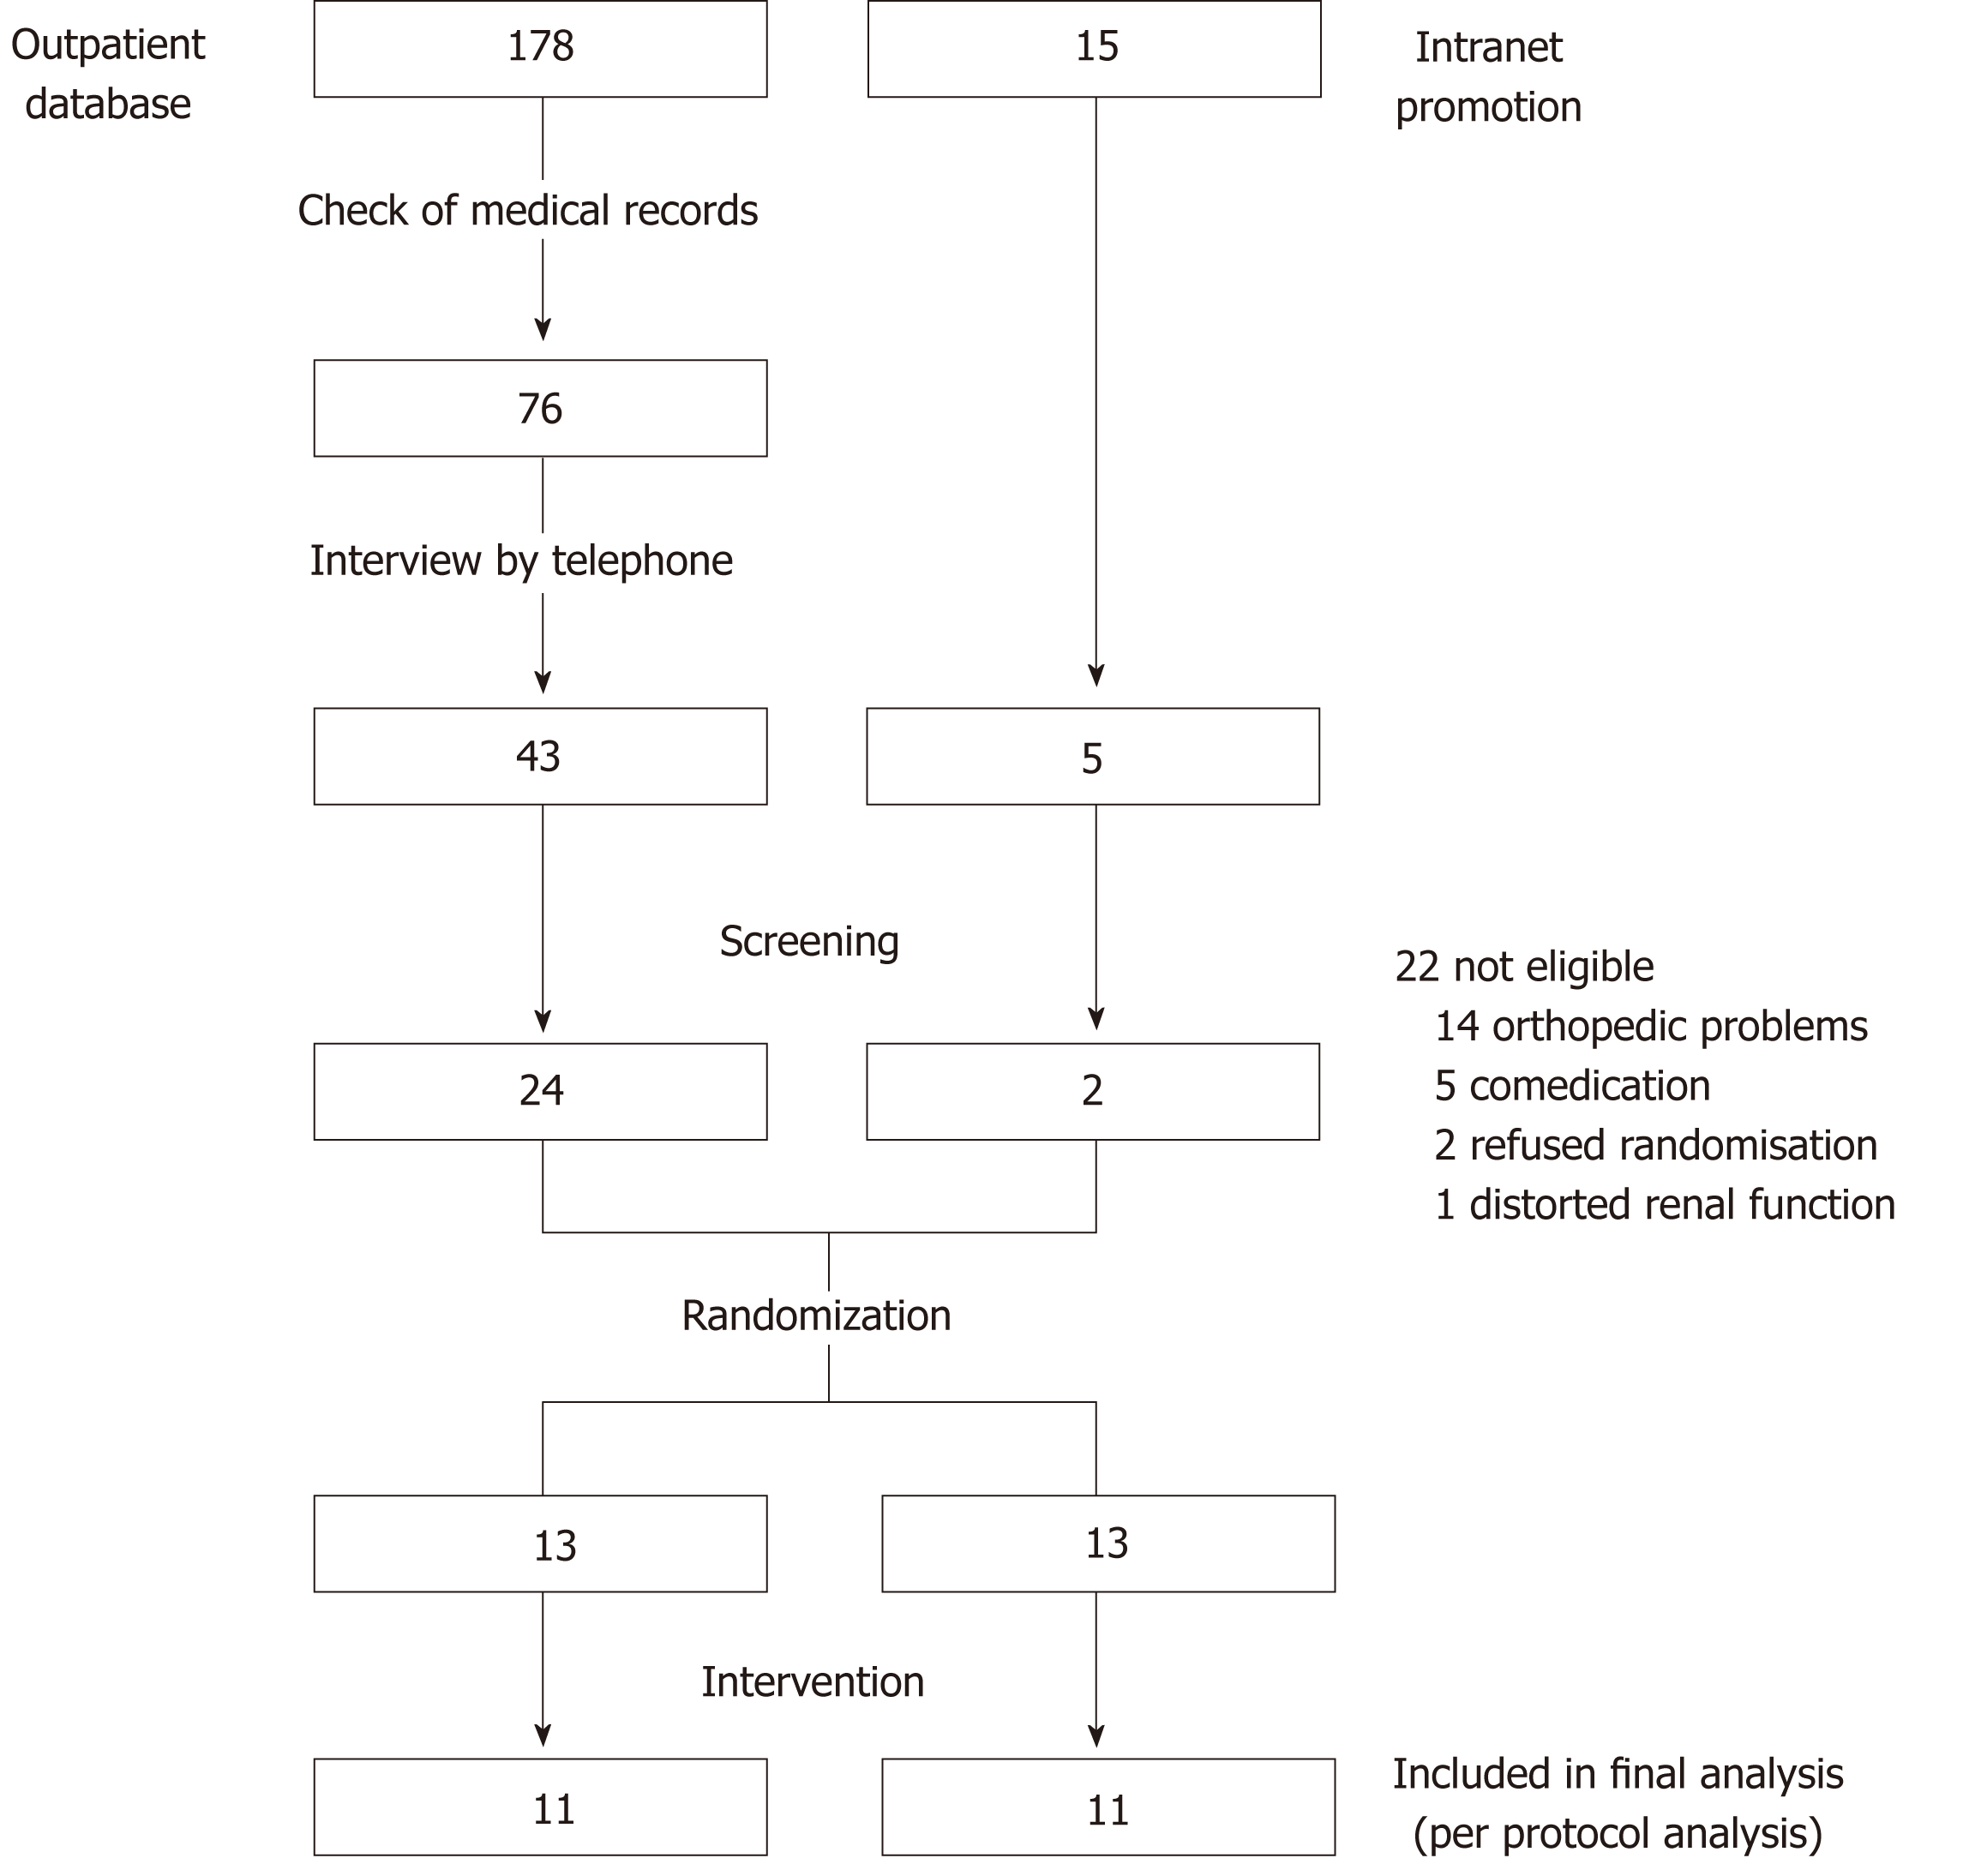
Figure 1 Flowchart of the study selection procedure.
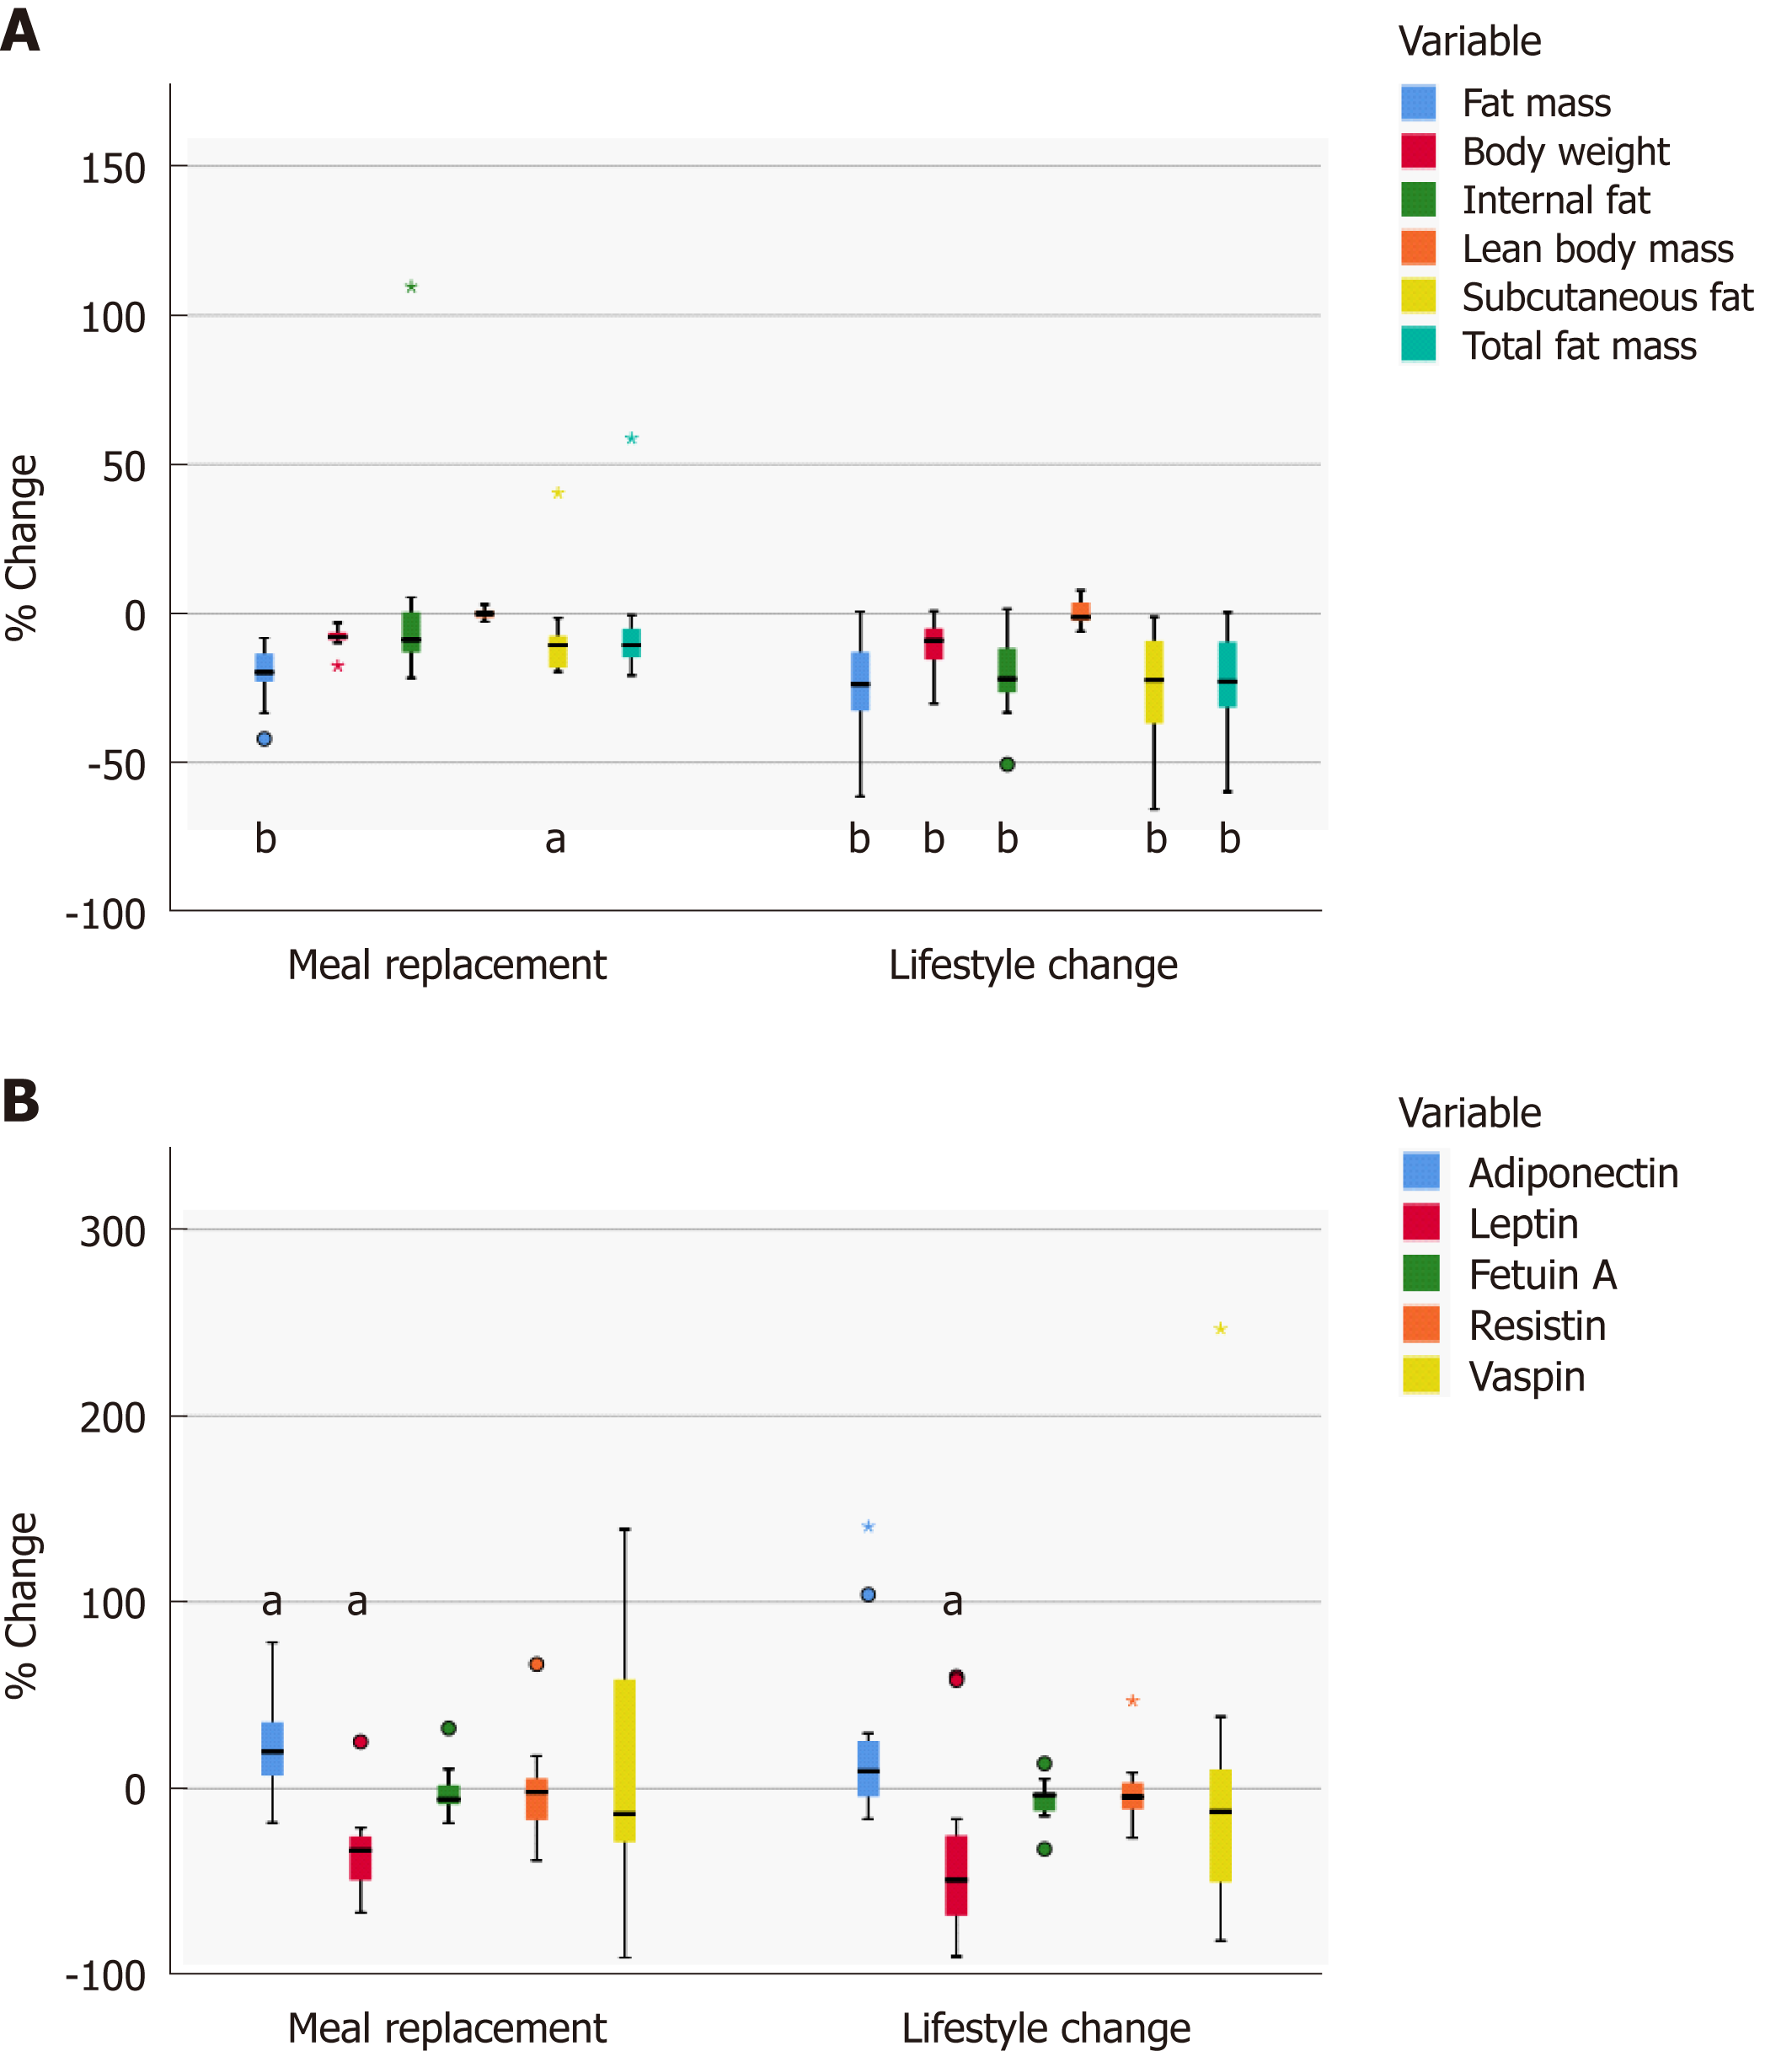
Figure 2 Relative changes in fat components (A) and adipokines (B).
A: Relative changes (boxplots) in body fat mass and lean body mass after the 24-wk intervention estimated by the BodPod device. Relative changes in intraabdominal fat, internal and subcutaneous abdominal fat measured by MRI. Significant differences from baseline are marked with for aP < 0.05 and bP < 0.01. B: Relative changes in adipokines (boxplot). Significant changes from baseline are marked with aP < 0.05.
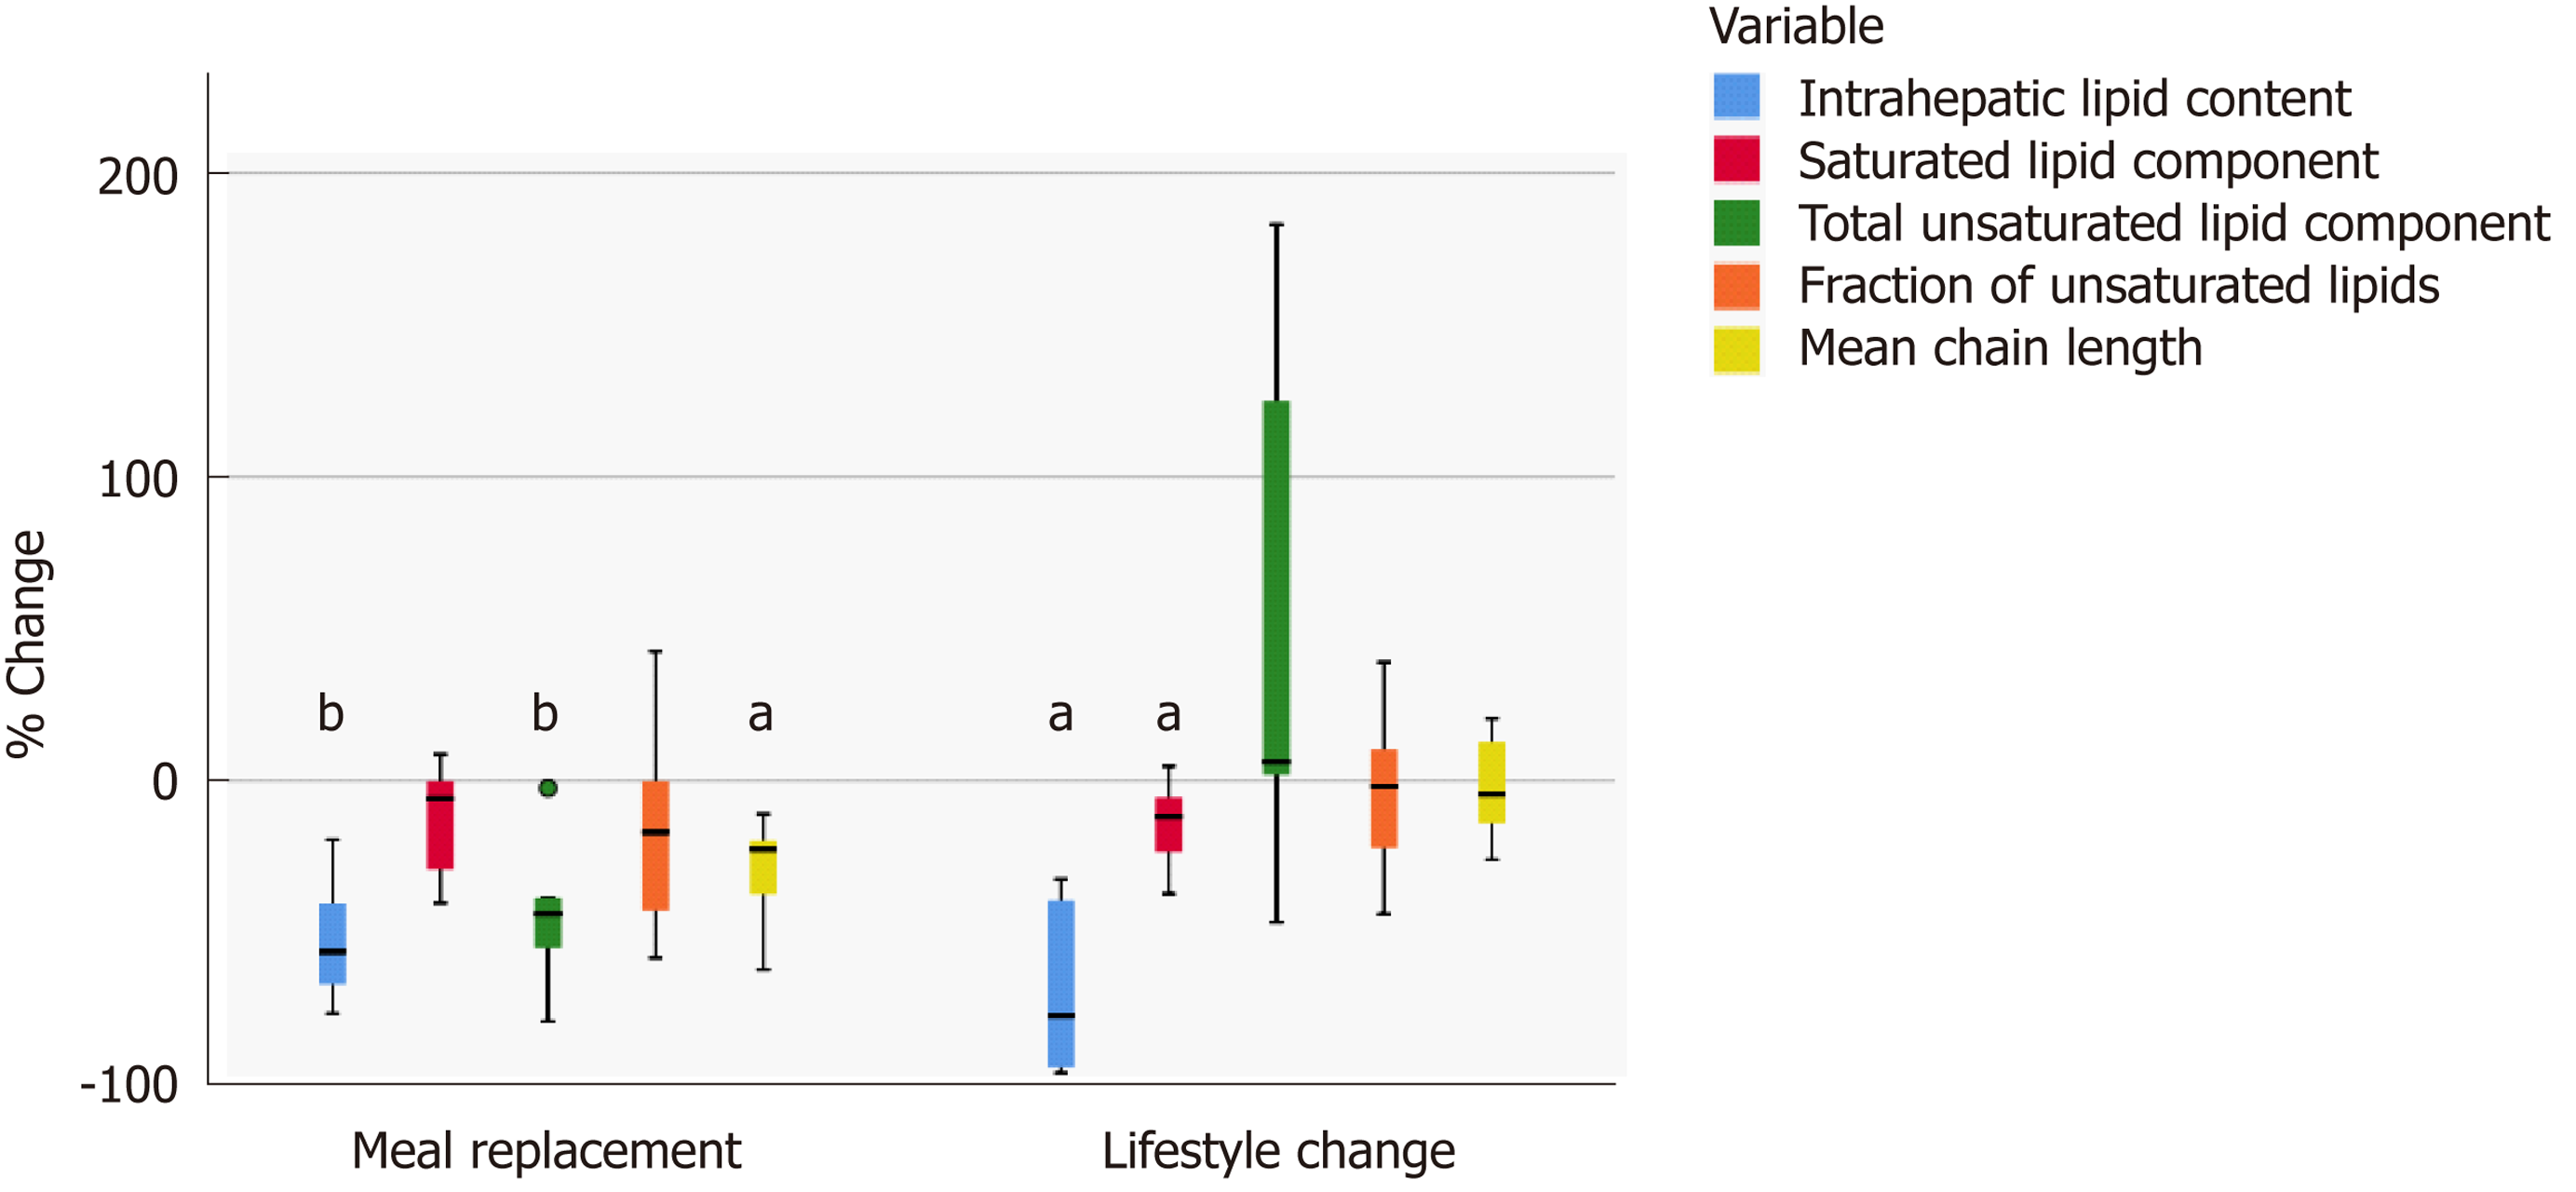
Figure 3 Relative changes in hepatic lipid characteristics.
Relative changes in hepatic lipid characteristics (boxplot). Significant changes from baseline are marked with aP < 0.05 or bP < 0.01.
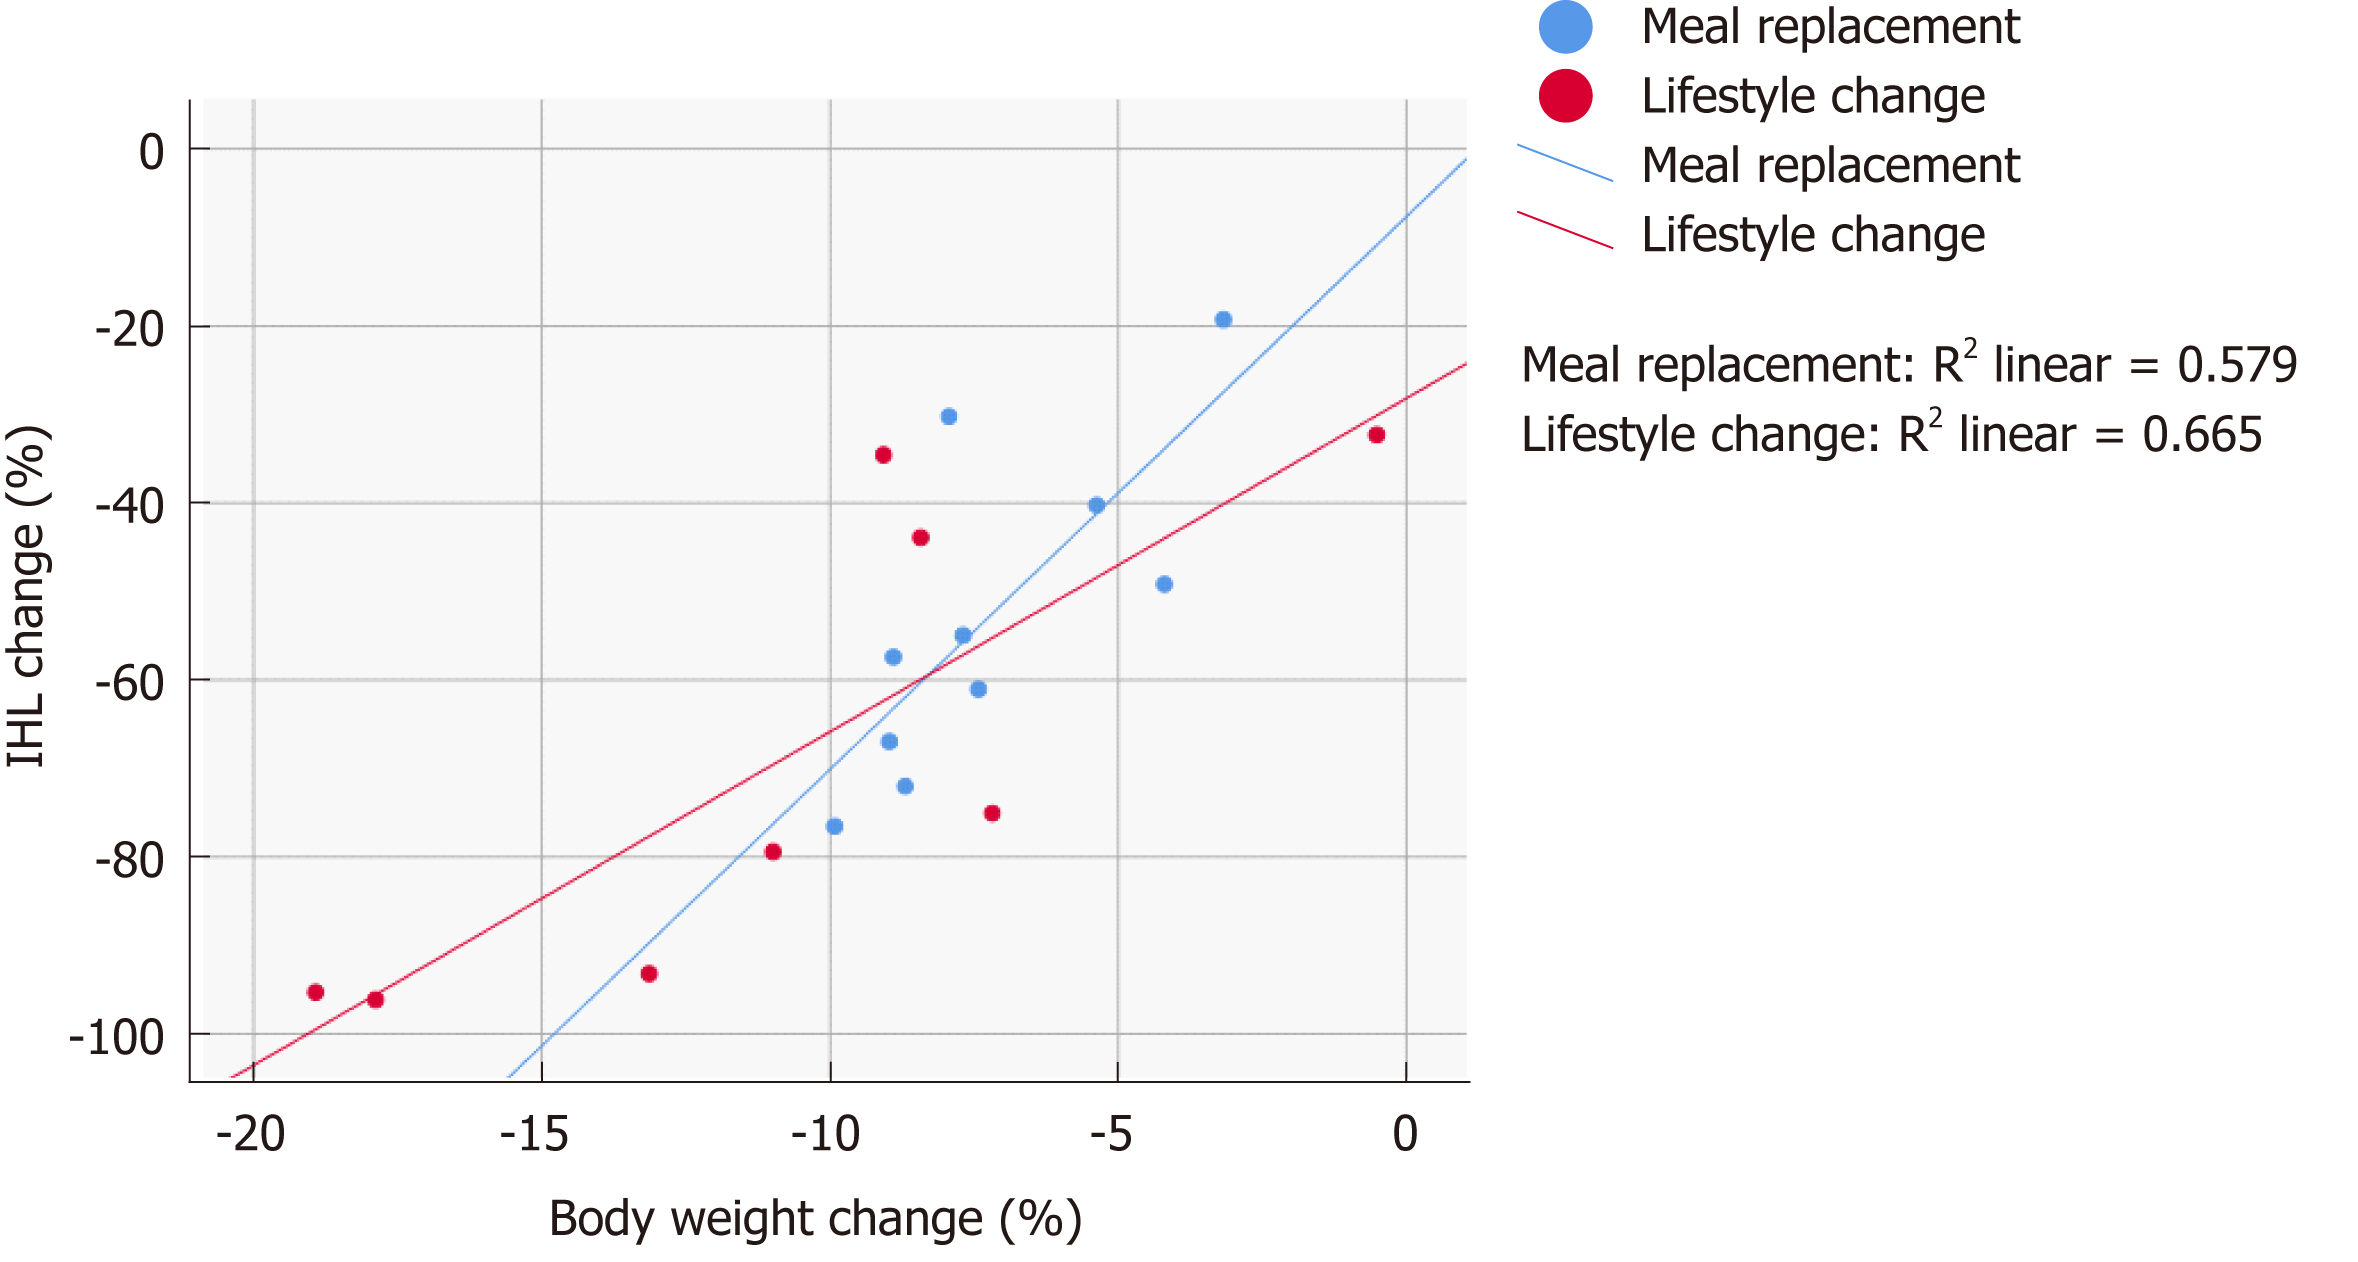
Figure 4 Change in intrahepatic lipid in relation to weight loss.
The relationship between change in body weight and change in intrahepatic lipid content. IHL: Intrahepatic lipid component.
- Citation: Deibert P, Lazaro A, Schaffner D, Berg A, Koenig D, Kreisel W, Baumstark MW, Steinmann D, Buechert M, Lange T. Comprehensive lifestyle intervention vs soy protein-based meal regimen in non-alcoholic steatohepatitis. World J Gastroenterol 2019; 25(9): 1116-1131
- URL: https://www.wjgnet.com/1007-9327/full/v25/i9/1116.htm
- DOI: https://dx.doi.org/10.3748/wjg.v25.i9.1116


