Copyright
©The Author(s) 2019.
World J Gastroenterol. Oct 28, 2019; 25(40): 6158-6171
Published online Oct 28, 2019. doi: 10.3748/wjg.v25.i40.6158
Published online Oct 28, 2019. doi: 10.3748/wjg.v25.i40.6158
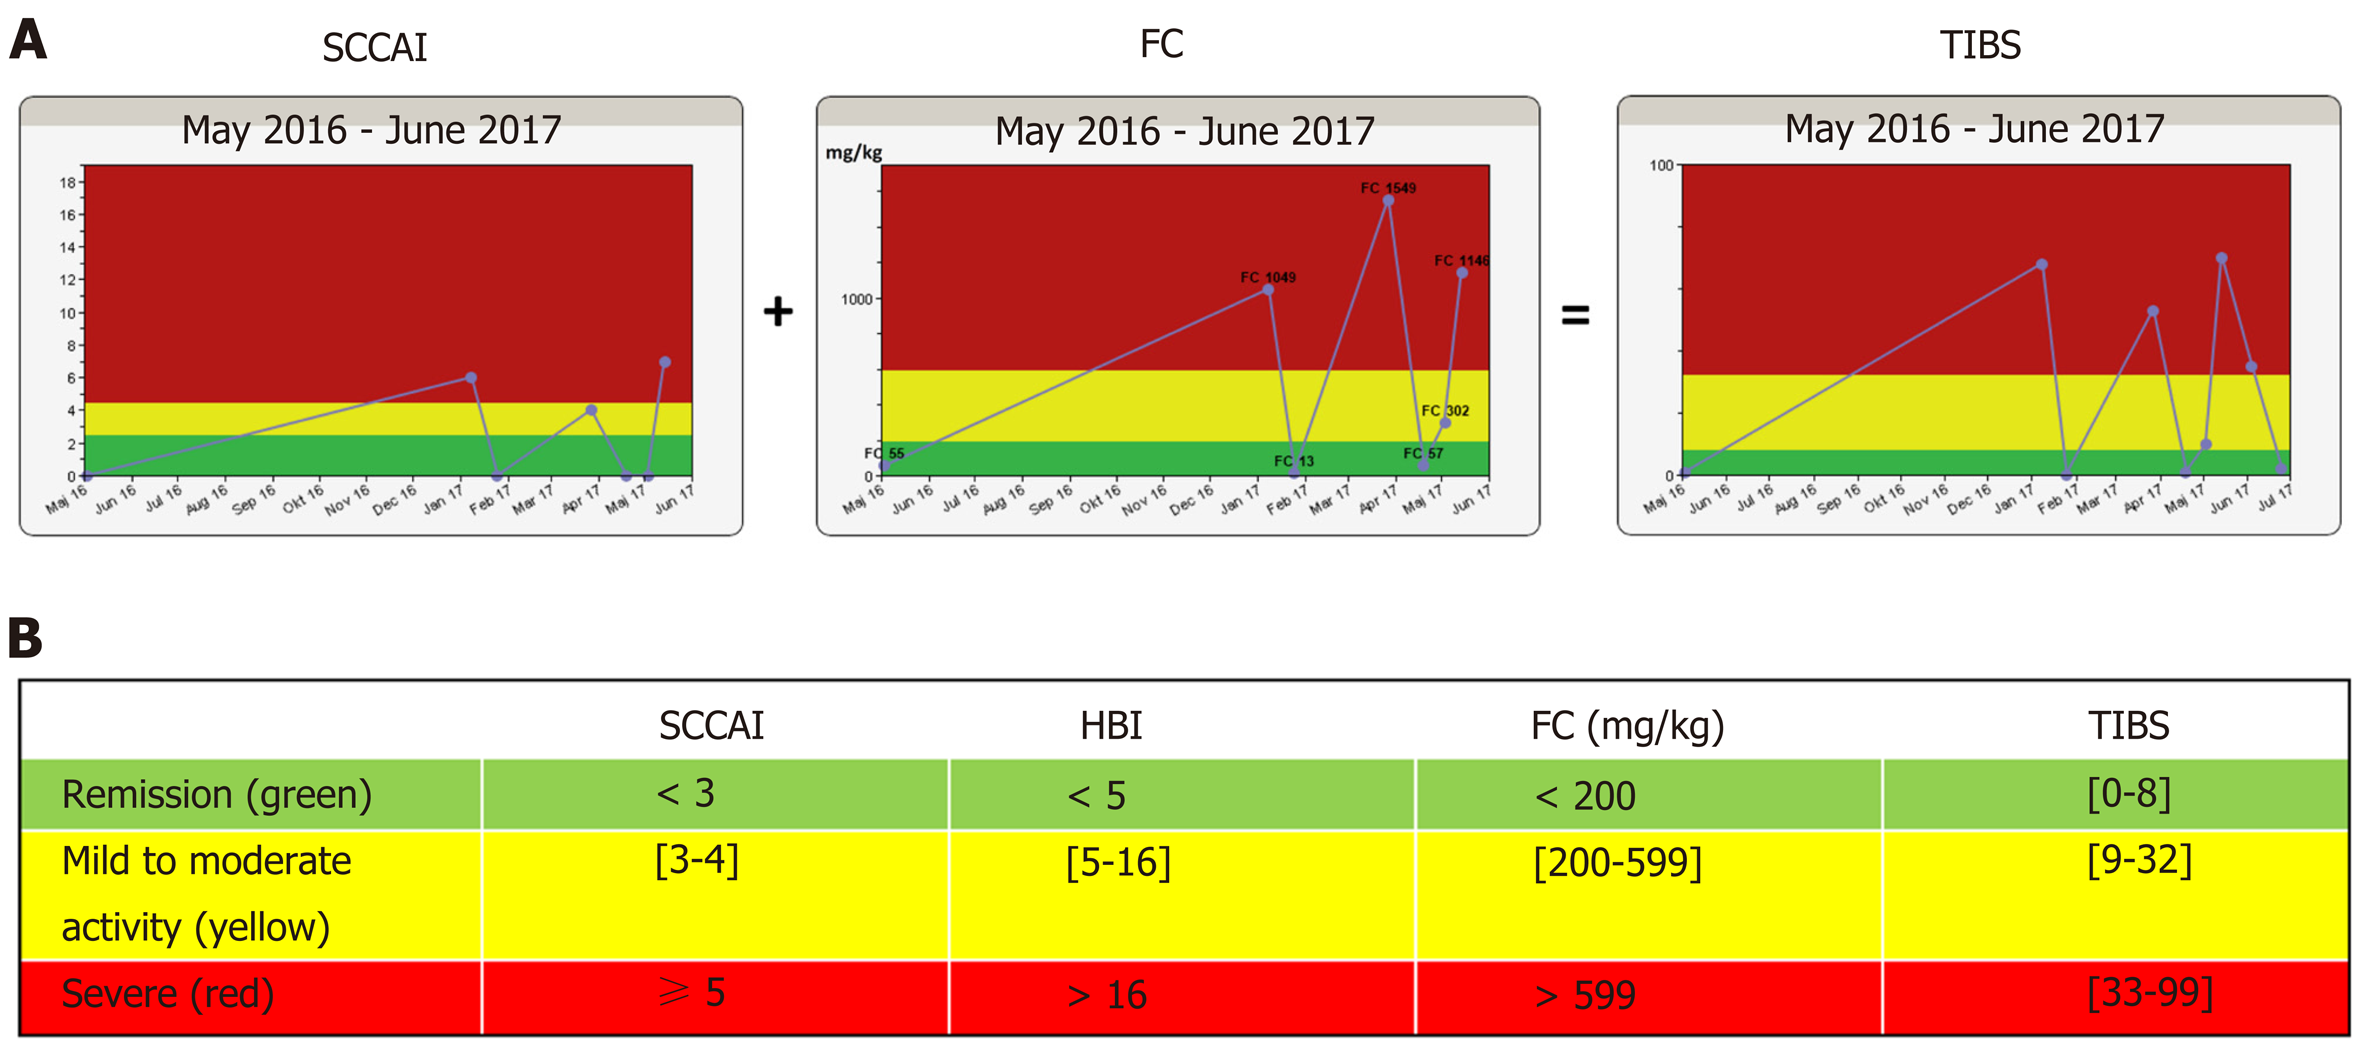
Figure 1 Disease activity algorithm in the constant care application consisting of the simple clinical colitis activity index for patients having ulcerative colitis or the Harvey-Bradshaw Index for patients having Crohn’s disease, plus a validated FC home test.
The total inflammation burden score algorithm is presented as a traffic light system to patients and eCare providers. A: The algorithm of a patient with ulcerative colitis treated with 5-aminosalicylates only; B: Disease activity cut-off values of the algorithm. SCCAI: Simple clinical colitis activity index; HBI: Harvey-Bradshaw Index; TIBS: Total inflammation burden scoring; FC: Fecal calprotectin.
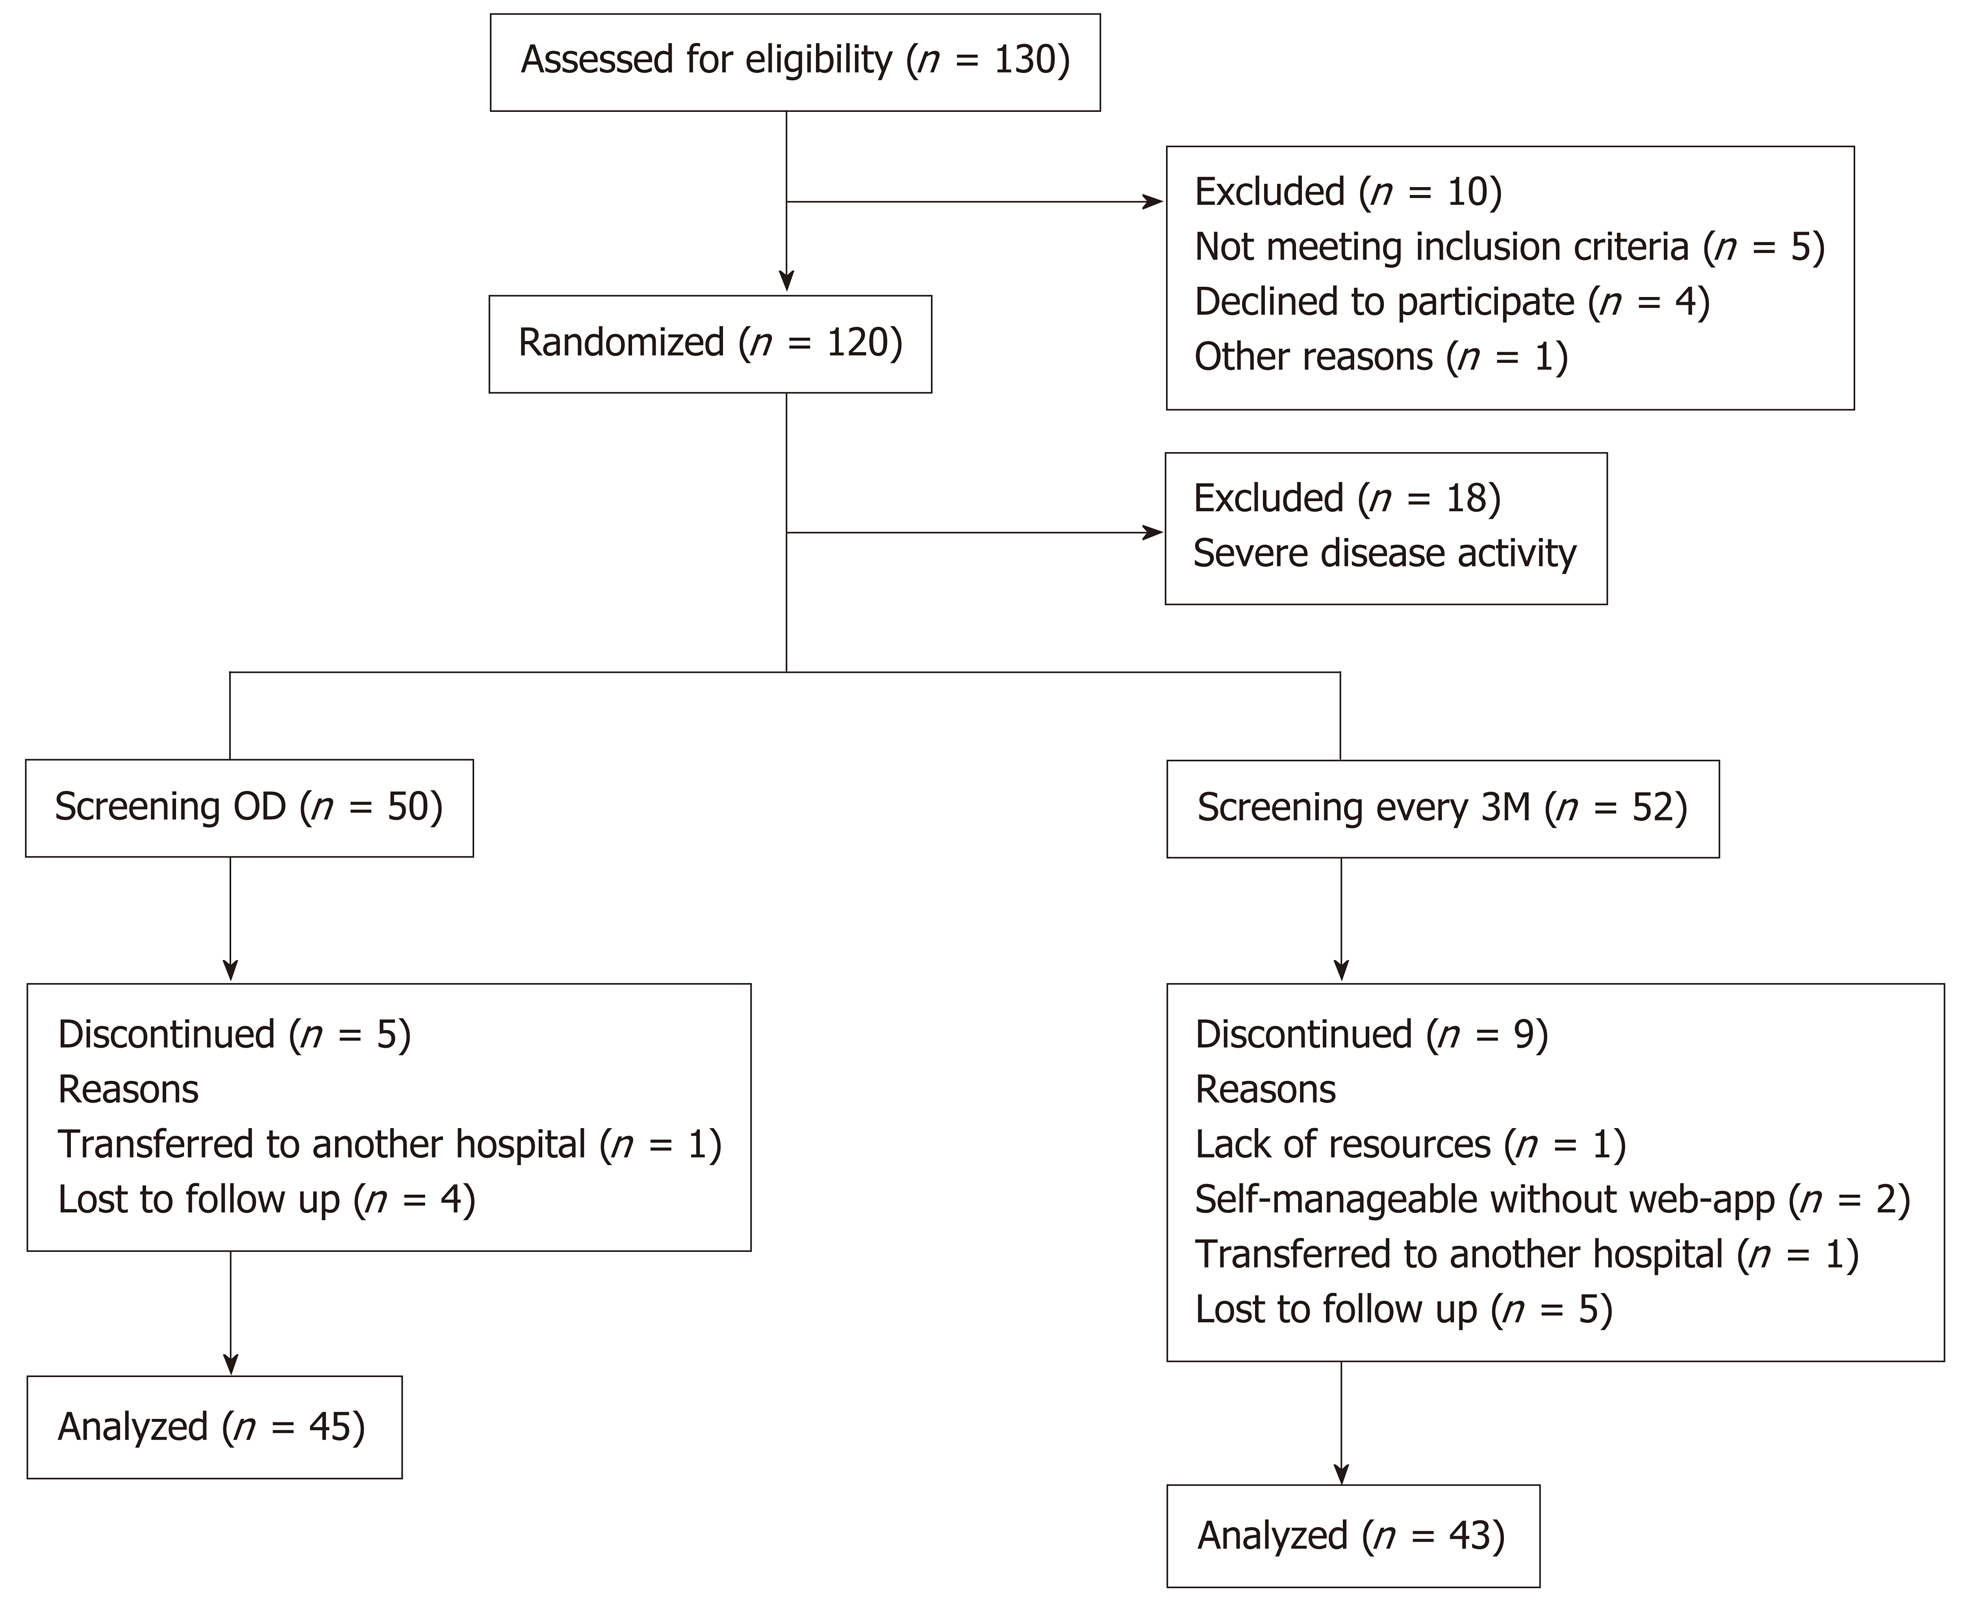
Figure 2 Flow chart of inclusion and follow-up of patients with inflammatory bowel disease.
OD: On demand; 3M: Third month.
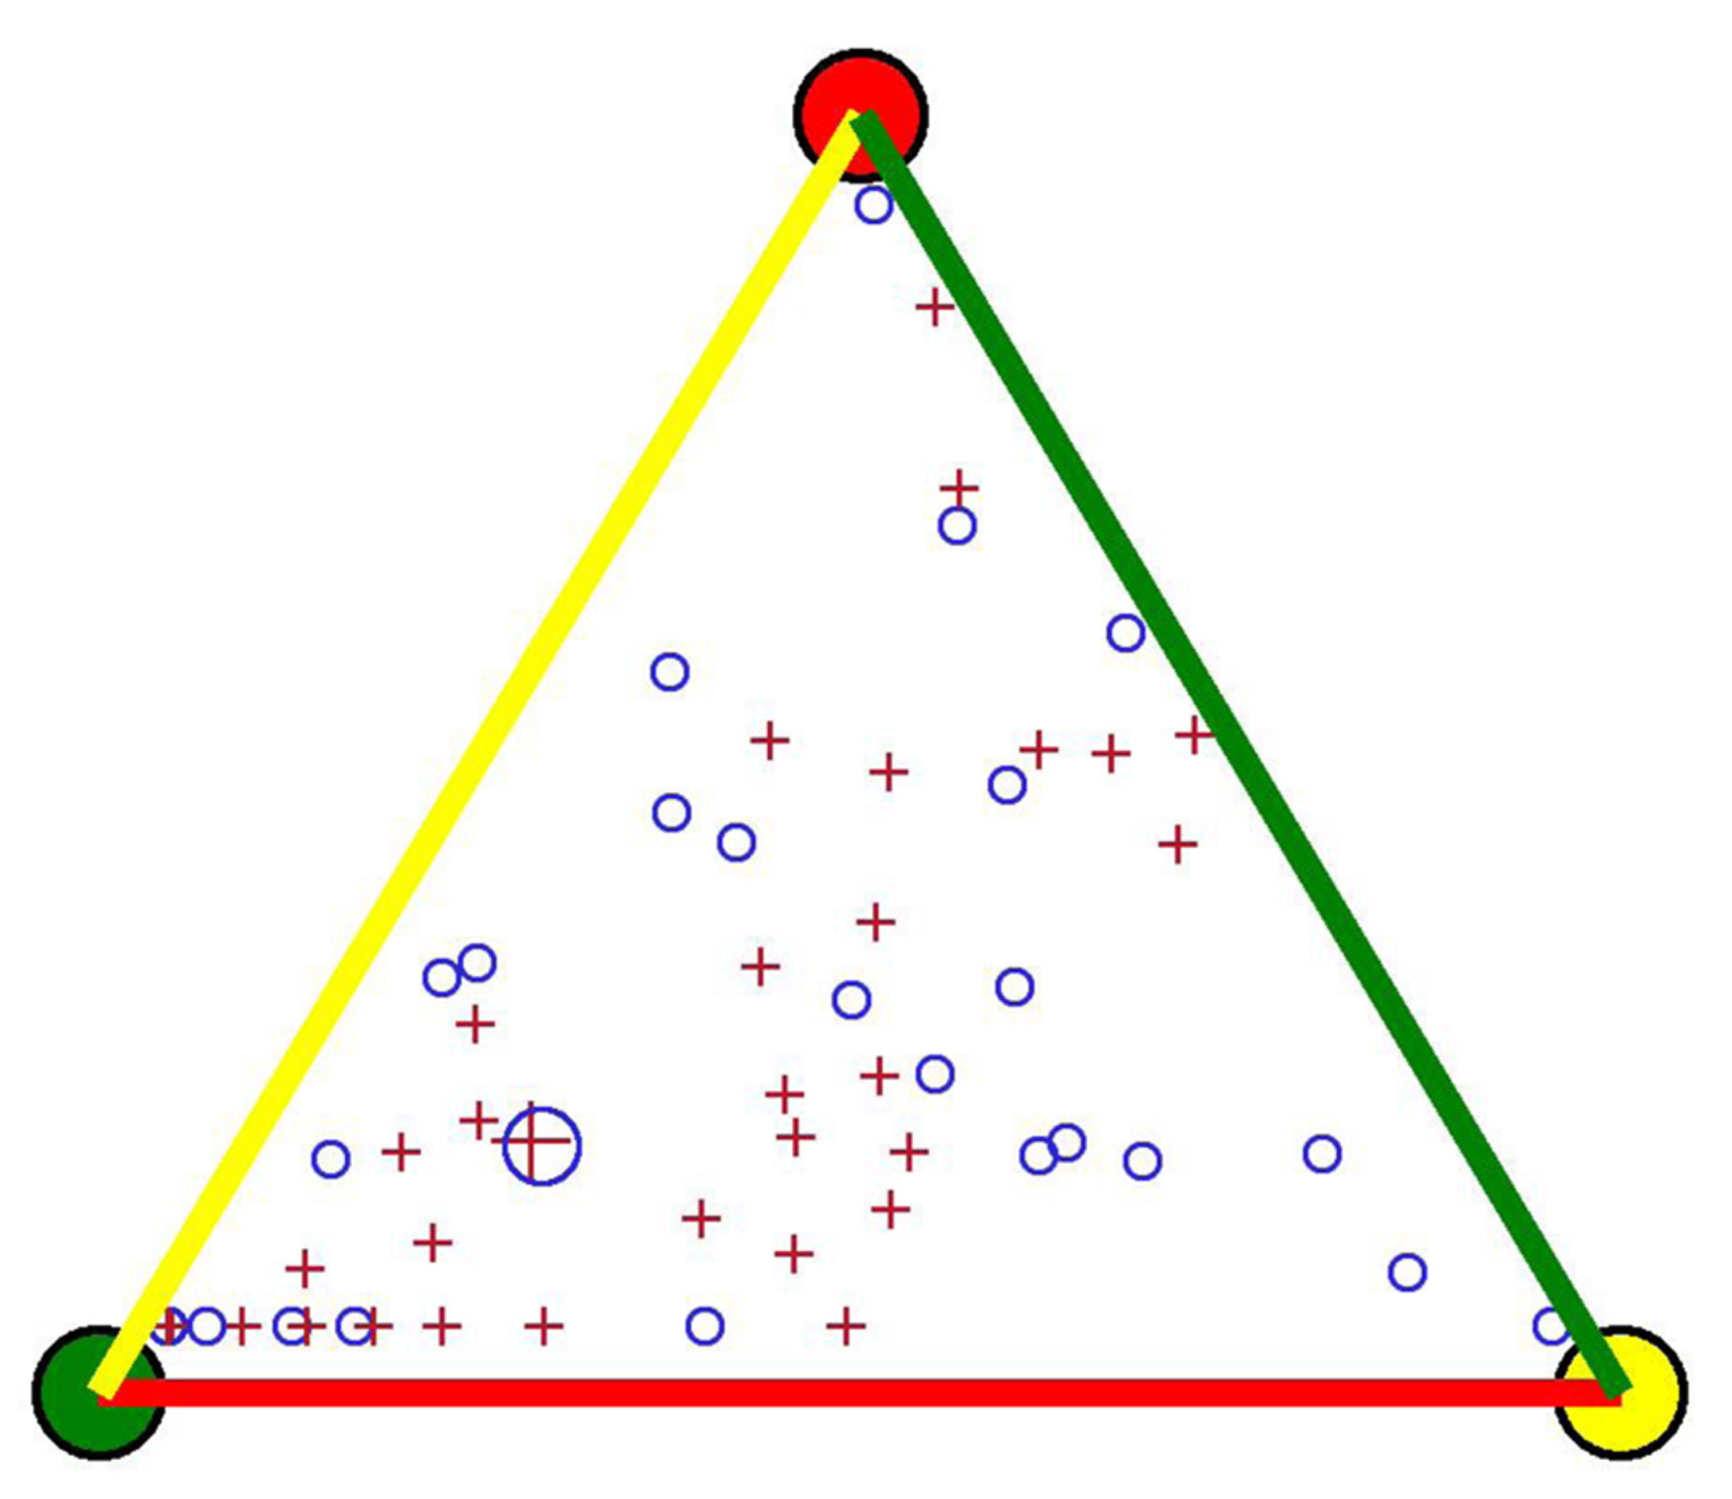
Figure 3 No significant difference was found in the mean length of time spent in remission or active disease throughout 1 year for the two screening procedures of fecal calprotectin, illustrated with an enlarged circle and cross.
The length of time spent in FC remission (green), moderate activity (yellow), and severe activity (red) by each patient is represented by small circles (on demand) and crosses (every third month). The distance (perpendicular) from a small circle or cross within the triangle to a side of the triangle represents the length of time spent in that FC zone. FC: Fecal calprotectin.
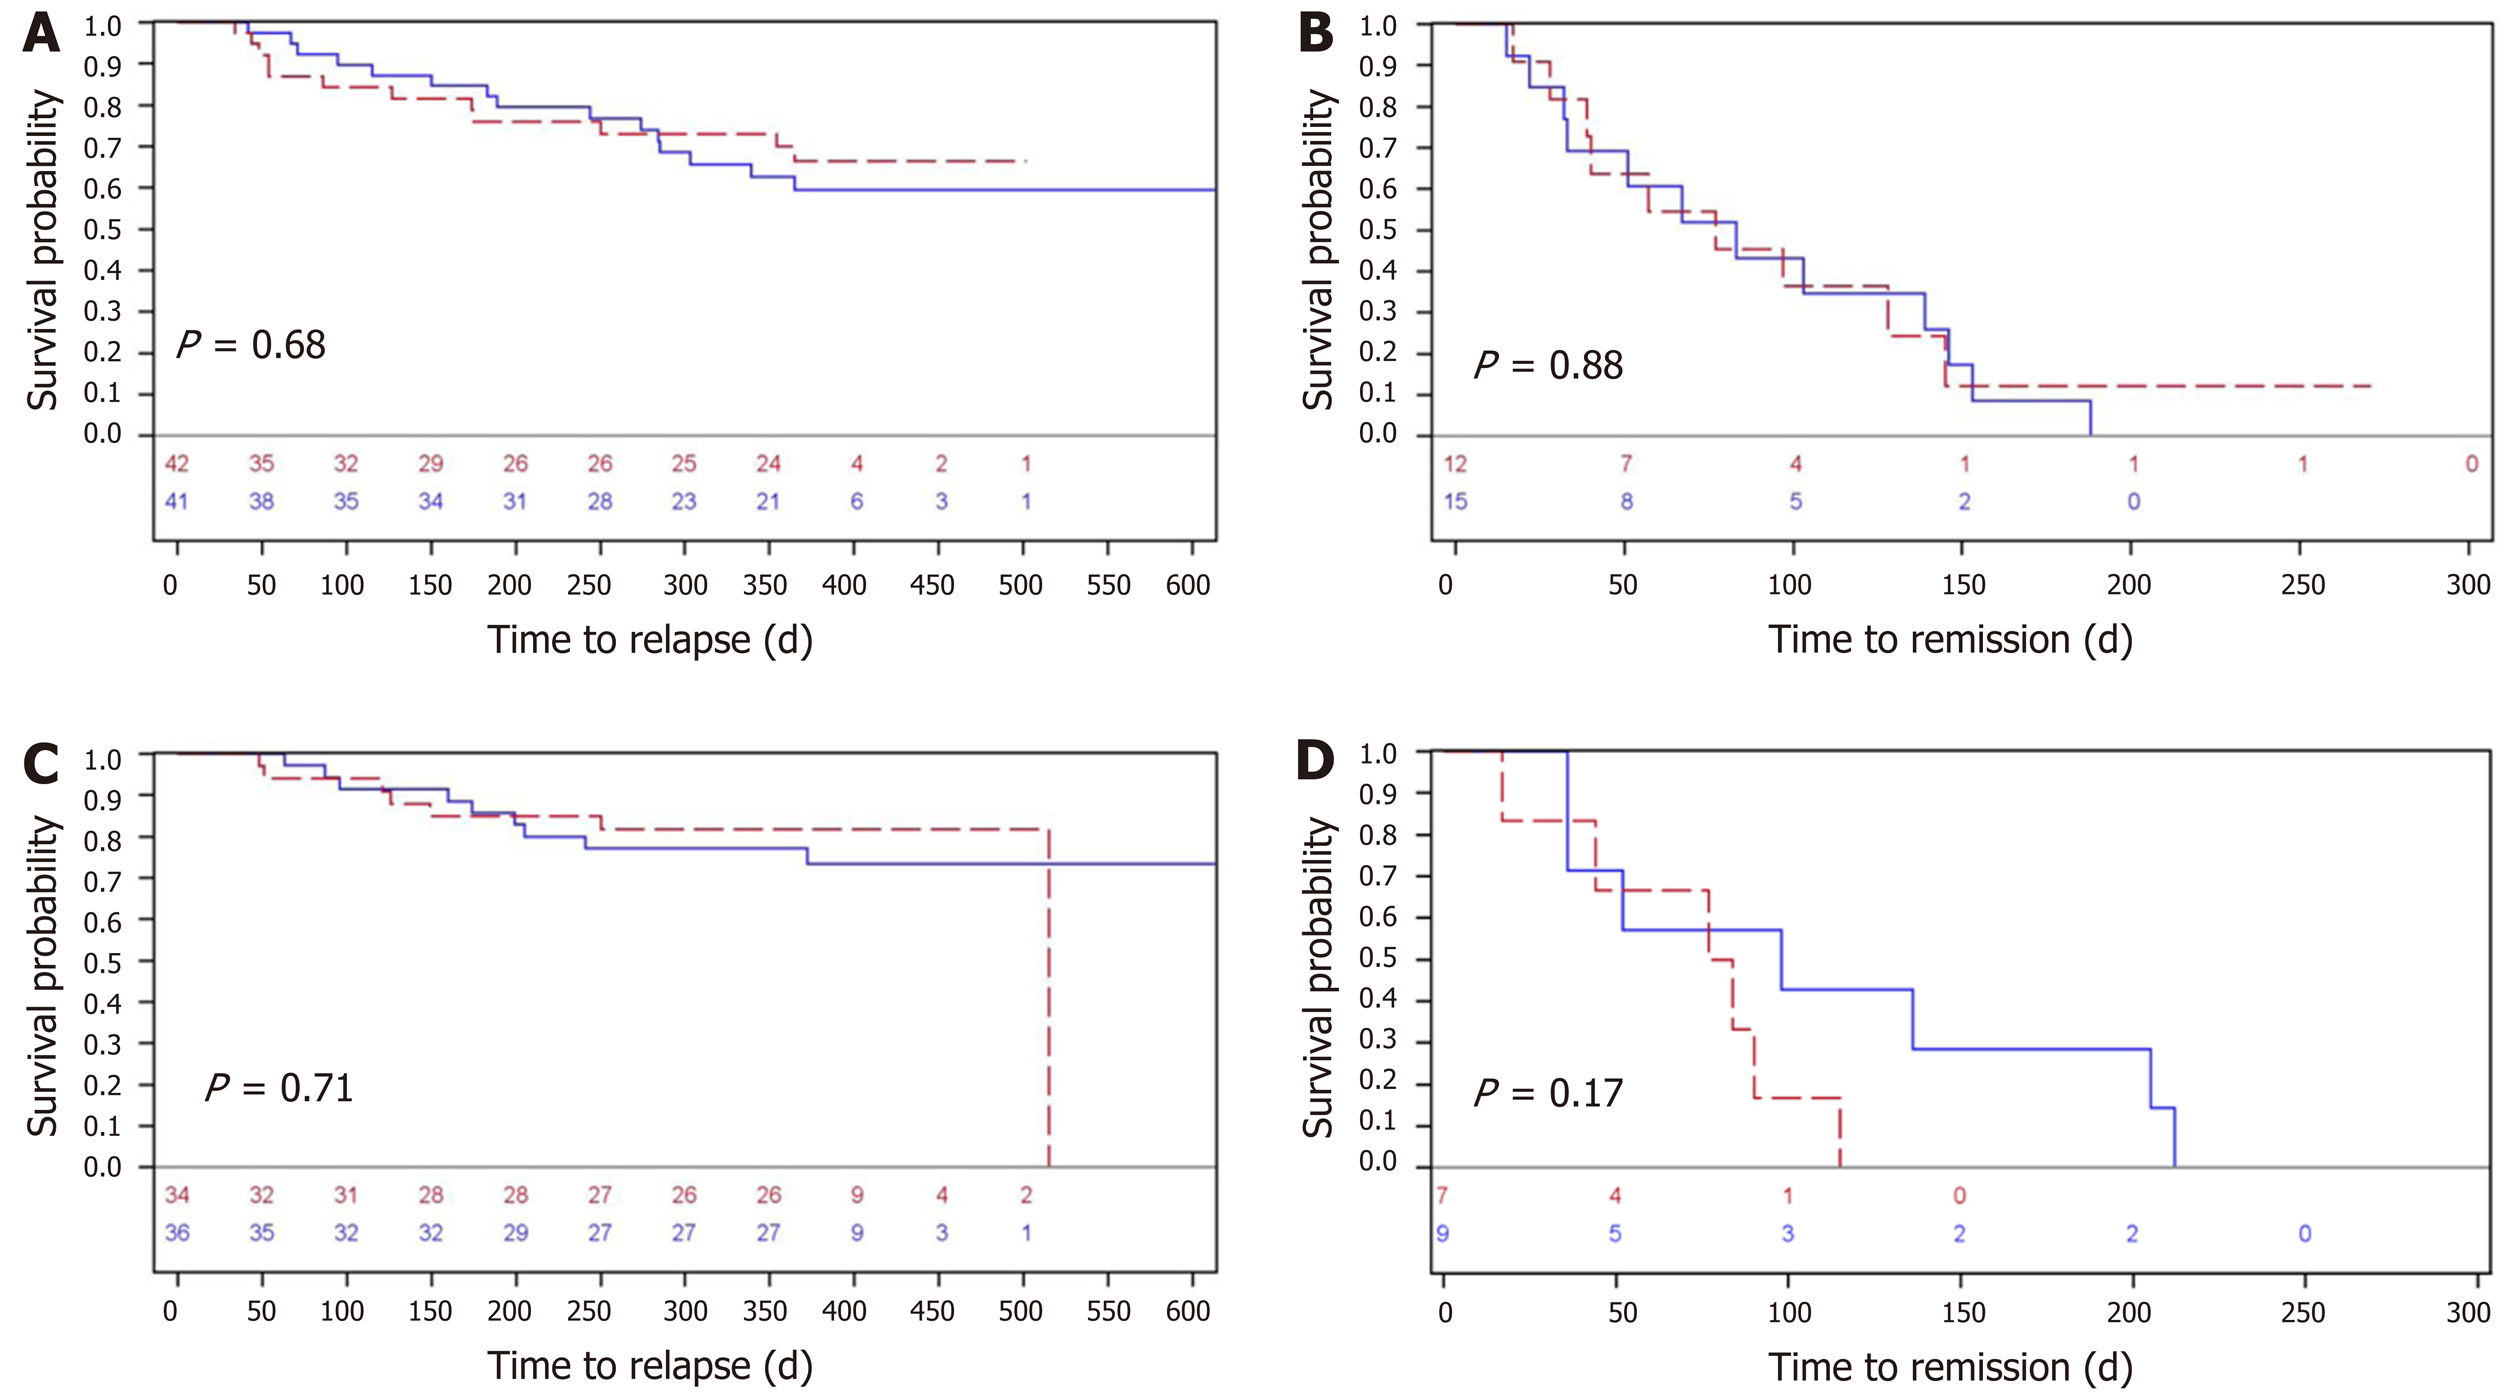
Figure 4 Analyzed by fecal calprotectin and simple clinical colitis activity index for all patients at risk.
A: Time to severe relapse (in days) measured by fecal calprotectin for all patients at risk (n = 83); B: The corresponding (days) to remission (n = 27); C: Time in days to a severe relapse measured by simple clinical colitis activity index for all patients with ulcerative colitis at risk (n = 70); D: The corresponding time (days) to remission (n = 16). The two electronic health screening procedures (every third month and on demand) are represented by blue and red lines, respectively.
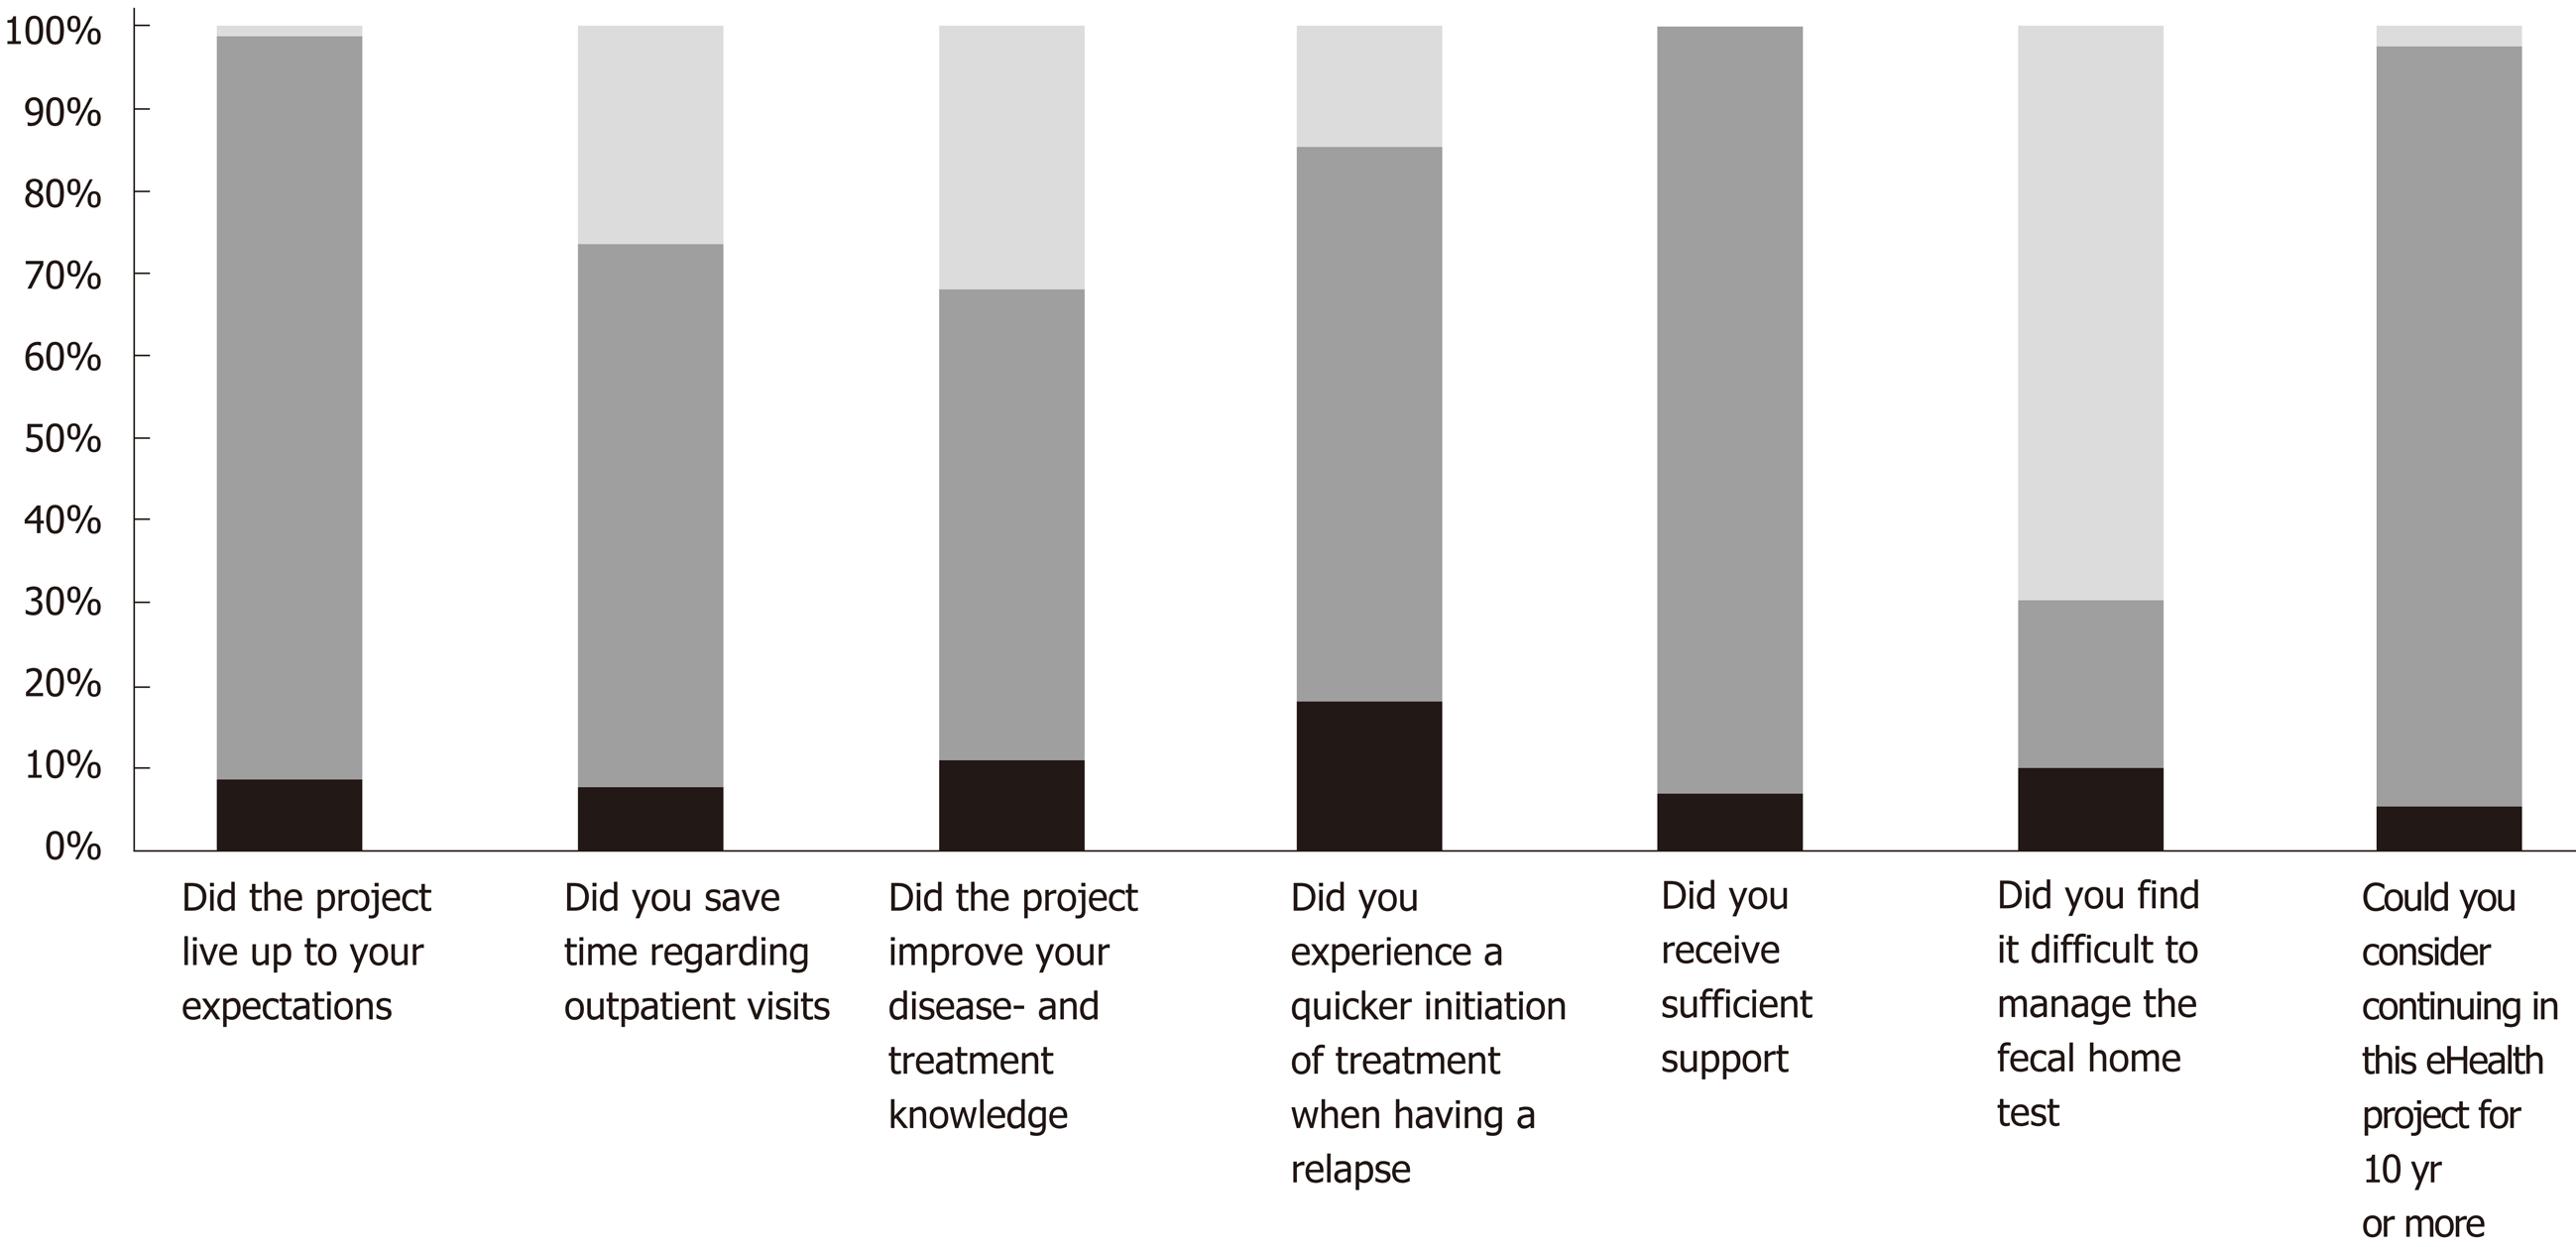
Figure 5 Patient-reported satisfaction with the study, n = 88.
Black = missing, dark gray = Yes, and light gray = No.
- Citation: Ankersen DV, Weimers P, Marker D, Bennedsen M, Saboori S, Paridaens K, Burisch J, Munkholm P. Individualized home-monitoring of disease activity in adult patients with inflammatory bowel disease can be recommended in clinical practice: A randomized-clinical trial. World J Gastroenterol 2019; 25(40): 6158-6171
- URL: https://www.wjgnet.com/1007-9327/full/v25/i40/6158.htm
- DOI: https://dx.doi.org/10.3748/wjg.v25.i40.6158


