Copyright
©The Author(s) 2019.
World J Gastroenterol. Oct 28, 2019; 25(40): 6116-6128
Published online Oct 28, 2019. doi: 10.3748/wjg.v25.i40.6116
Published online Oct 28, 2019. doi: 10.3748/wjg.v25.i40.6116
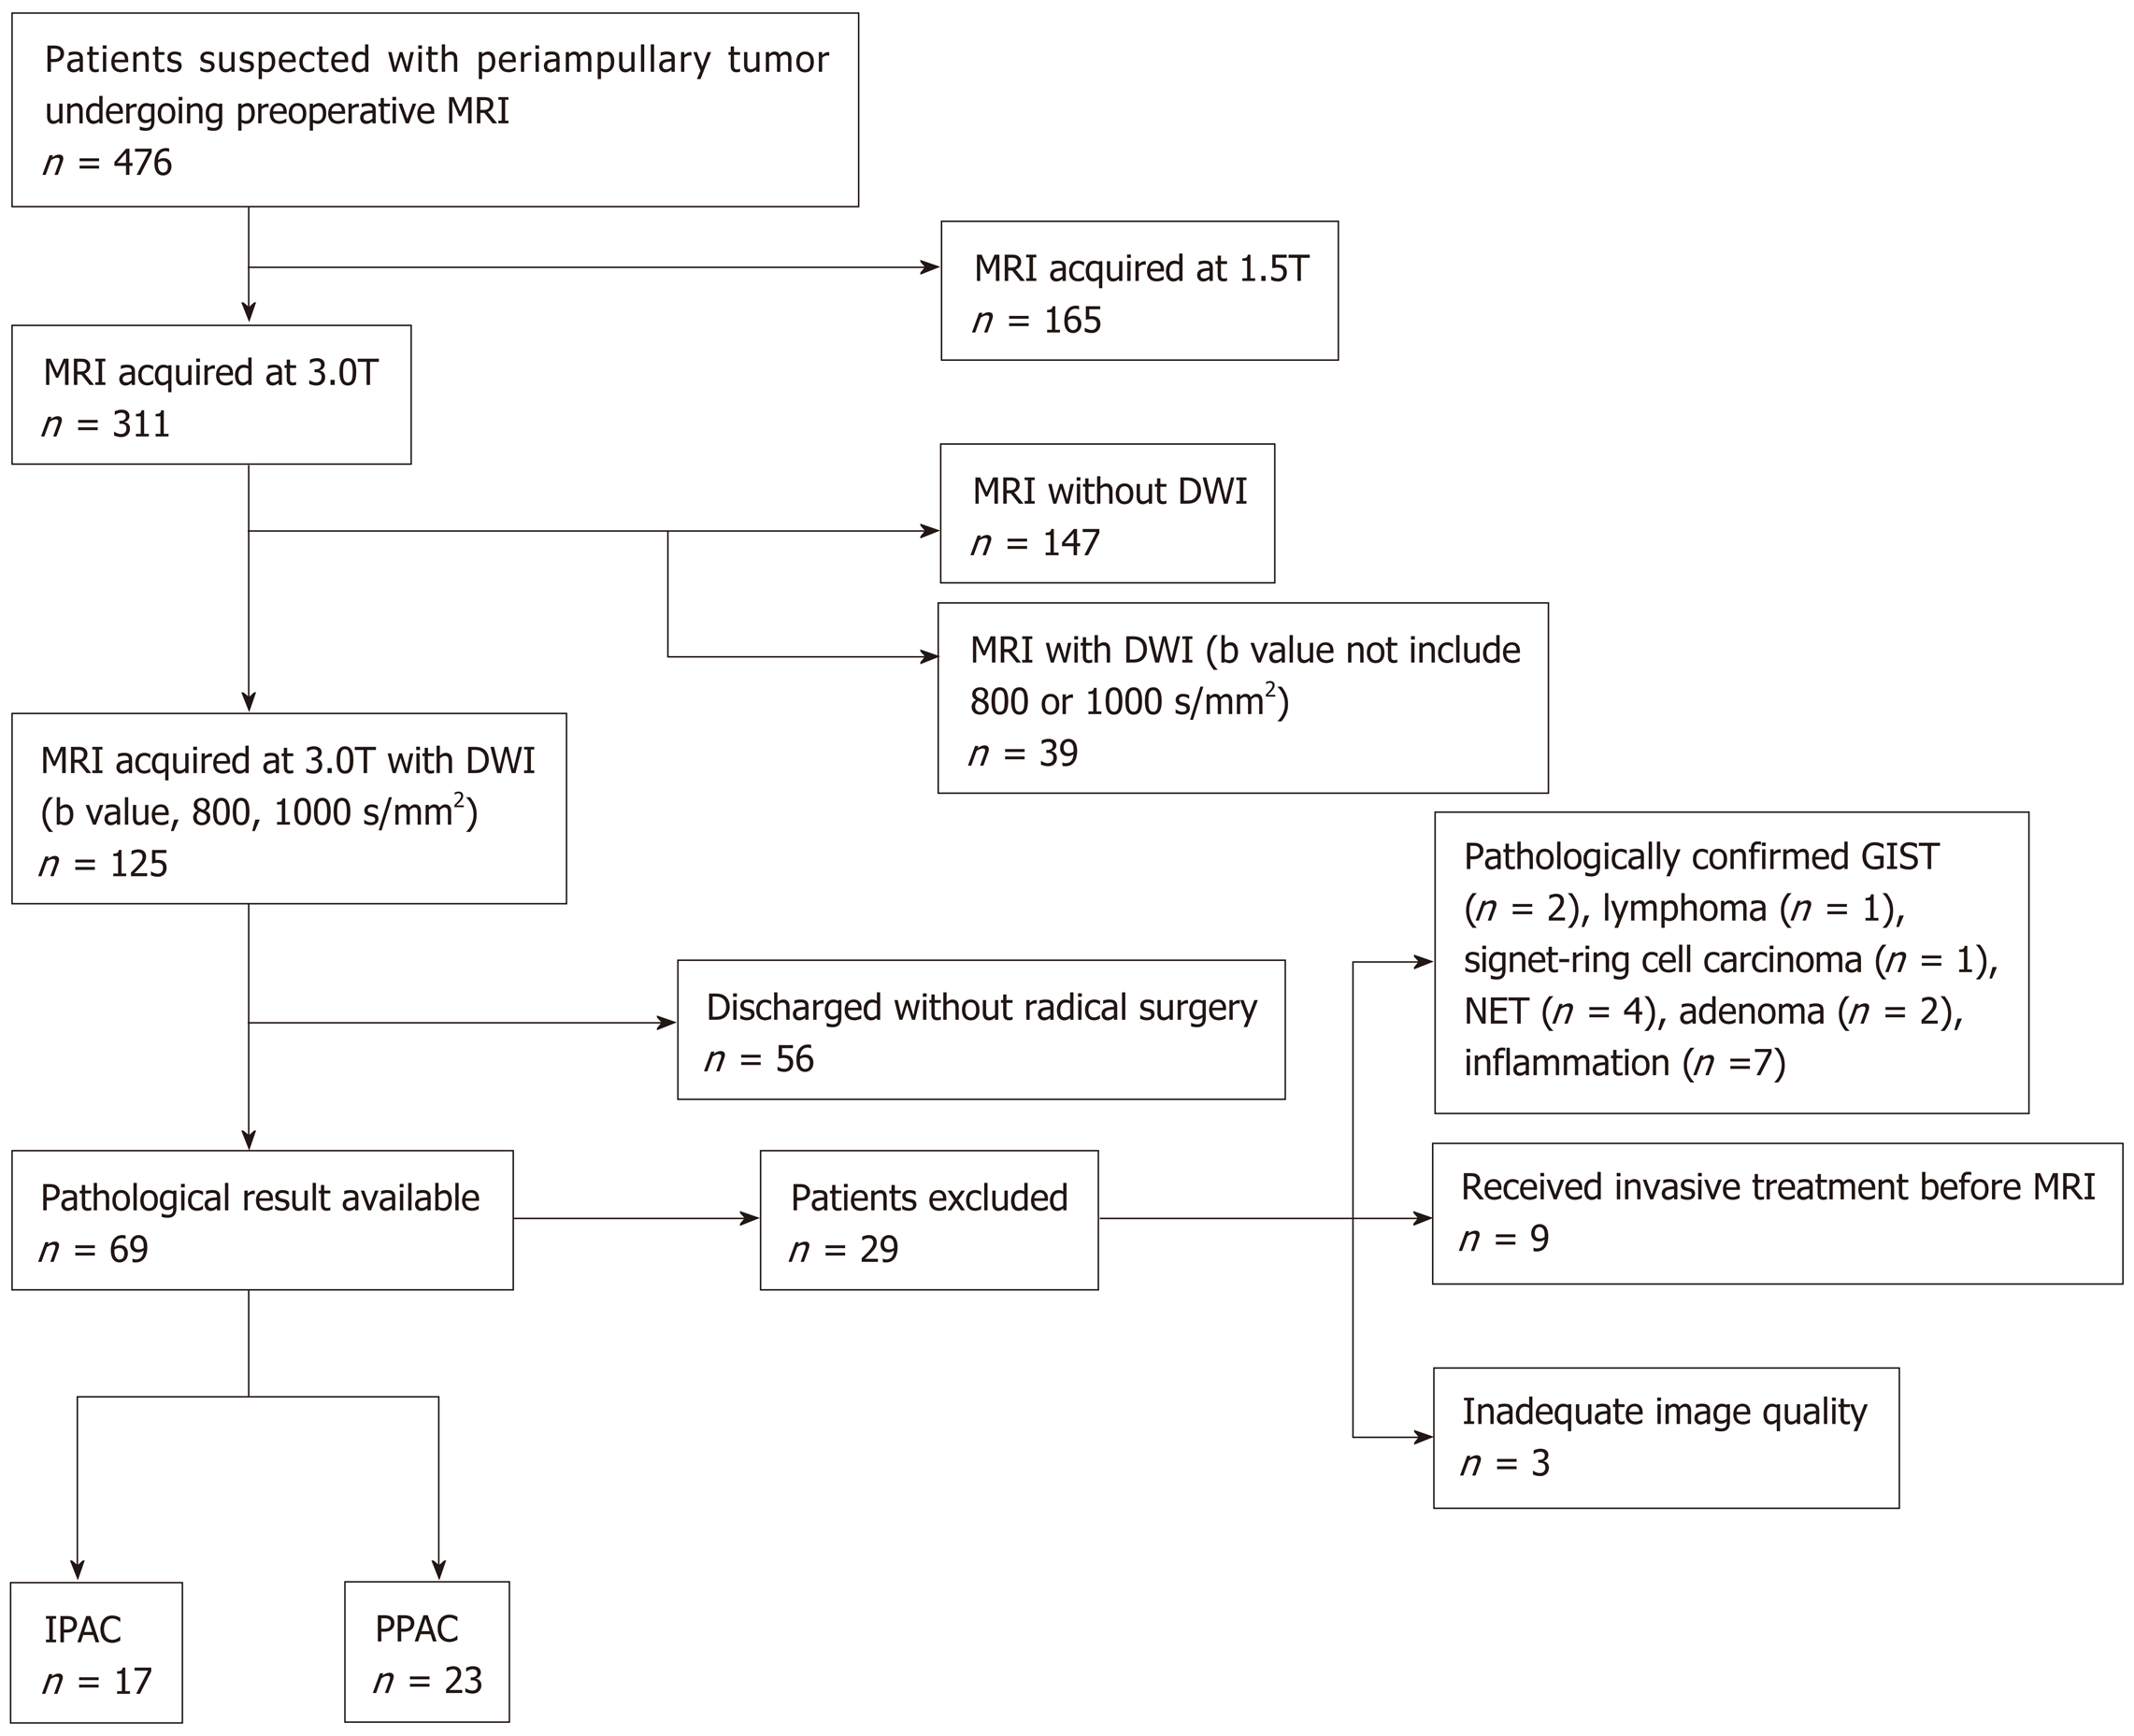
Figure 1 Flowchart of the study cohort.
MRI: Magnetic resonance imaging; DWI: Diffusion-weighted imaging; IPAC: Intestinal-typeperiampullary adenocarcinoma; PPAC: Pancreatobiliary-type periampullary adenocarcinoma; GIST: Gastric gastrointestinal stromal tumor; NET: Neuroendocrine tumor.
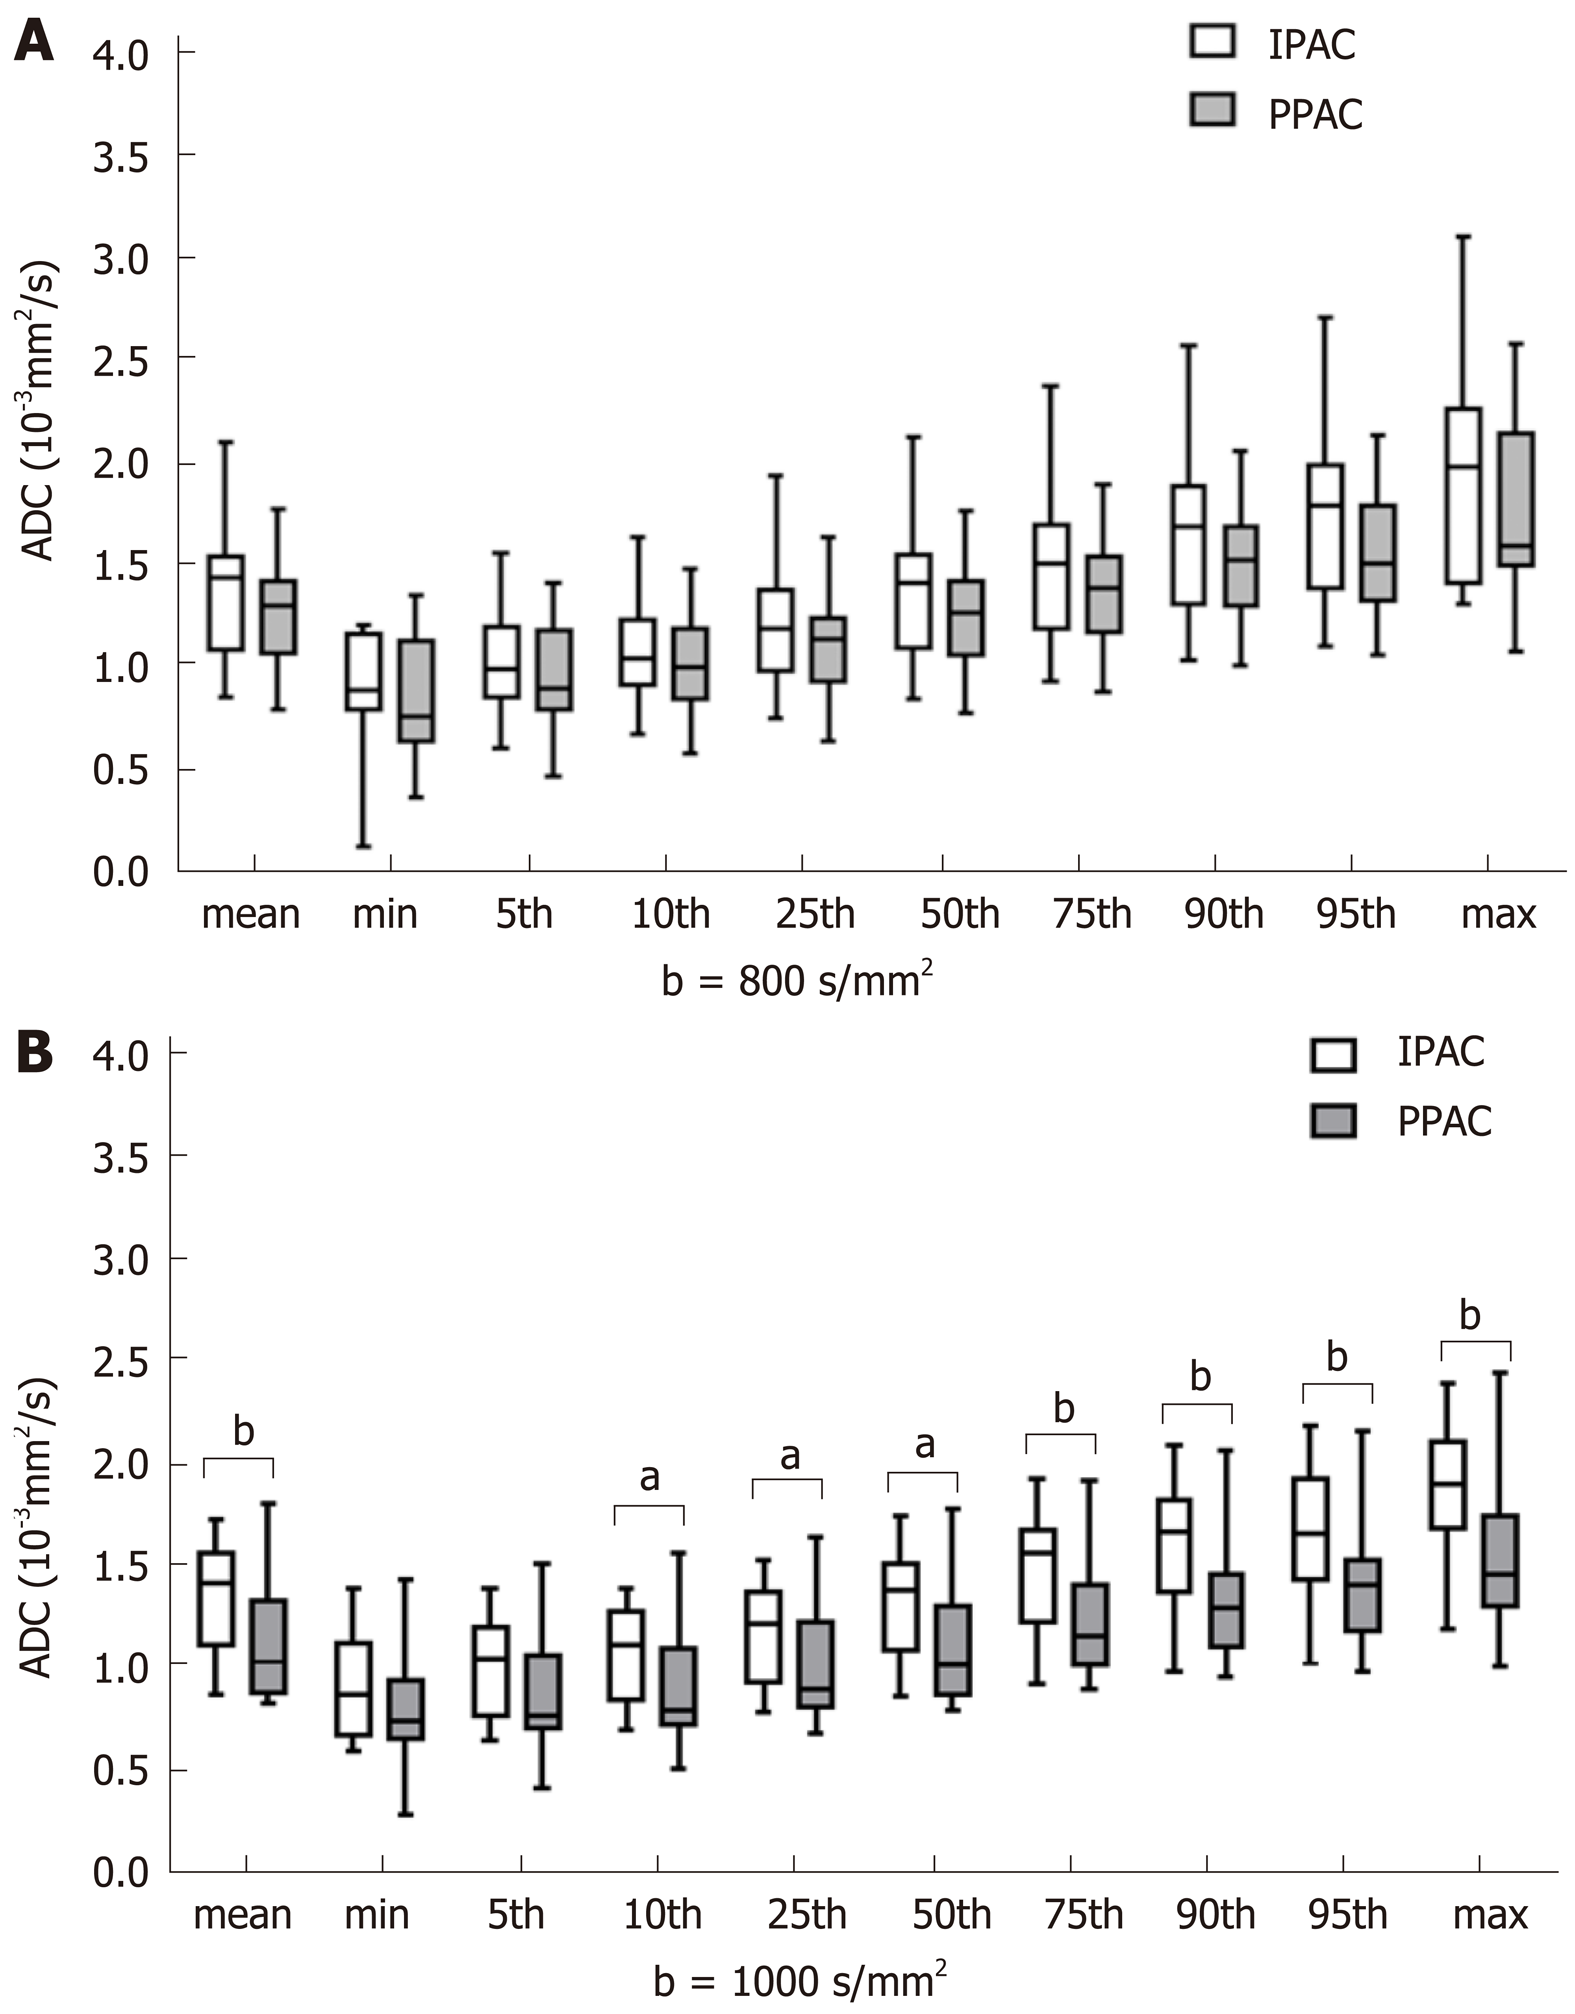
Figure 2 Box plots of the histogram parameters.
aP < 0.05, bP < 0.01. IPAC: Intestinal-type periampullary adenocarcinoma; PPAC: Pancreatobiliary-type periampullary adenocarcinoma; ADC: Apparent diffusion coefficient.
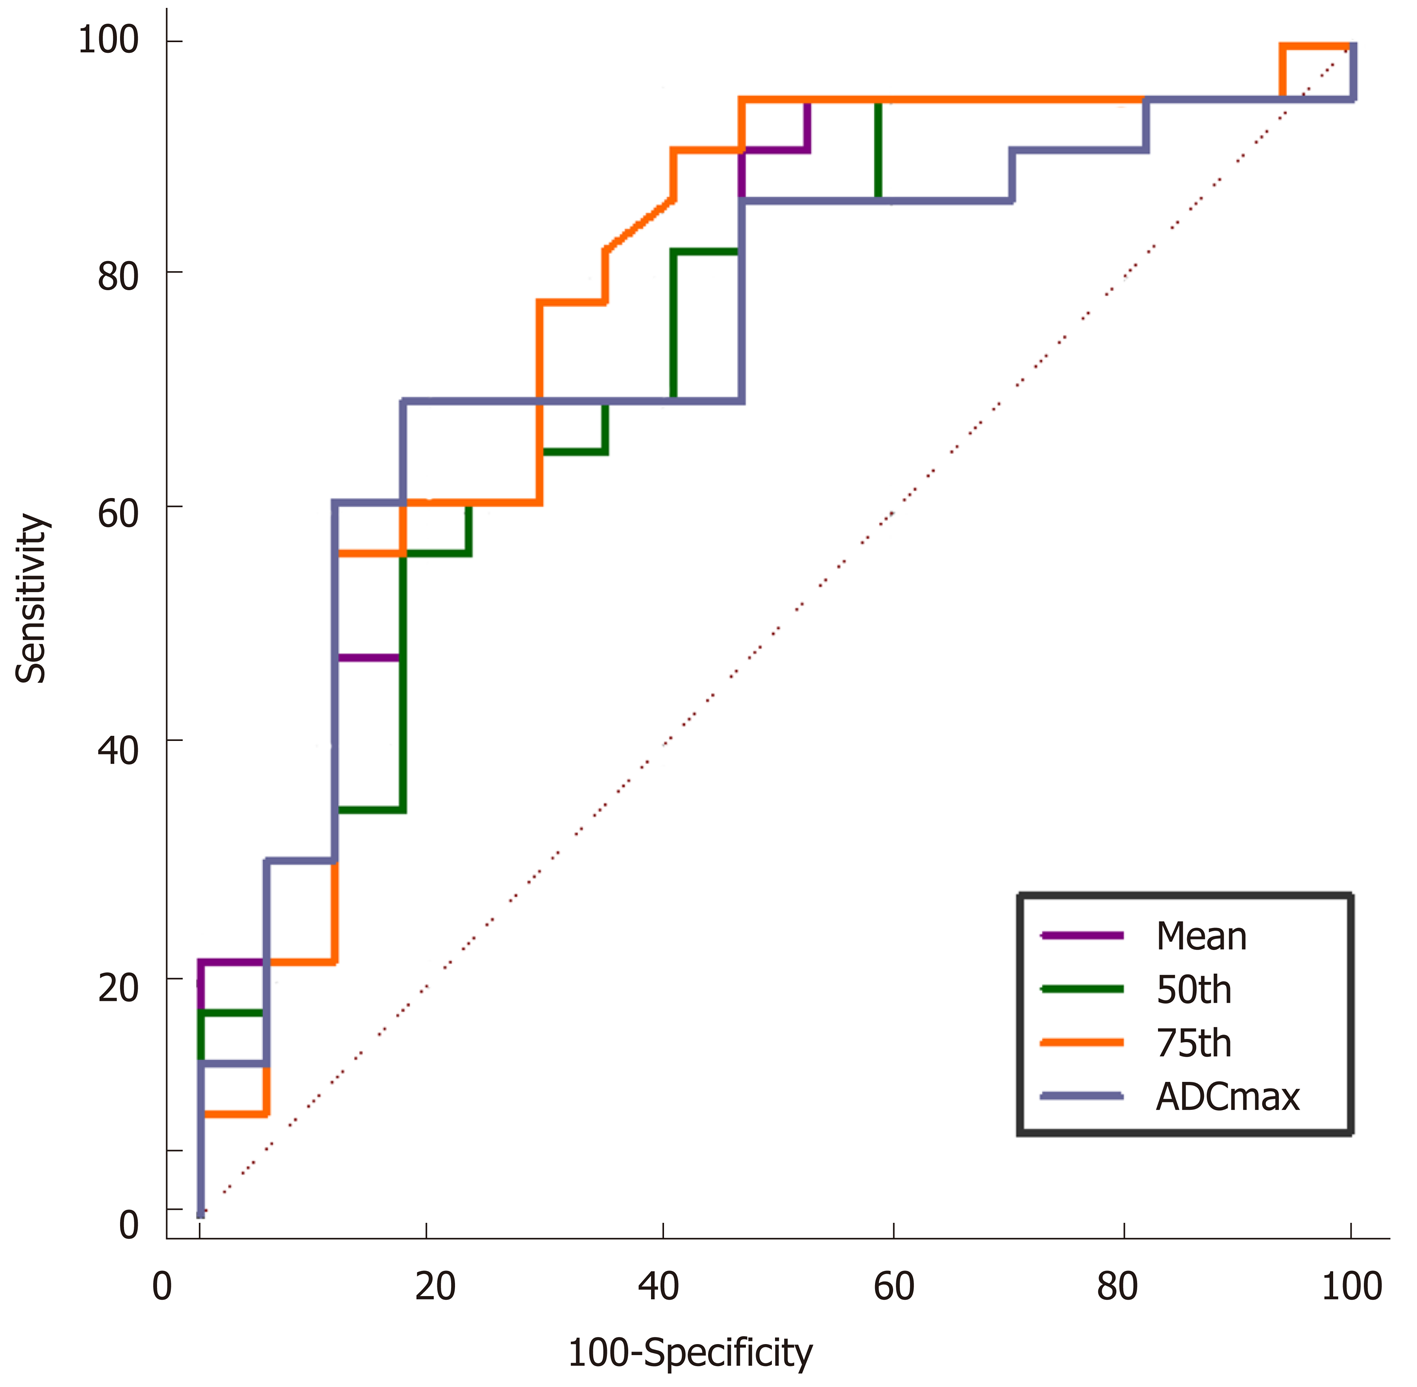
Figure 3 Receiver operating characteristic curves for the volumetric histogram parameters in differentiating intestinal-type periampullary adenocarcinoma from pancreatobiliary-type periampullary adenocarcinoma.
ADC: Apparent diffusion coefficient.
Figure 4 A 61-year-old man with intestinal-type periampullary adenocarcinoma.
A: T2-weighted image; B: Corresponding diffusion-weighted image reconstruction of apparent diffusion coefficient (ADC) values (b-value = 1000 s/mm2, ADC values are given in units of ×10-3 mm2/s); C: Haematoxylin and eosin staining of the lesion (original magnification, ×40).
Figure 5 A 49-year-old man with pancreatobiliary-type periampullary adenocarcinoma.
A: T2-weighted image; B: Corresponding diffusion-weighted image reconstruction of apparent diffusion coefficient (ADC) values (b-value = 1000 s/mm2, ADC values are given in units of ×10-3 mm2/s); C: Haematoxylin and eosin staining of the lesion (original magnification, ×40).
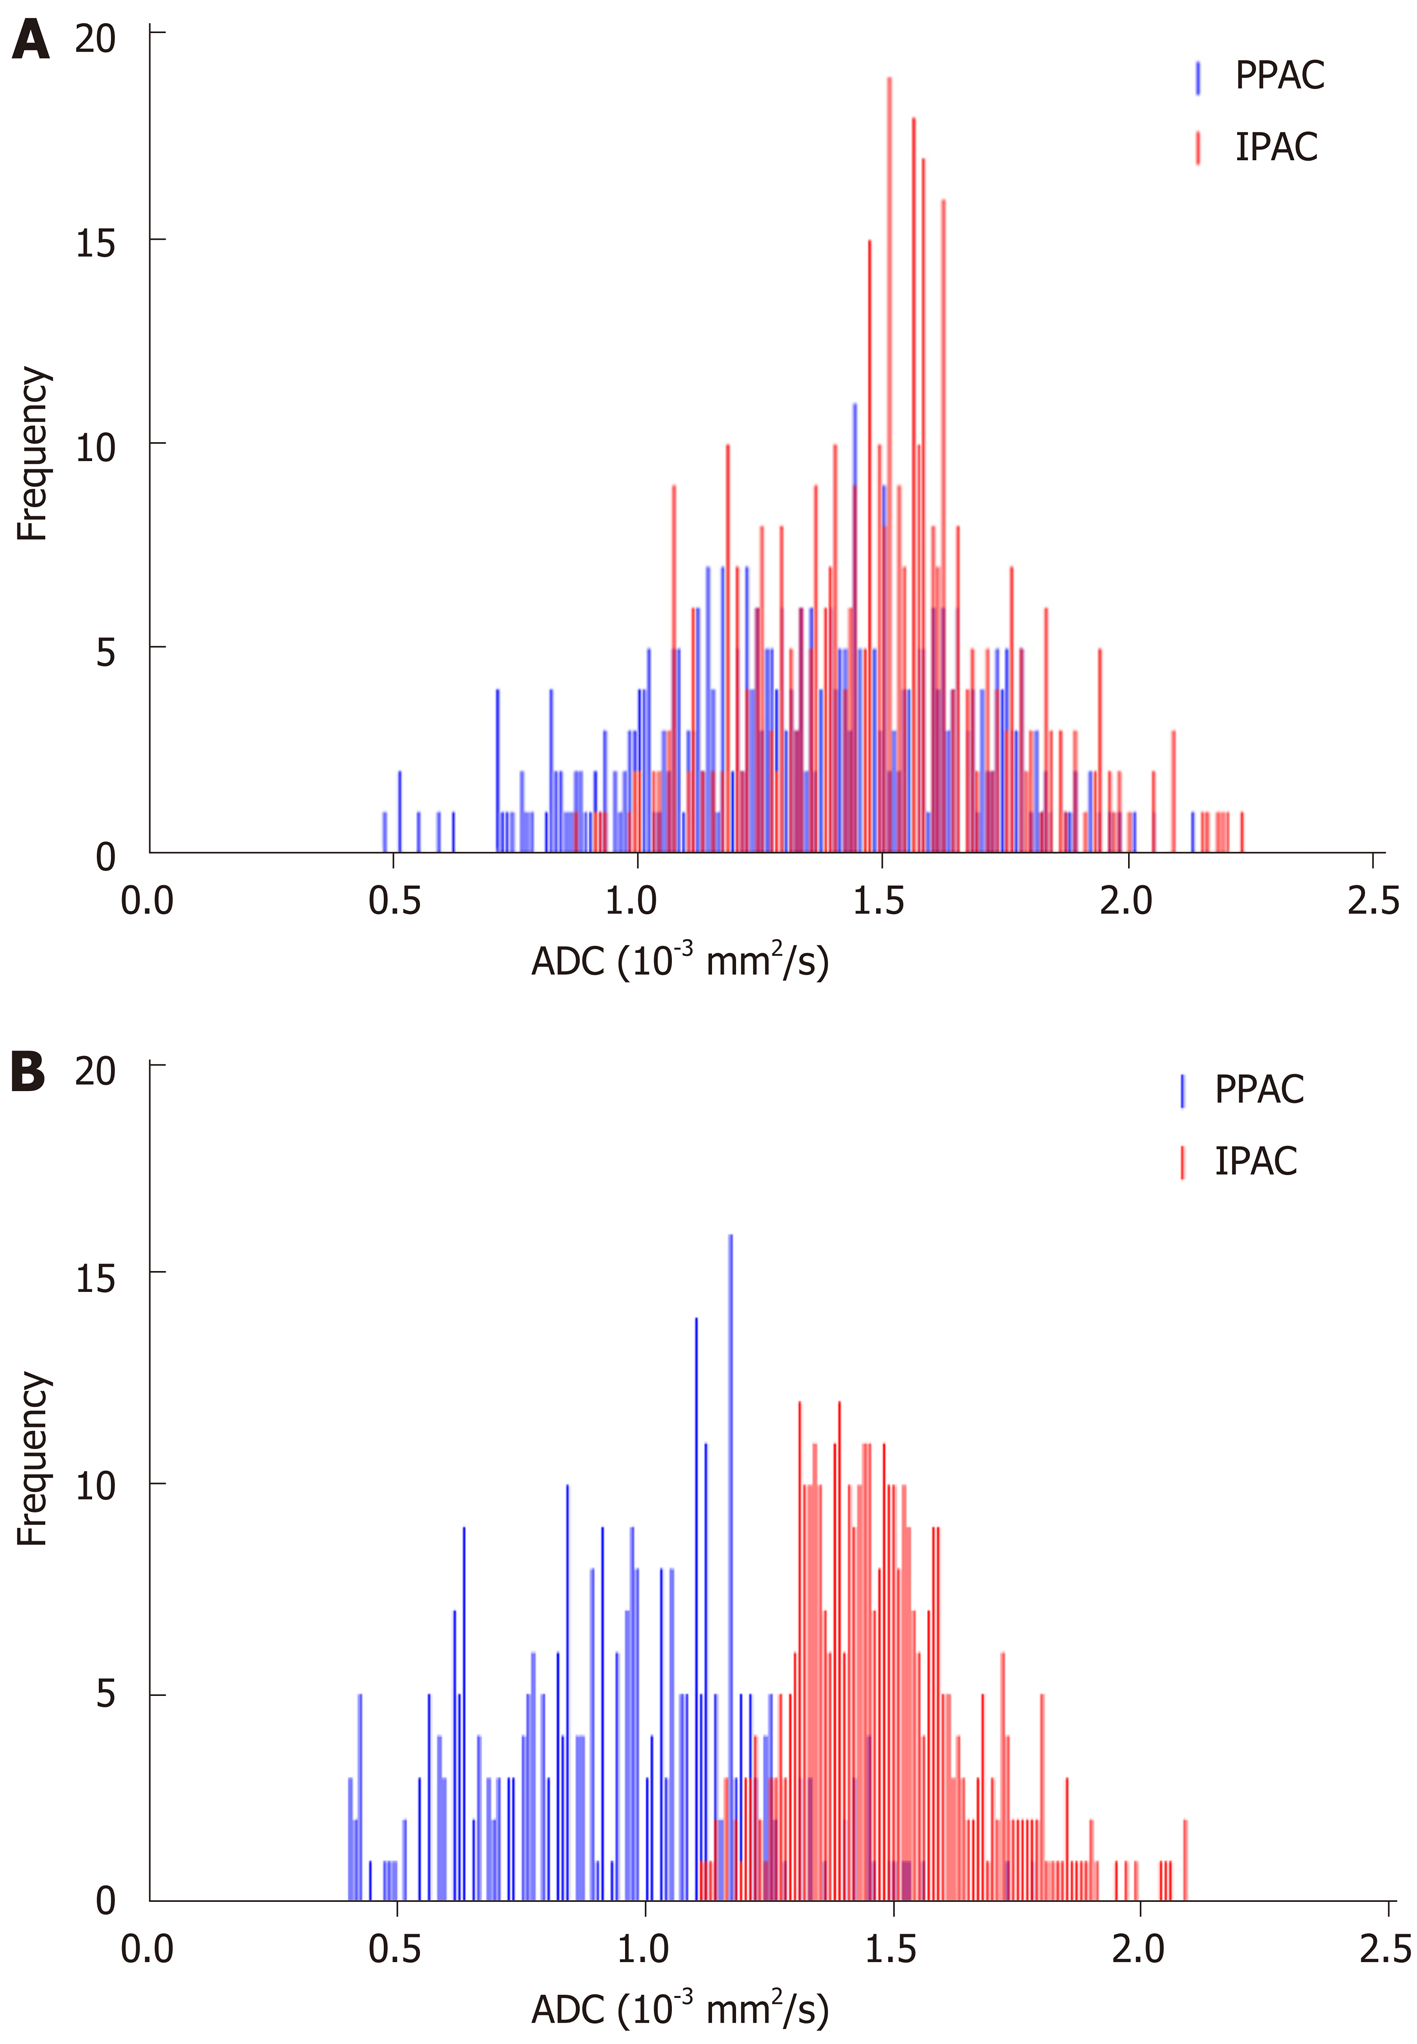
Figure 6 Corresponding volumetric histograms of intestinal-type periampullary adenocarcinoma and pancreatobiliary-type periampullary adenocarcinoma.
A: Corresponding volumetric histogram (b800) shows the overlap distribution of ADC values of IPAC and PPAC. For the PPAC, the mean, 50th percentile, 75th percentile, and ADCmax were 1.35, 1.38, 1.55, and 2.14 × 10⁻³ mm2/s, respectively. For the IPAC, the mean, 50th percentile, 75th percentile, and ADCmax were 1.52, 1.53, 1.63, and 2.26 × 10⁻³ mm2/s, respectively; B: Corresponding volumetric histogram (b1000) shows a higher ADC distribution range in the IPAC. For the PPAC, the mean, 50th percentile, 75th percentile, and ADCmax were 0.96, 0.98, 1.14, and 1.80 ×10⁻³ mm2/s, respectively. For the IPAC, the mean, 50th percentile, 75th percentile, and ADCmax were 1.49, 1.47, 1.58, and 2.10 ×10⁻³ mm2/s, respectively. IPAC: Intestinal-type periampullary adenocarcinoma; PPAC: Pancreatobiliary-type periampullary adenocarcinoma; ADC: Apparent diffusion coefficient.
- Citation: Lu JY, Yu H, Zou XL, Li Z, Hu XM, Shen YQ, Hu DY. Apparent diffusion coefficient-based histogram analysis differentiates histological subtypes of periampullary adenocarcinoma. World J Gastroenterol 2019; 25(40): 6116-6128
- URL: https://www.wjgnet.com/1007-9327/full/v25/i40/6116.htm
- DOI: https://dx.doi.org/10.3748/wjg.v25.i40.6116


