Copyright
©The Author(s) 2019.
World J Gastroenterol. Aug 28, 2019; 25(32): 4749-4763
Published online Aug 28, 2019. doi: 10.3748/wjg.v25.i32.4749
Published online Aug 28, 2019. doi: 10.3748/wjg.v25.i32.4749
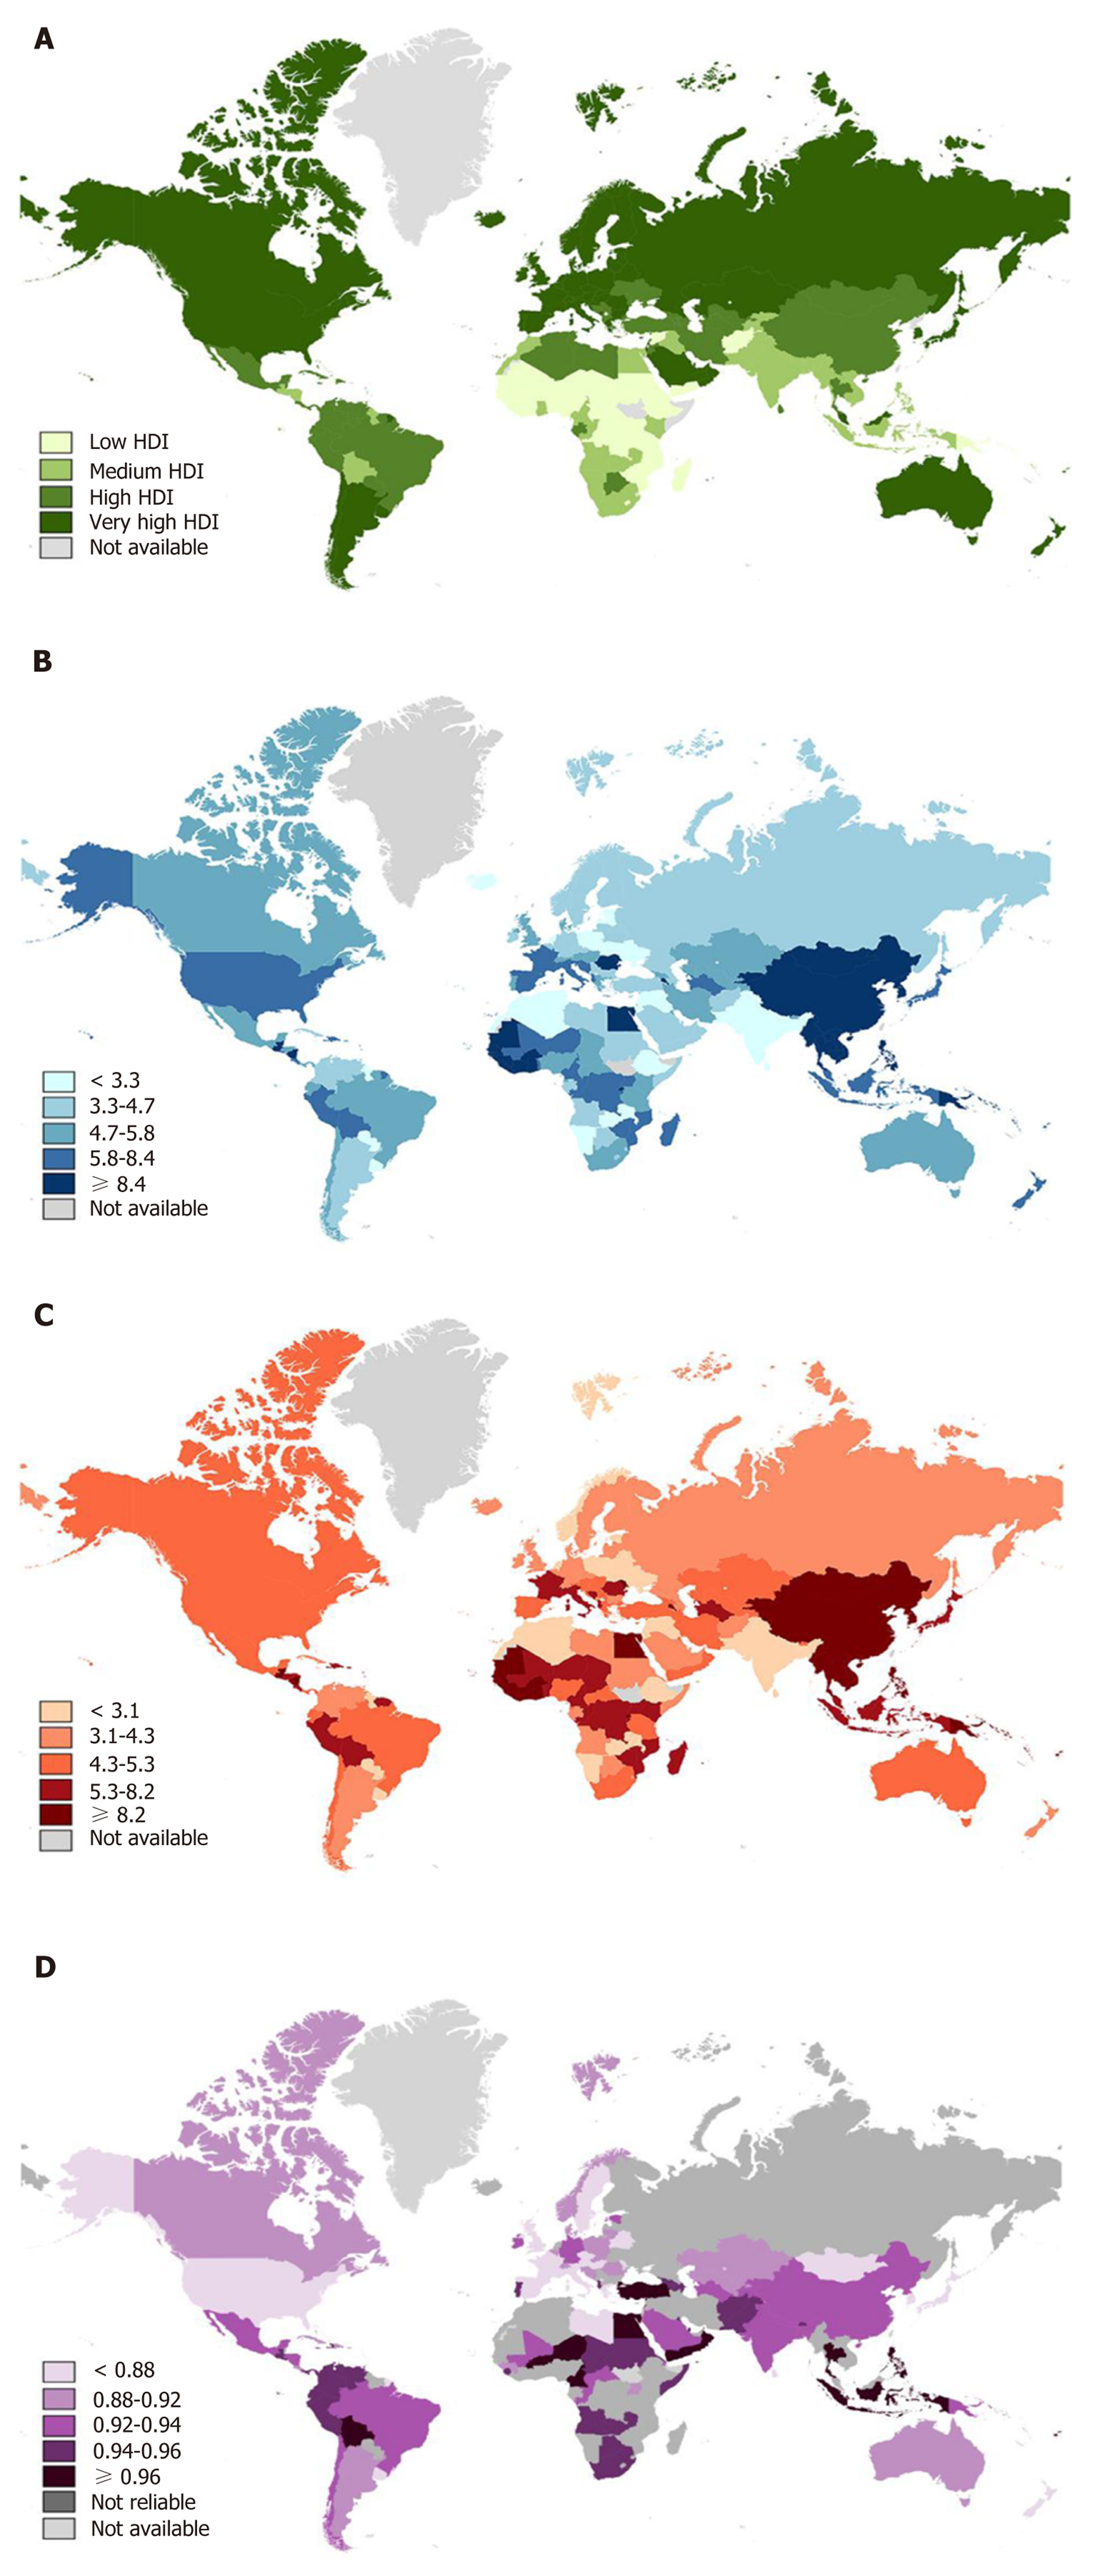
Figure 1 Worldwide distribution of Human Development Index and liver cancer burden in 2018.
A total of 174 countries were classified into four tiers according to different levels of the following: A: Human Development Index (green); B: Age-standardized incidence (blue); C: Age-standardized mortality (red) rates per 100000 population, indicated in a gradient color scale; D: Calculated mortality-to-incidence ratio results, indicated in purple-gradient colors. Countries with data unavailable (light gray) or unreliable (dark gray) are denoted. HDI: Human Development Index.
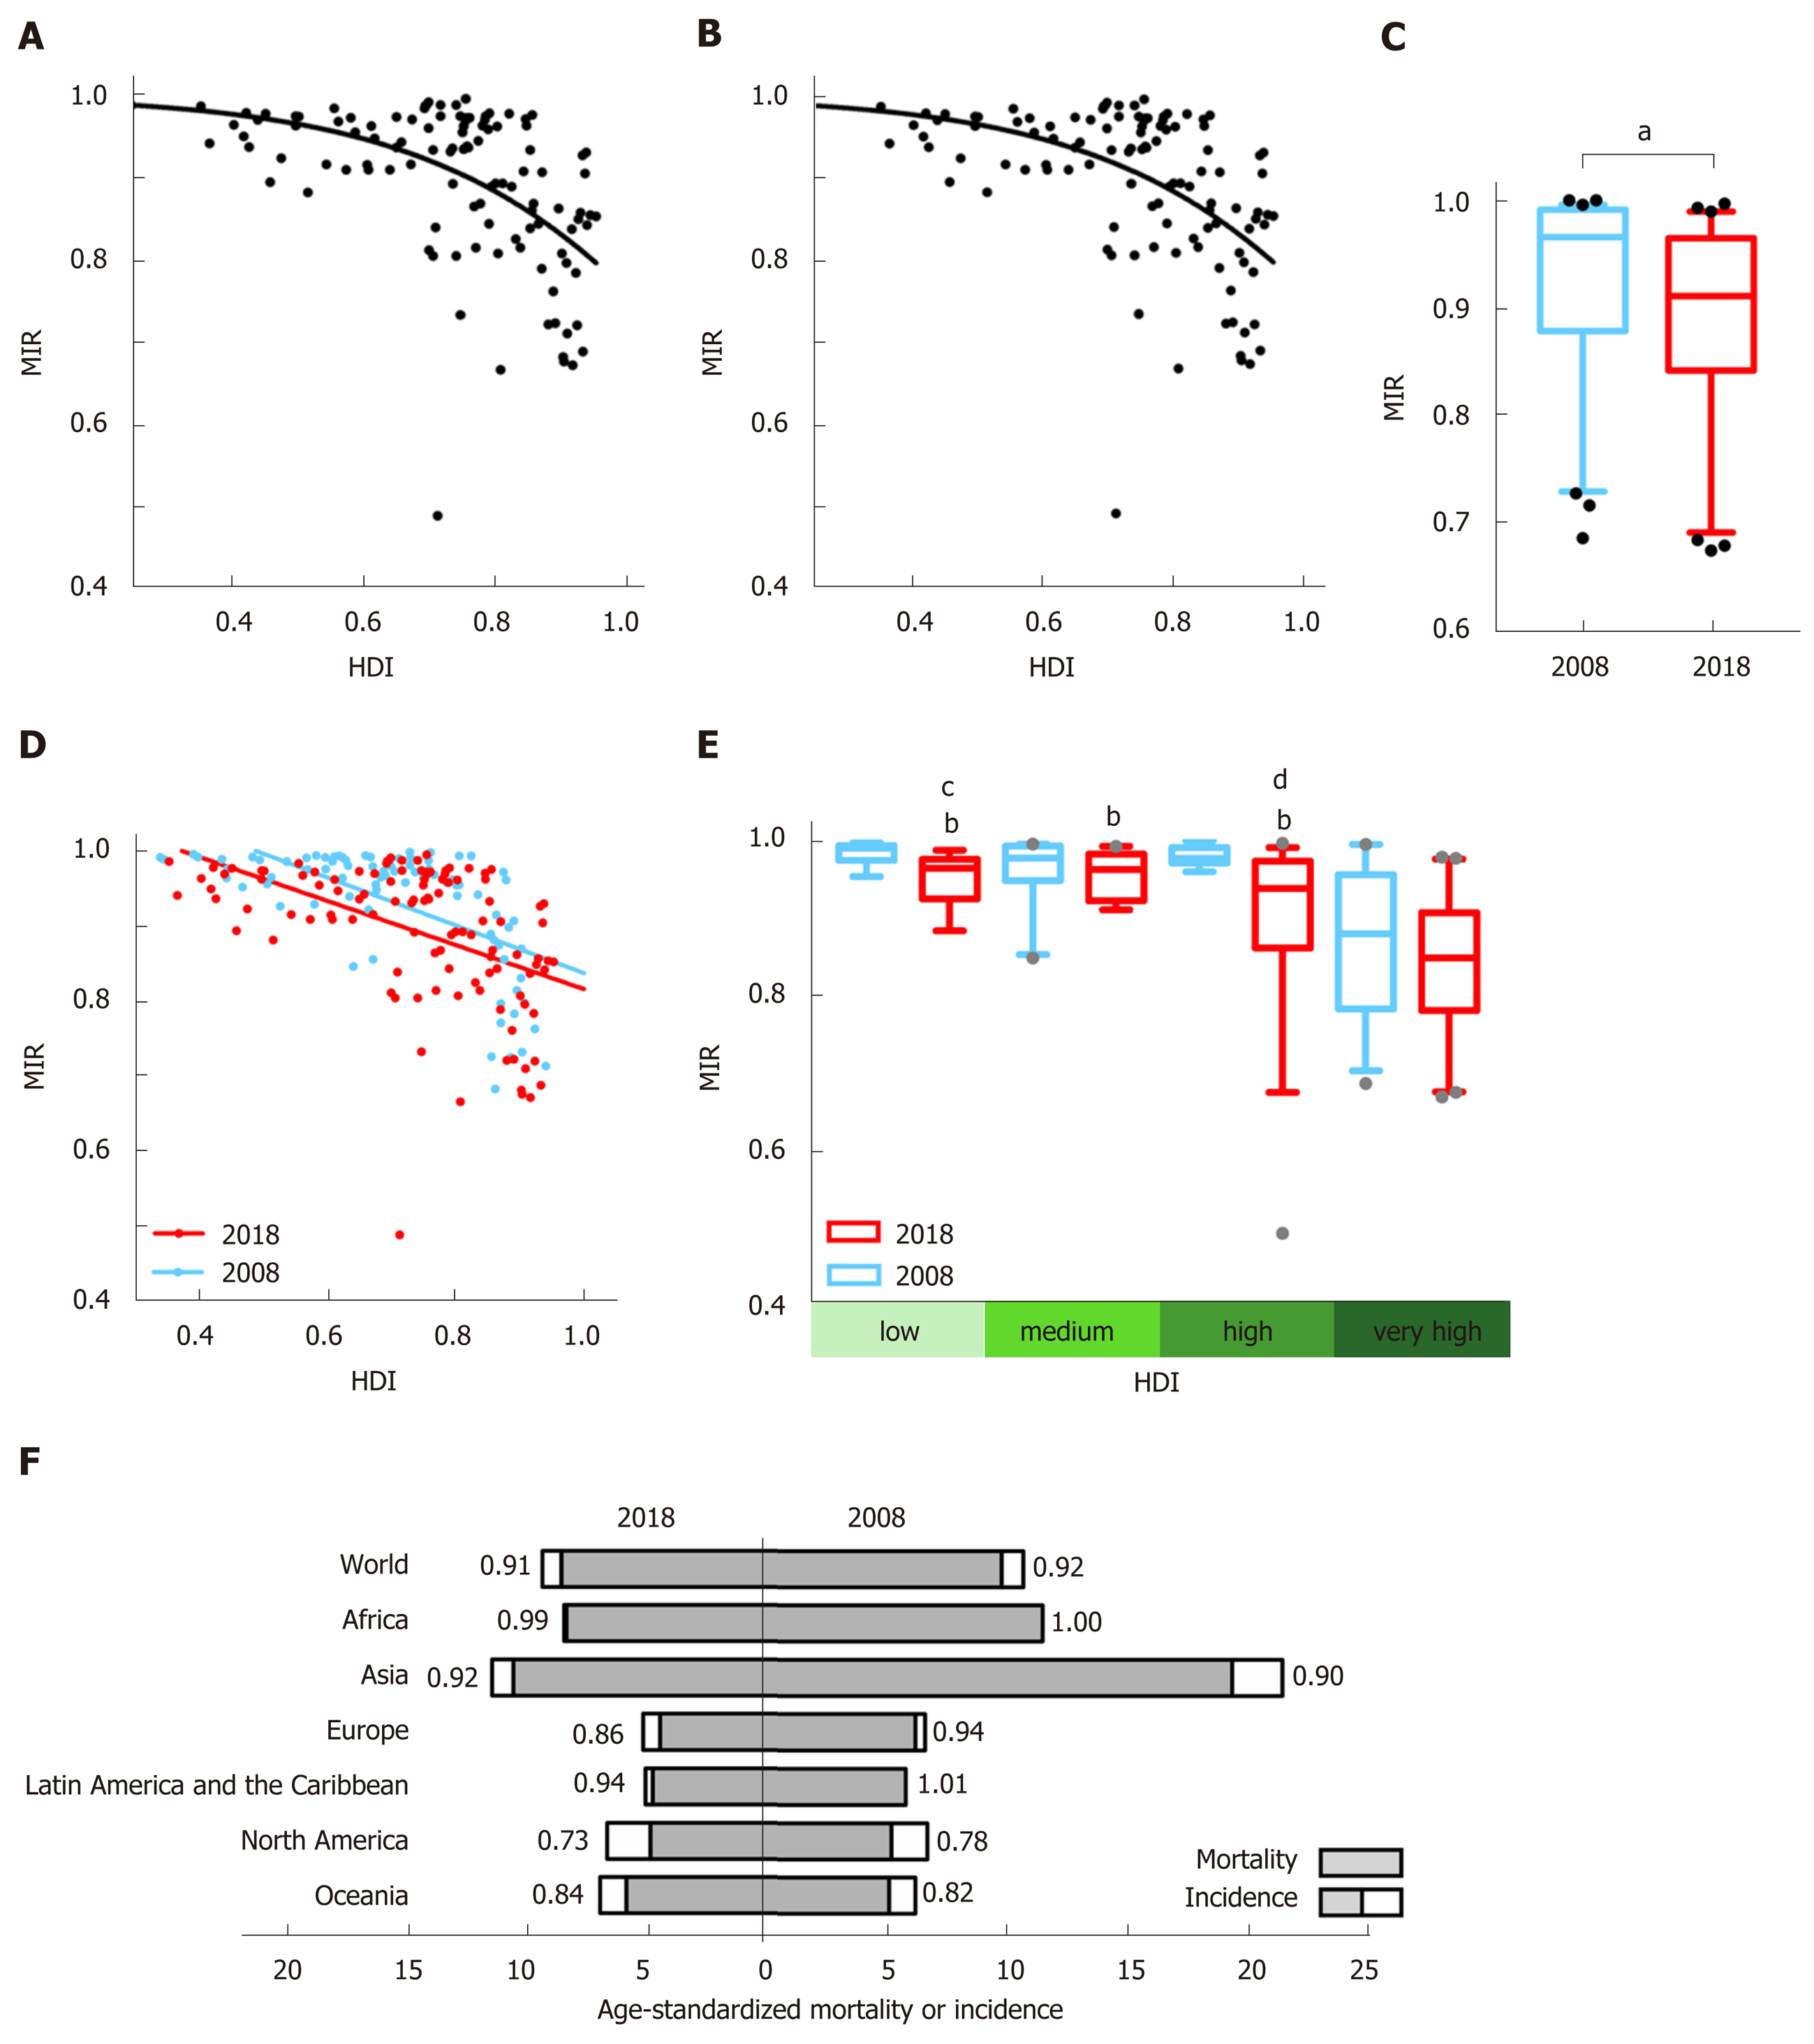
Figure 2 Correlation between Human Development Index and mortality-to-incidence ratio and its transition from 2008 to 2018.
The correlation of liver cancer mortality-to-incidence ratios (MIRs) with national Human Development Indexes (HDIs) with the best-fit lines by modified nonlinear regression (“dose-to-response” model) in A: 2018 (slope = -1.868, HDI50 = 1.27, R2 = 0.261); B: 2008 (slope = -4.989, HDI50 = 1.03, R2 = 0.592); C: Significant reduction in overall MIRs in 64 overlapping countries from 2008 (orange) to 2018 (red). aP < 0.0001, Weighted Chi-square test; D: Transition of the correlation patterns of liver cancer MIR with national HDI from 2008 (orange, r = -0.617, P < 0.0001) to 2018 (red, r = -0.548, P < 0.0001), showing a declining tendency of MIRs within the decade; E: MIRs of liver cancer in the four HDI groups, with significant differences among the very high, high, medium, and low groups (indicated in green-gradient colors) and a decreasing tendency in each specific group between 2008 (orange) and 2018 (red). bP < 0.001, vs very-high-HDI countries in 2018, one-way ANOVA followed by Tukey-Kramer post hoc test. The statistical significance among countries in 2008 is not indicated. cP < 0.001, 2008 vs 2018 in the low-HDI group; dP < 0.0001, 2008 vs 2018 in the high-HDI group, paired t-test; F: Regional age-standardized mortality (gray) and incidence (white plus gray) rates per 100000 individuals for liver cancer in 2018 (on the left) and 2008 (on the right), with MIR values denoted. HDI: Human Development Index; MIR: Mortality-to-incidence ratio.
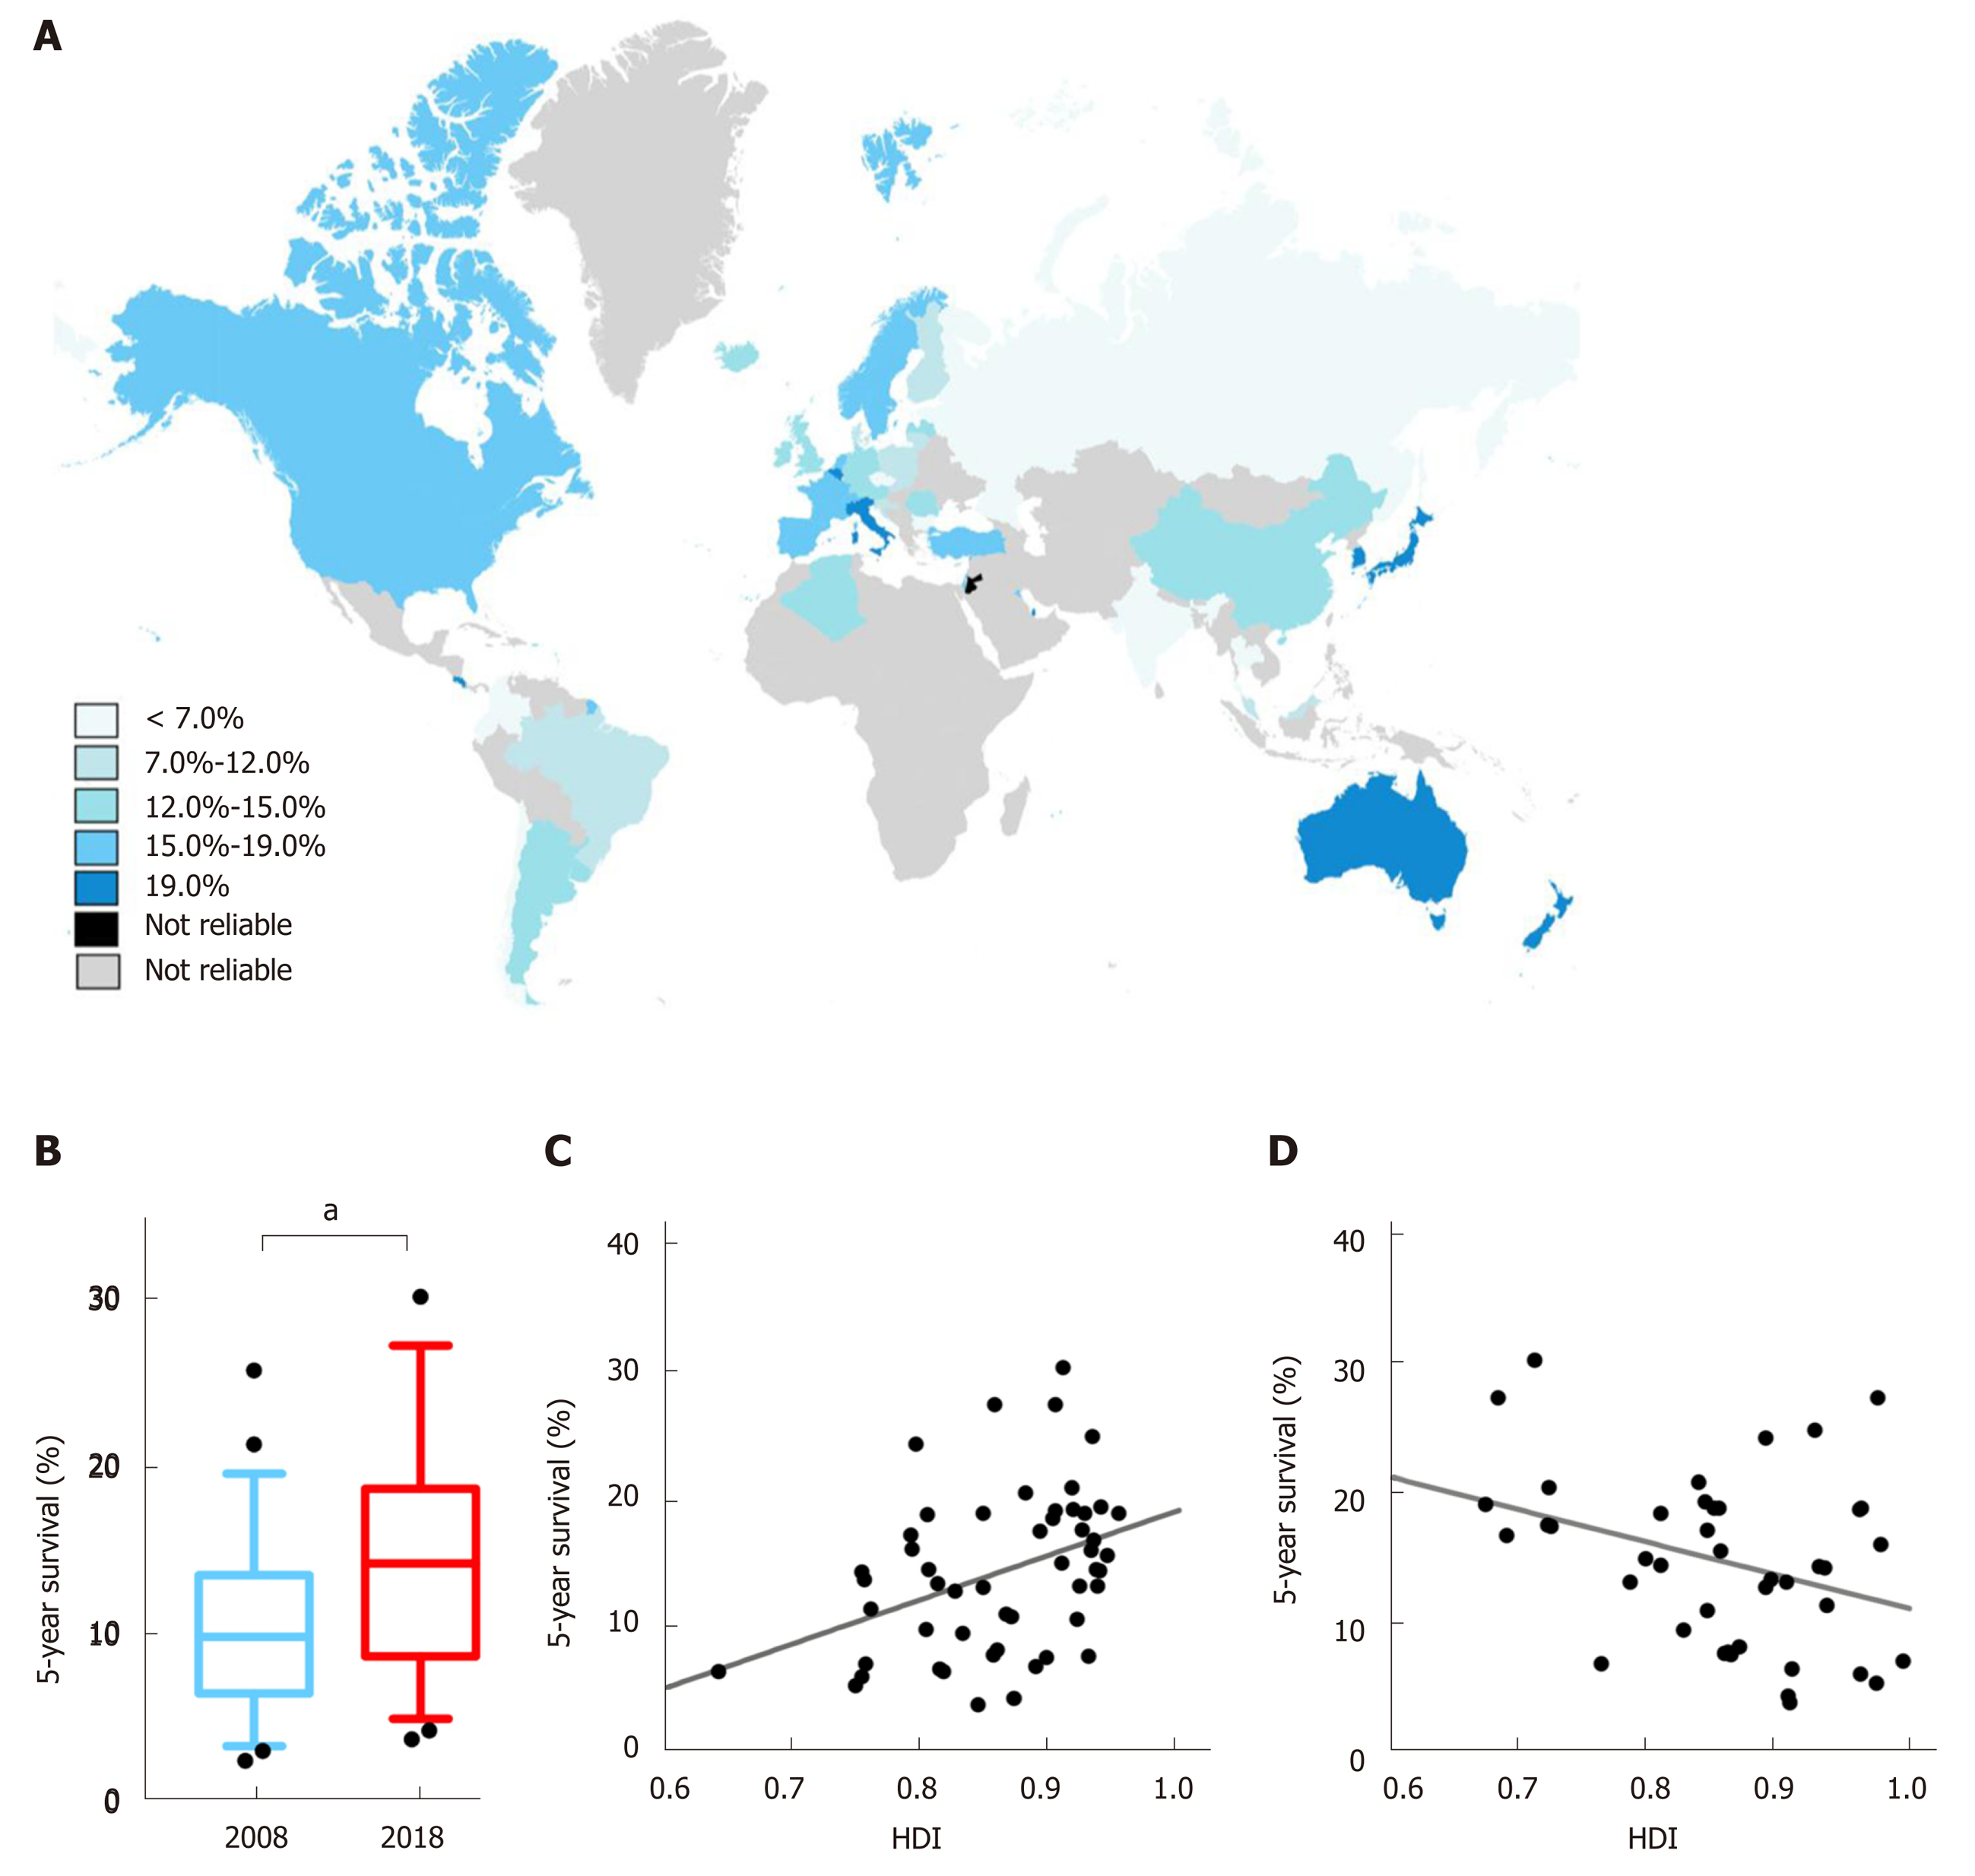
Figure 3 Distributions of liver cancer survival and its correlation with Human Development Index values and mortality-to-incidence ratio.
A: Distribution of regional estimated 5-year net survival for patients with liver cancer in 2018, indicated in blue-gradient colors; B: Comparisons of worldwide liver cancer survival between 2008 and 2018. aP < 0.001, 2018 (sky blue) vs 2008 (dark blue); C: A positive correlation pattern between the survival of the patients diagnosed in 2010-2014 and the Human Development Index value in 2018 (r = 0.408, P = 0.0027); D: Correlation between national mortality-to-incidence ratio and liver cancer survival in 2018 (r = -0.346, P = 0.0278). HDI: Human Development Index; MIR: Mortality-to-incidence ratio.
- Citation: Shao SY, Hu QD, Wang M, Zhao XY, Wu WT, Huang JM, Liang TB. Impact of national Human Development Index on liver cancer outcomes: Transition from 2008 to 2018. World J Gastroenterol 2019; 25(32): 4749-4763
- URL: https://www.wjgnet.com/1007-9327/full/v25/i32/4749.htm
- DOI: https://dx.doi.org/10.3748/wjg.v25.i32.4749


