Copyright
©The Author(s) 2019.
World J Gastroenterol. Aug 28, 2019; 25(32): 4749-4763
Published online Aug 28, 2019. doi: 10.3748/wjg.v25.i32.4749
Published online Aug 28, 2019. doi: 10.3748/wjg.v25.i32.4749
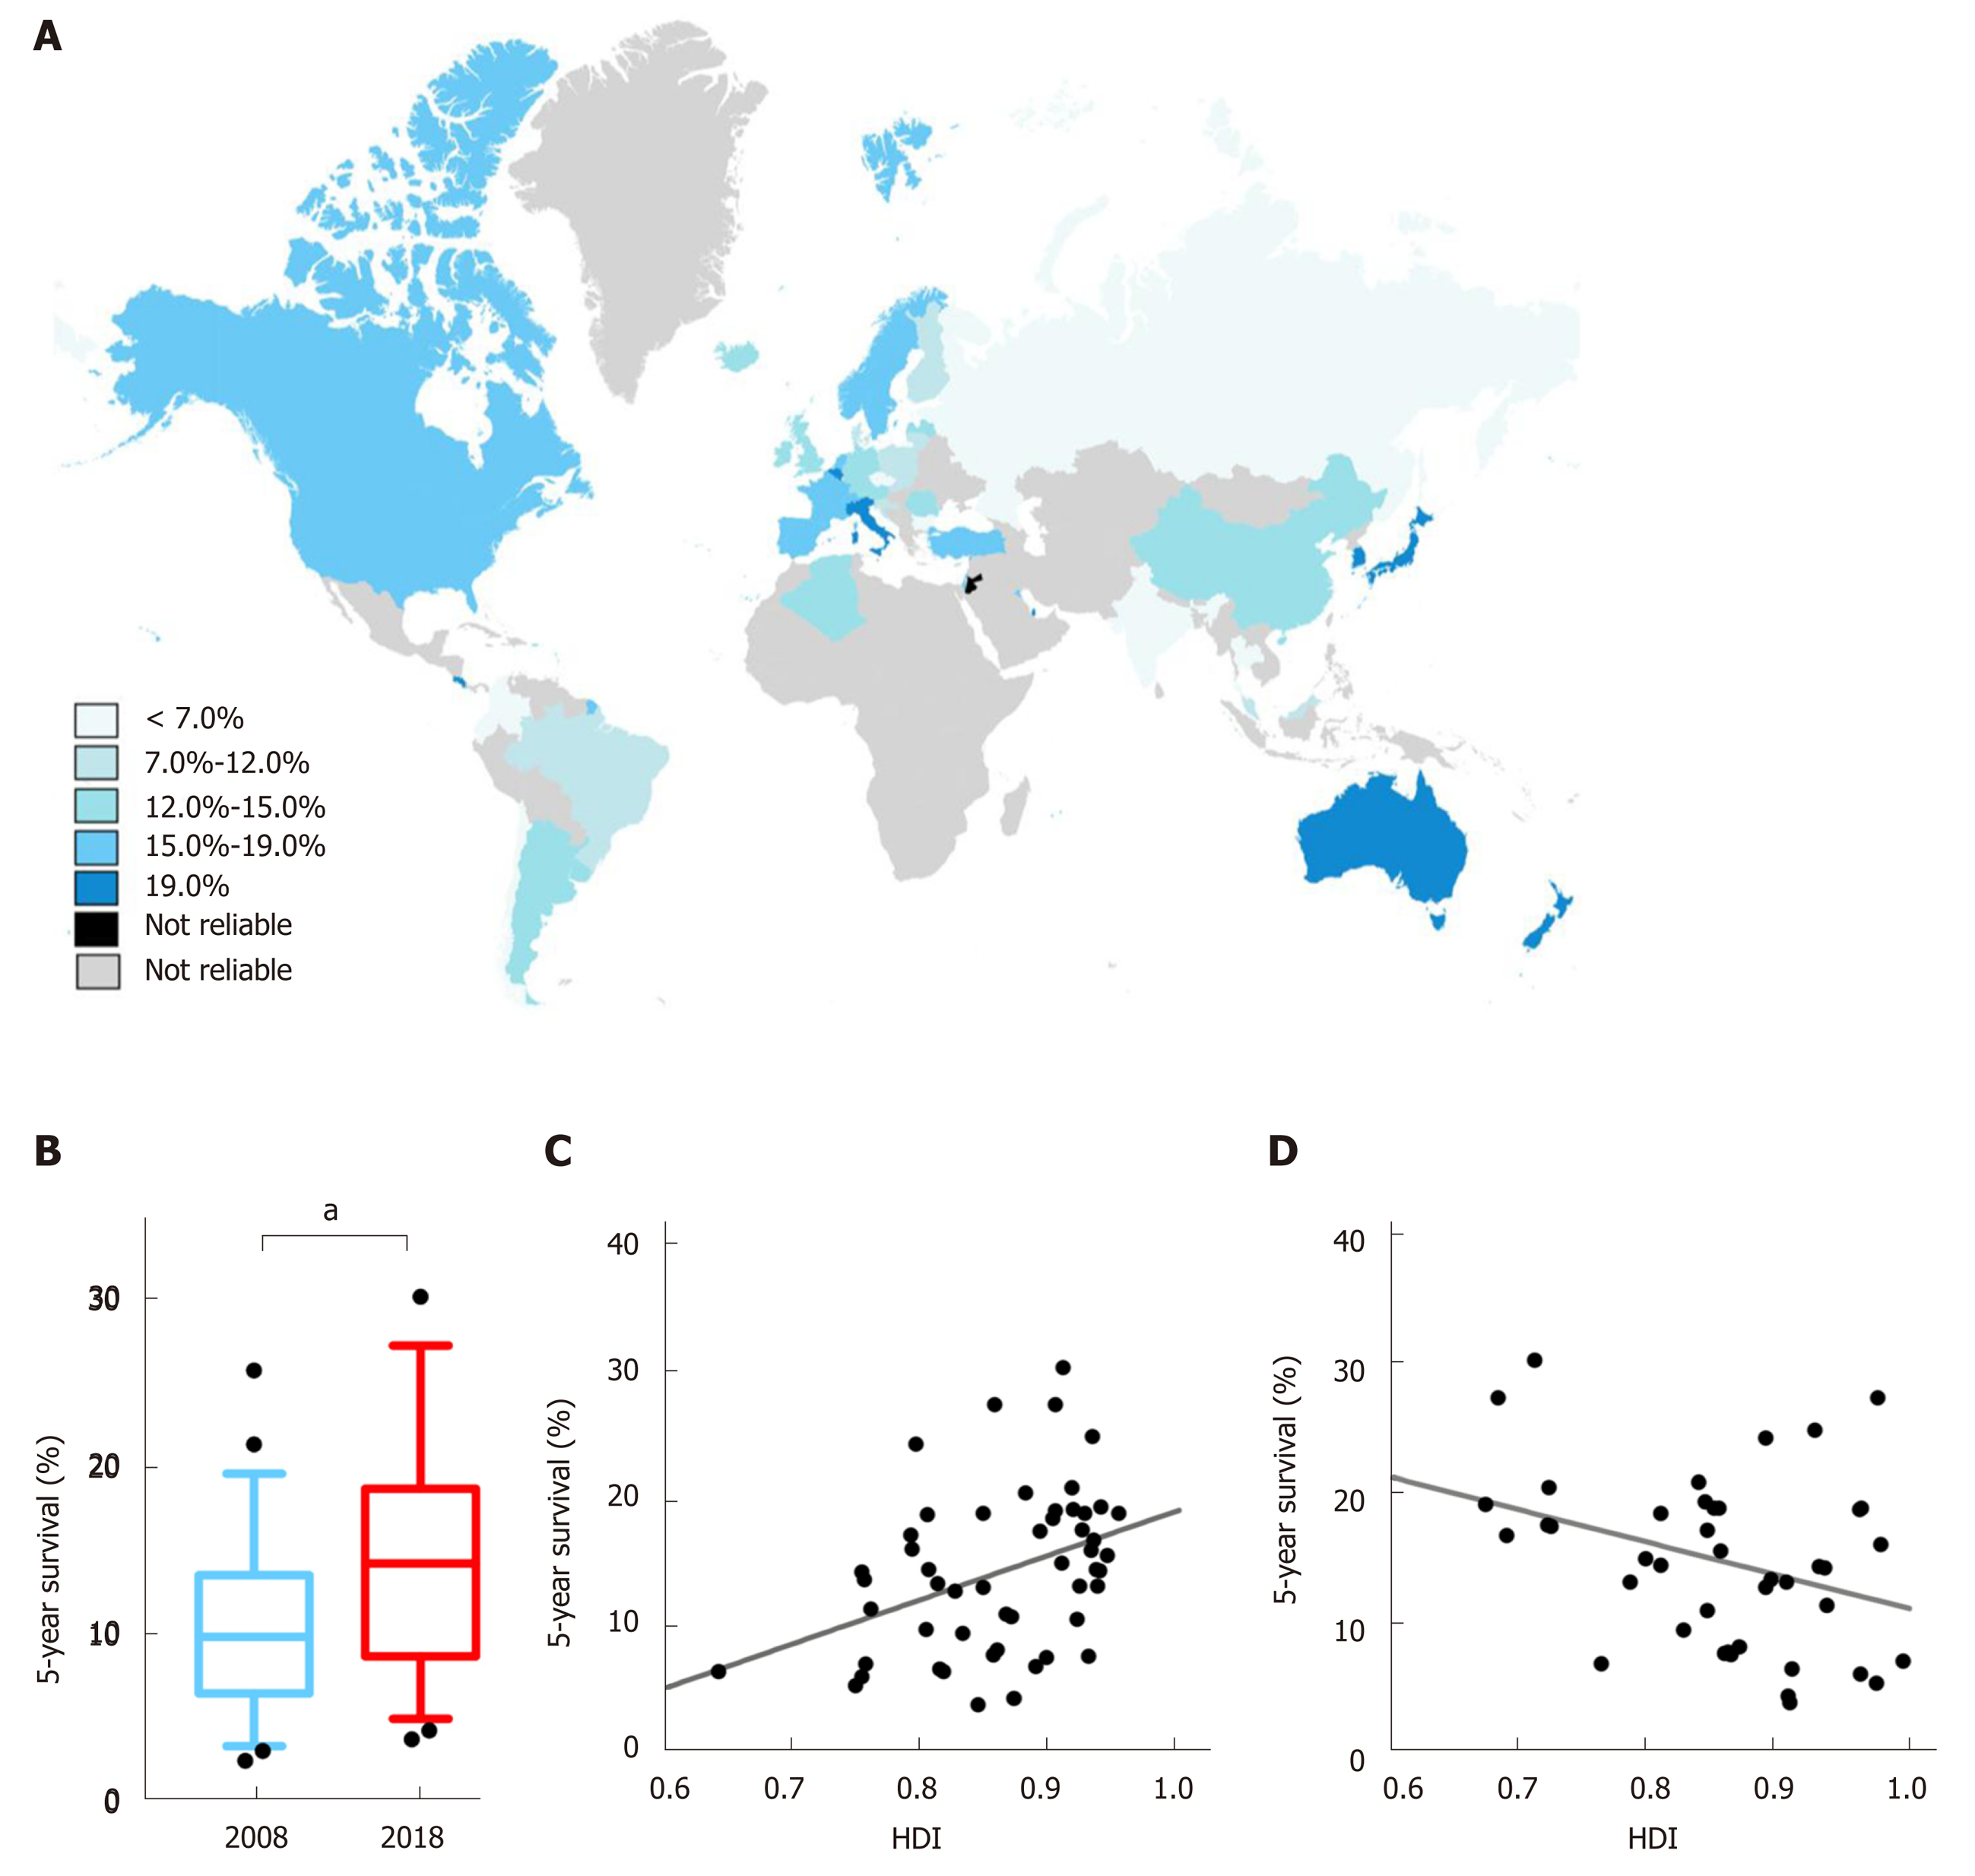
Figure 3 Distributions of liver cancer survival and its correlation with Human Development Index values and mortality-to-incidence ratio.
A: Distribution of regional estimated 5-year net survival for patients with liver cancer in 2018, indicated in blue-gradient colors; B: Comparisons of worldwide liver cancer survival between 2008 and 2018. aP < 0.001, 2018 (sky blue) vs 2008 (dark blue); C: A positive correlation pattern between the survival of the patients diagnosed in 2010-2014 and the Human Development Index value in 2018 (r = 0.408, P = 0.0027); D: Correlation between national mortality-to-incidence ratio and liver cancer survival in 2018 (r = -0.346, P = 0.0278). HDI: Human Development Index; MIR: Mortality-to-incidence ratio.
- Citation: Shao SY, Hu QD, Wang M, Zhao XY, Wu WT, Huang JM, Liang TB. Impact of national Human Development Index on liver cancer outcomes: Transition from 2008 to 2018. World J Gastroenterol 2019; 25(32): 4749-4763
- URL: https://www.wjgnet.com/1007-9327/full/v25/i32/4749.htm
- DOI: https://dx.doi.org/10.3748/wjg.v25.i32.4749


