Copyright
©The Author(s) 2019.
World J Gastroenterol. Jul 7, 2019; 25(25): 3196-3206
Published online Jul 7, 2019. doi: 10.3748/wjg.v25.i25.3196
Published online Jul 7, 2019. doi: 10.3748/wjg.v25.i25.3196
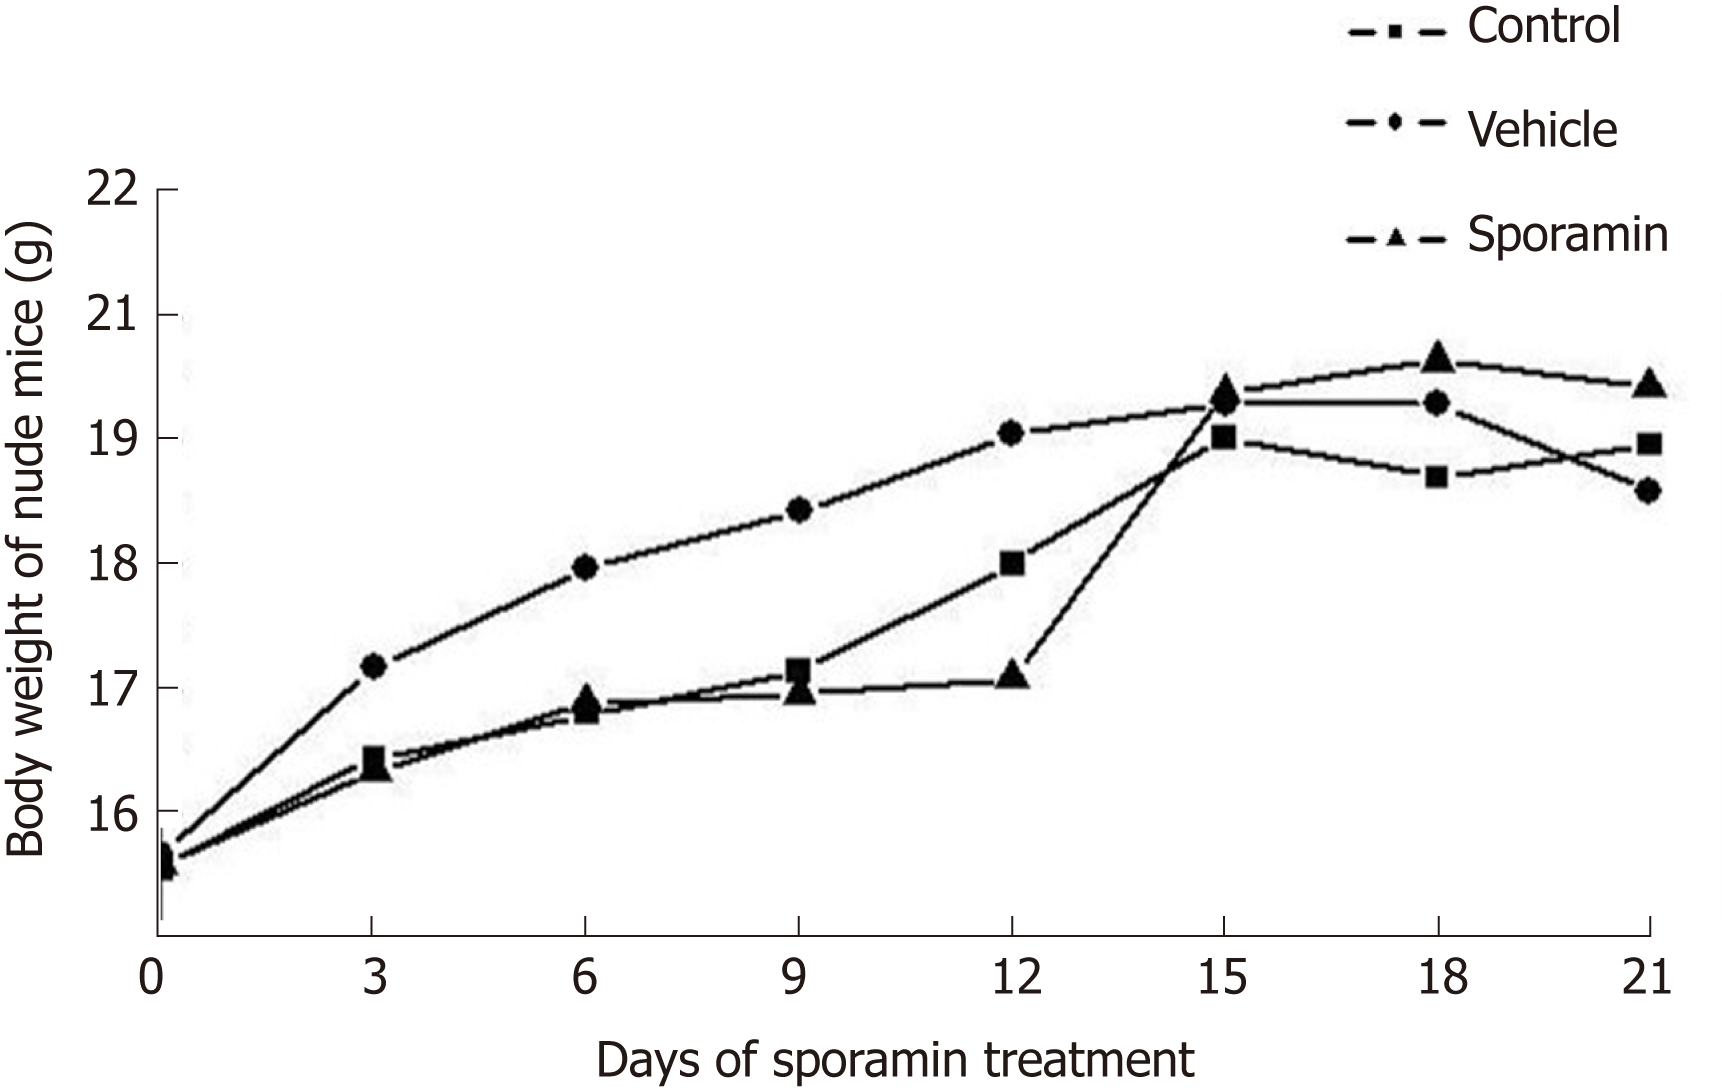
Figure 1 Body weight changes during sporamin treatment.
Figure 2 Establishment of a colorectal cancer in vivo model.
Photos taken of intestines from the vehicle group (A) and sporamin-treated group (B). C: Tumor shapes are shown.
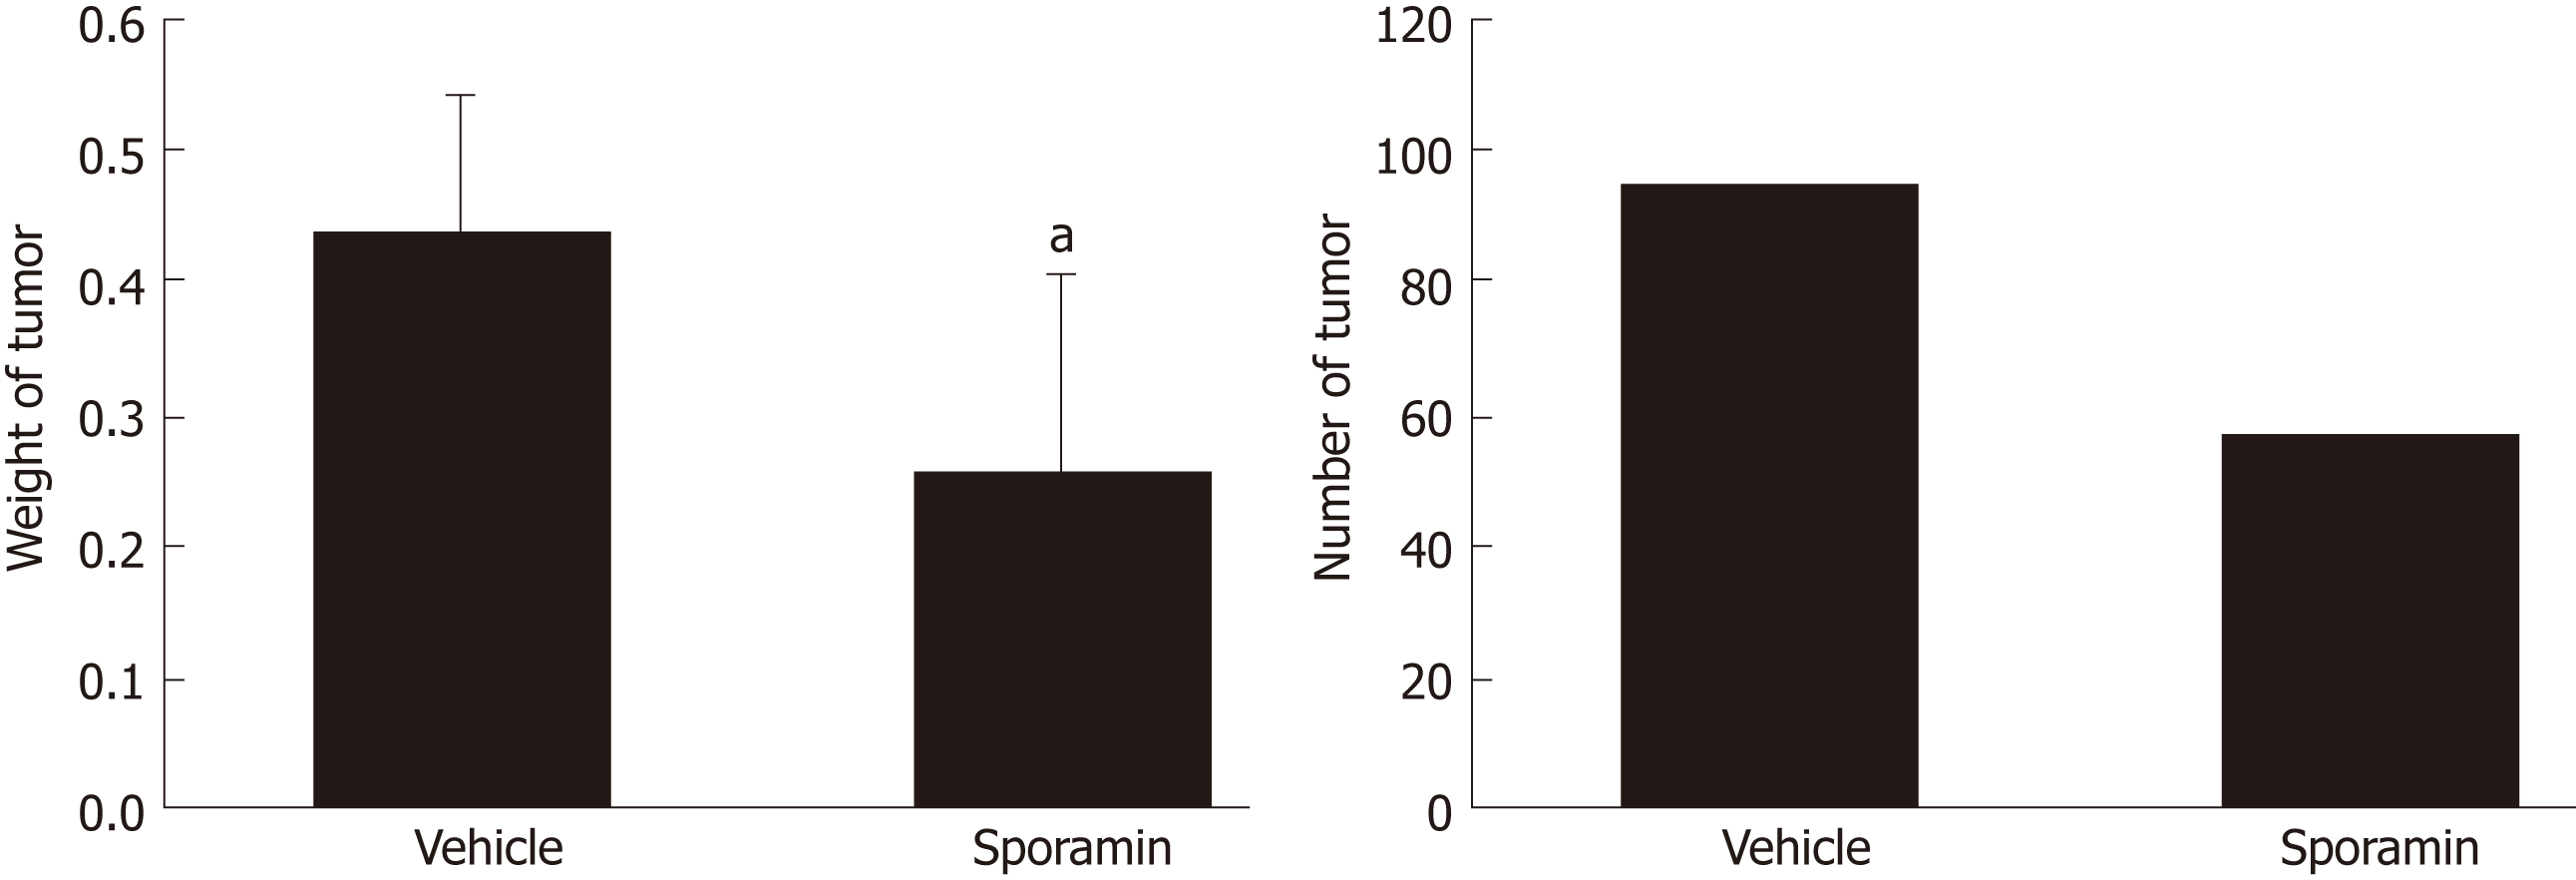
Figure 3 Changes in the weight and number of tumors following sporamin administration.
aP < 0.05 vs vehicle.
Figure 4 Liver histological changes after sporamin treatment.
Photomicrographs of hematoxylin and eosin staining of liver sections from the normal control group (A), vehicle group (B), and sporamin group (C). Magnification, 20×.
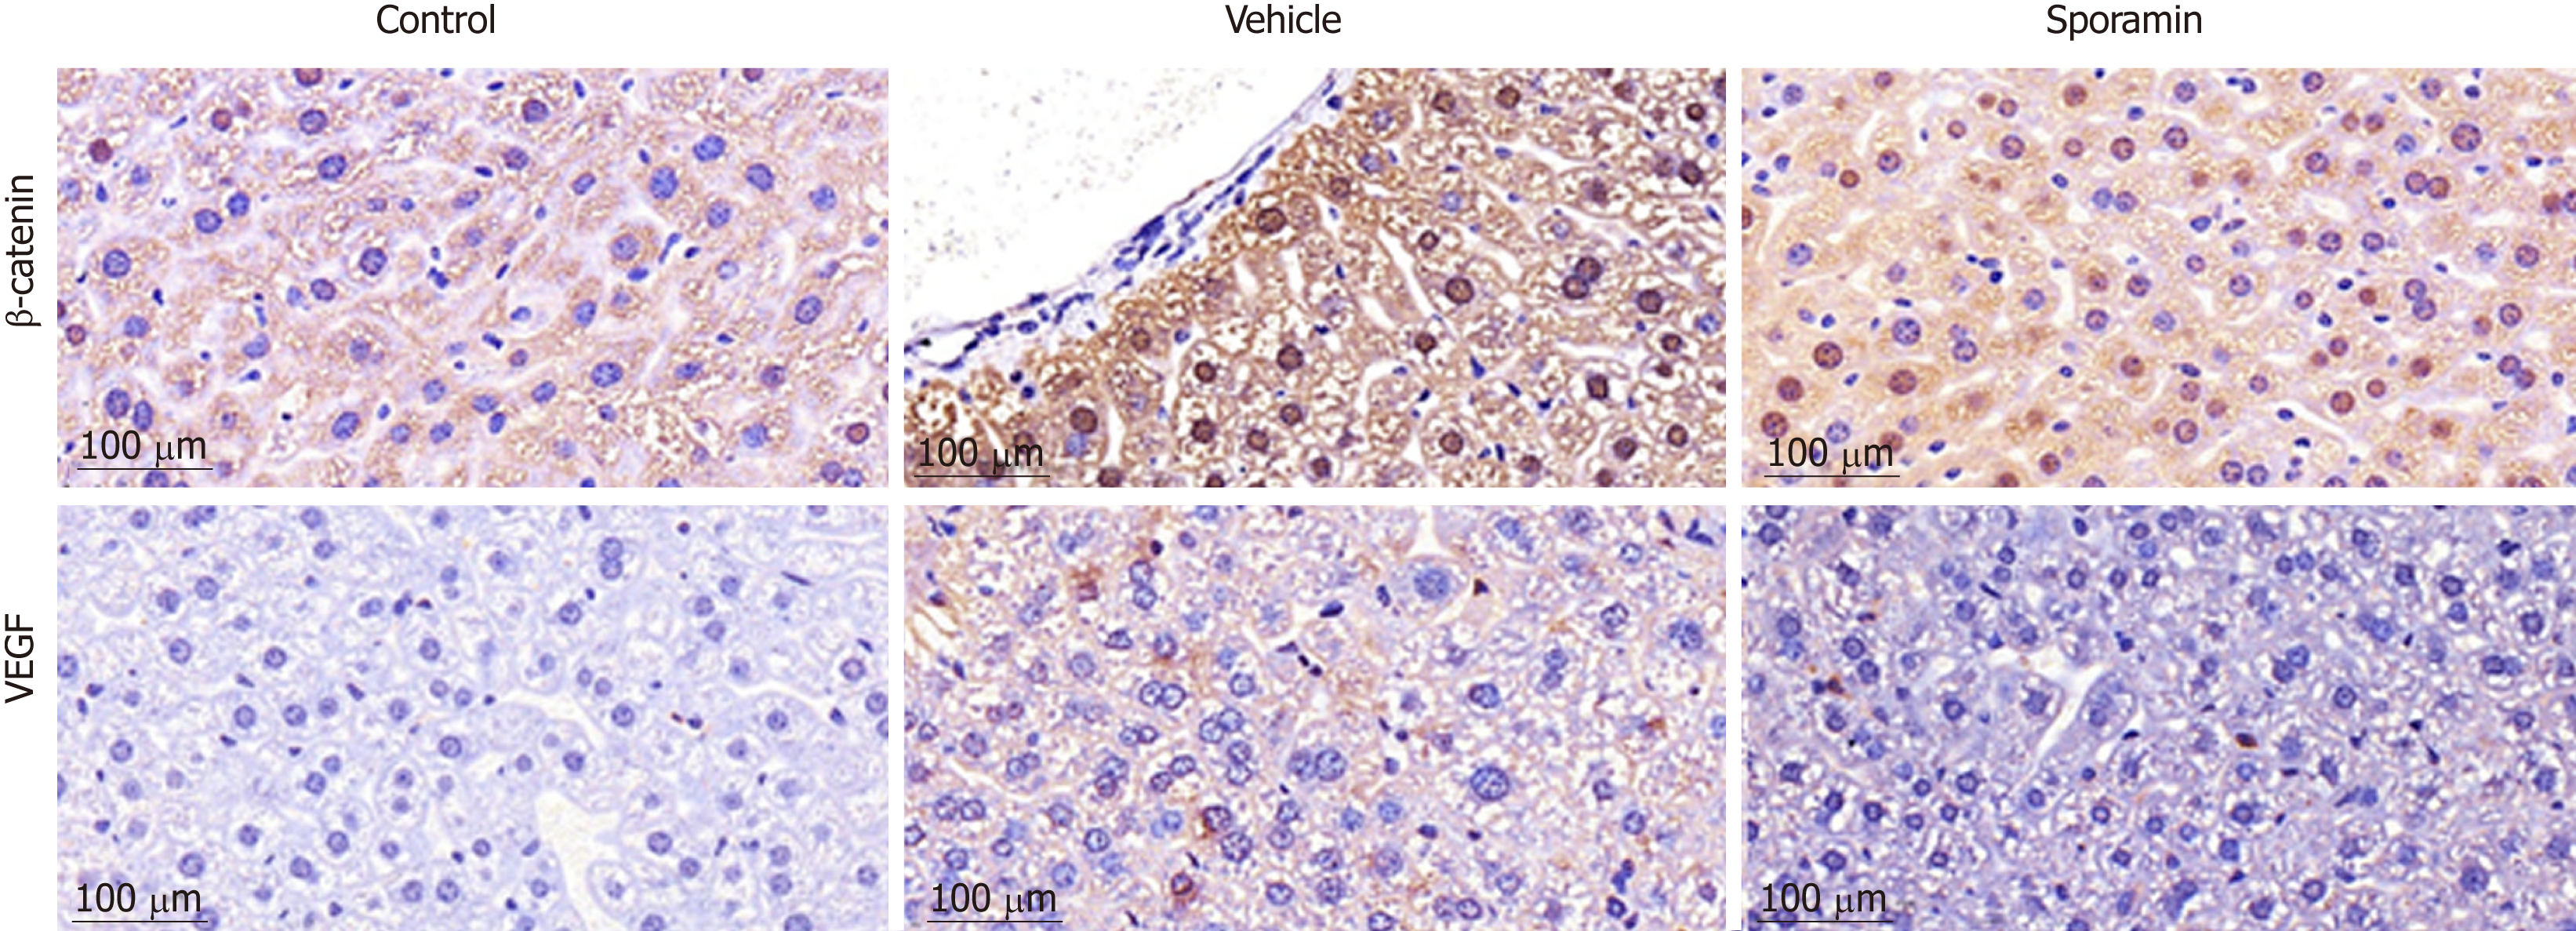
Figure 5 Immunohistochemical staining for vascular endothelial growth factor and β-catenin in the liver of nude mice after sporamin treatment.
Photomicrographs of liver sections from the control group (A), vehicle group (B), and sporamin group (C). Magnification, 40×. VEGF: Vascular endothelial growth factor.
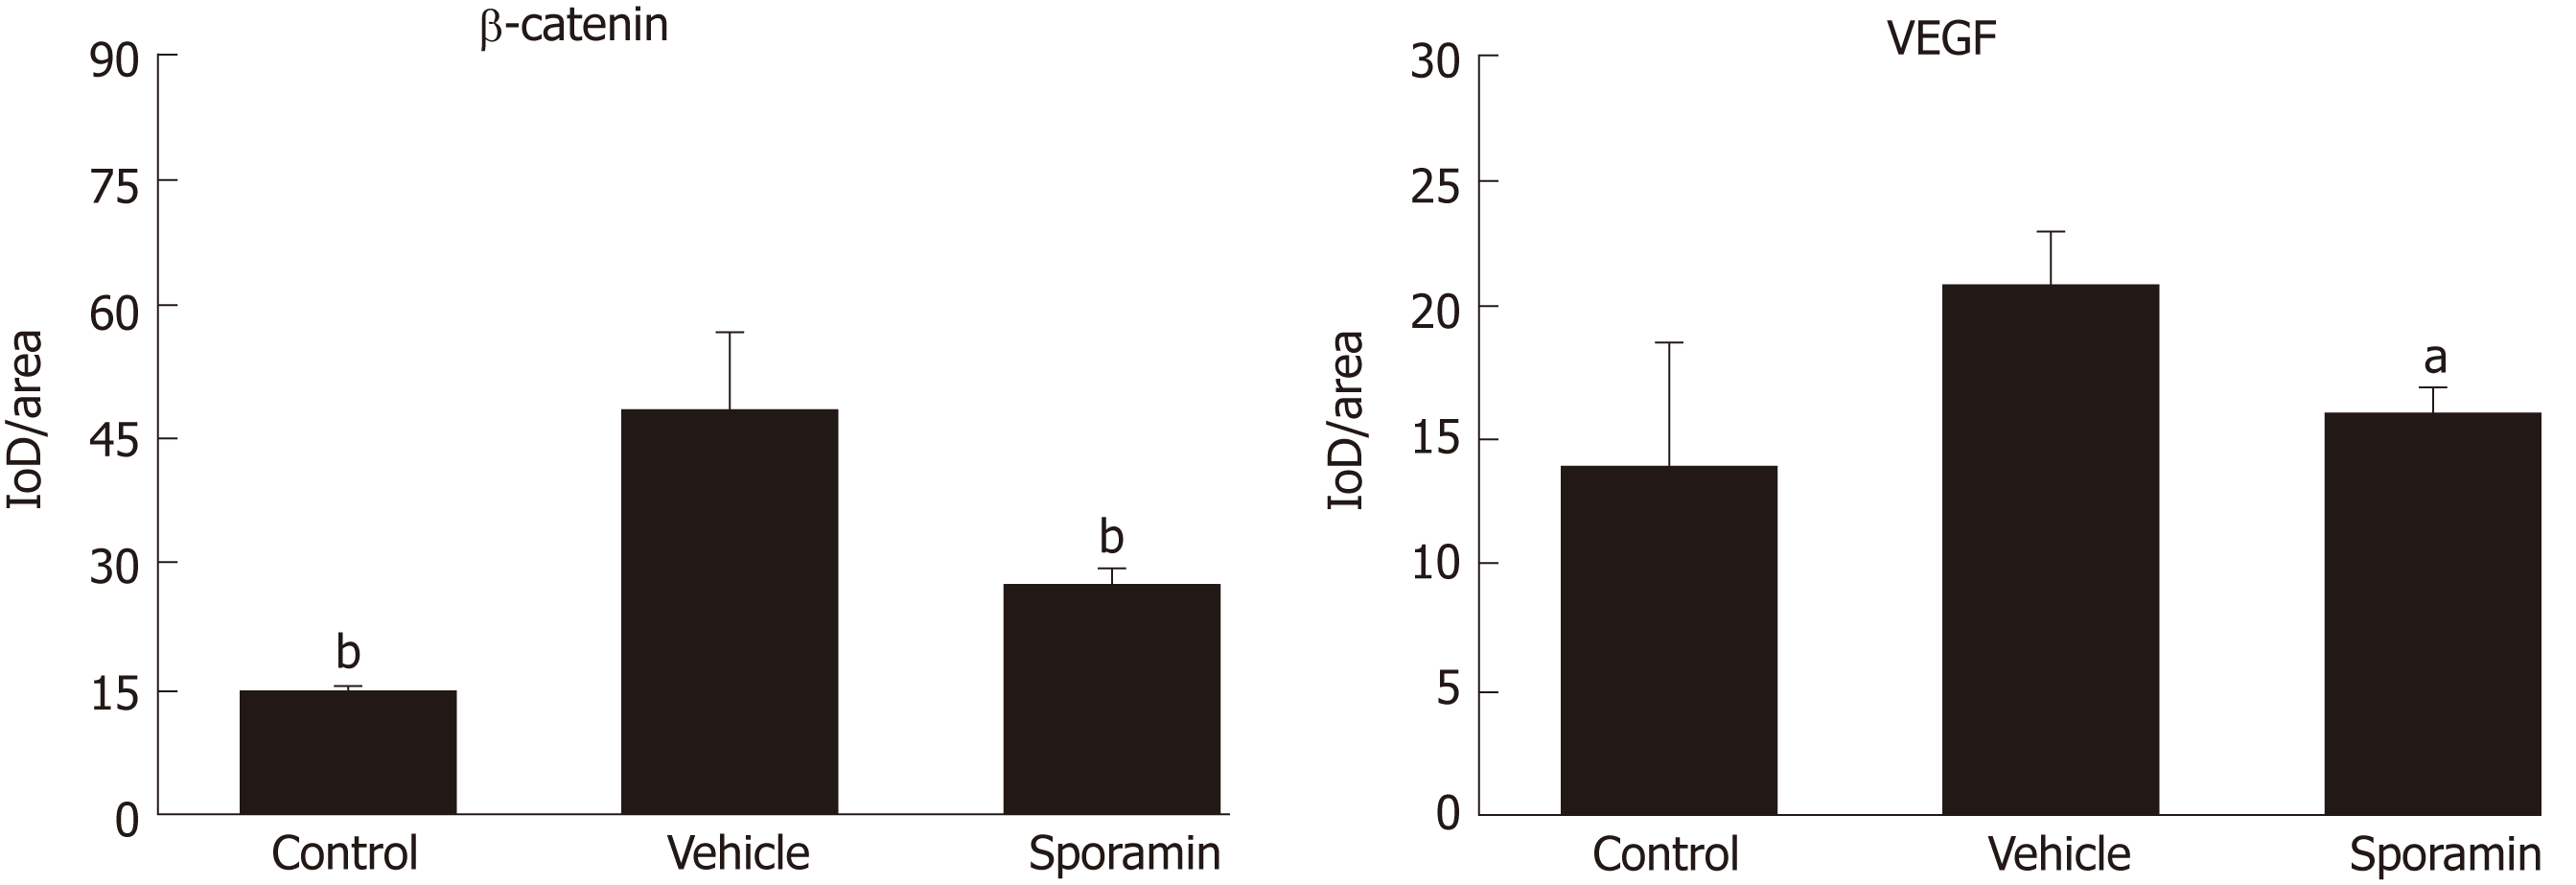
Figure 6 Average optical density of vascular endothelial growth factor and β-catenin in the liver of nude mice after sporamin treatment.
Measurements were made using ImageJ; n = 3 per group. aP < 0.05 vs vehicle, bP < 0.01 vs vehicle. VEGF: Vascular endothelial growth factor.
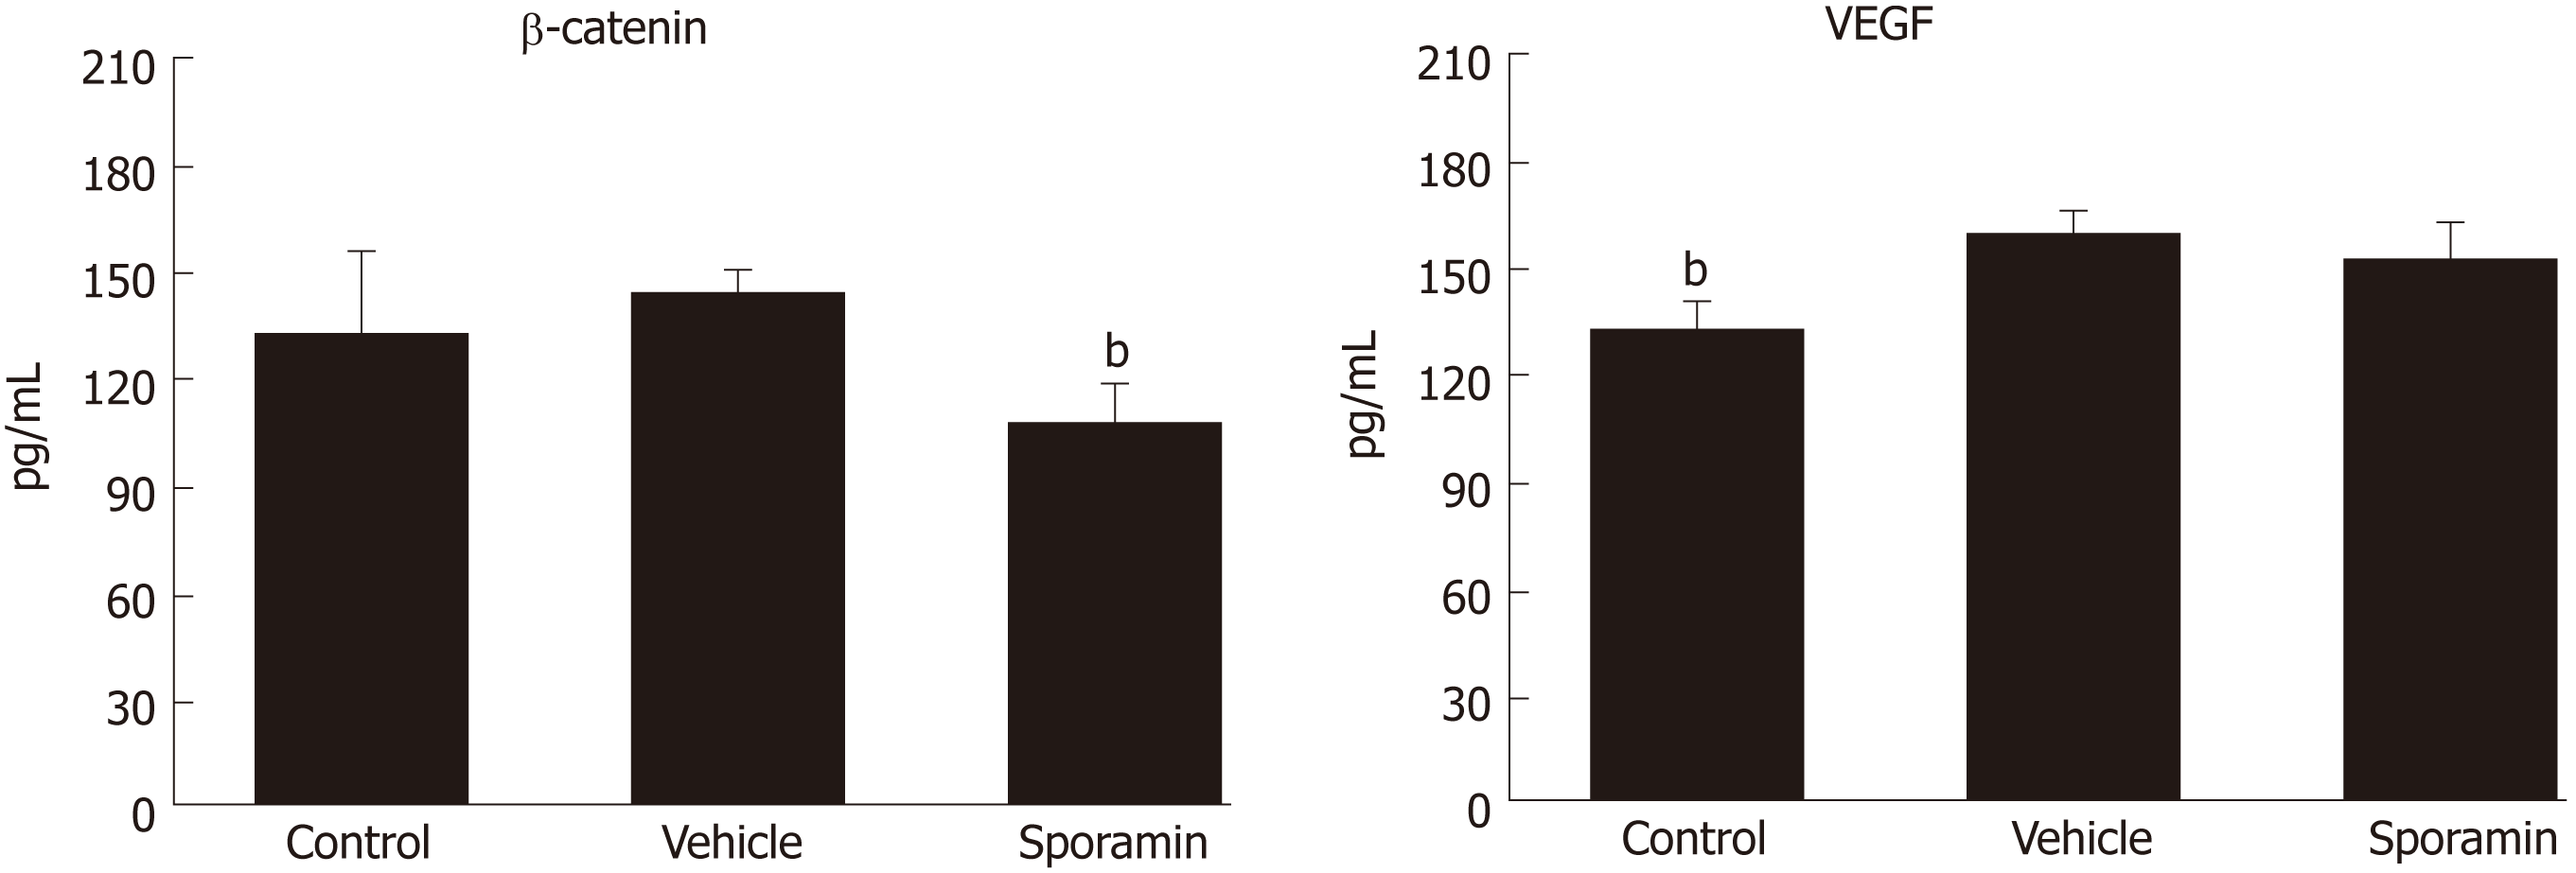
Figure 7 Concentrations of β-catenin and vascular endothelial growth factor in the liver of nude mice after sporamin treatment.
bP < 0.01 vs vehicle. VEGF: Vascular endothelial growth factor.
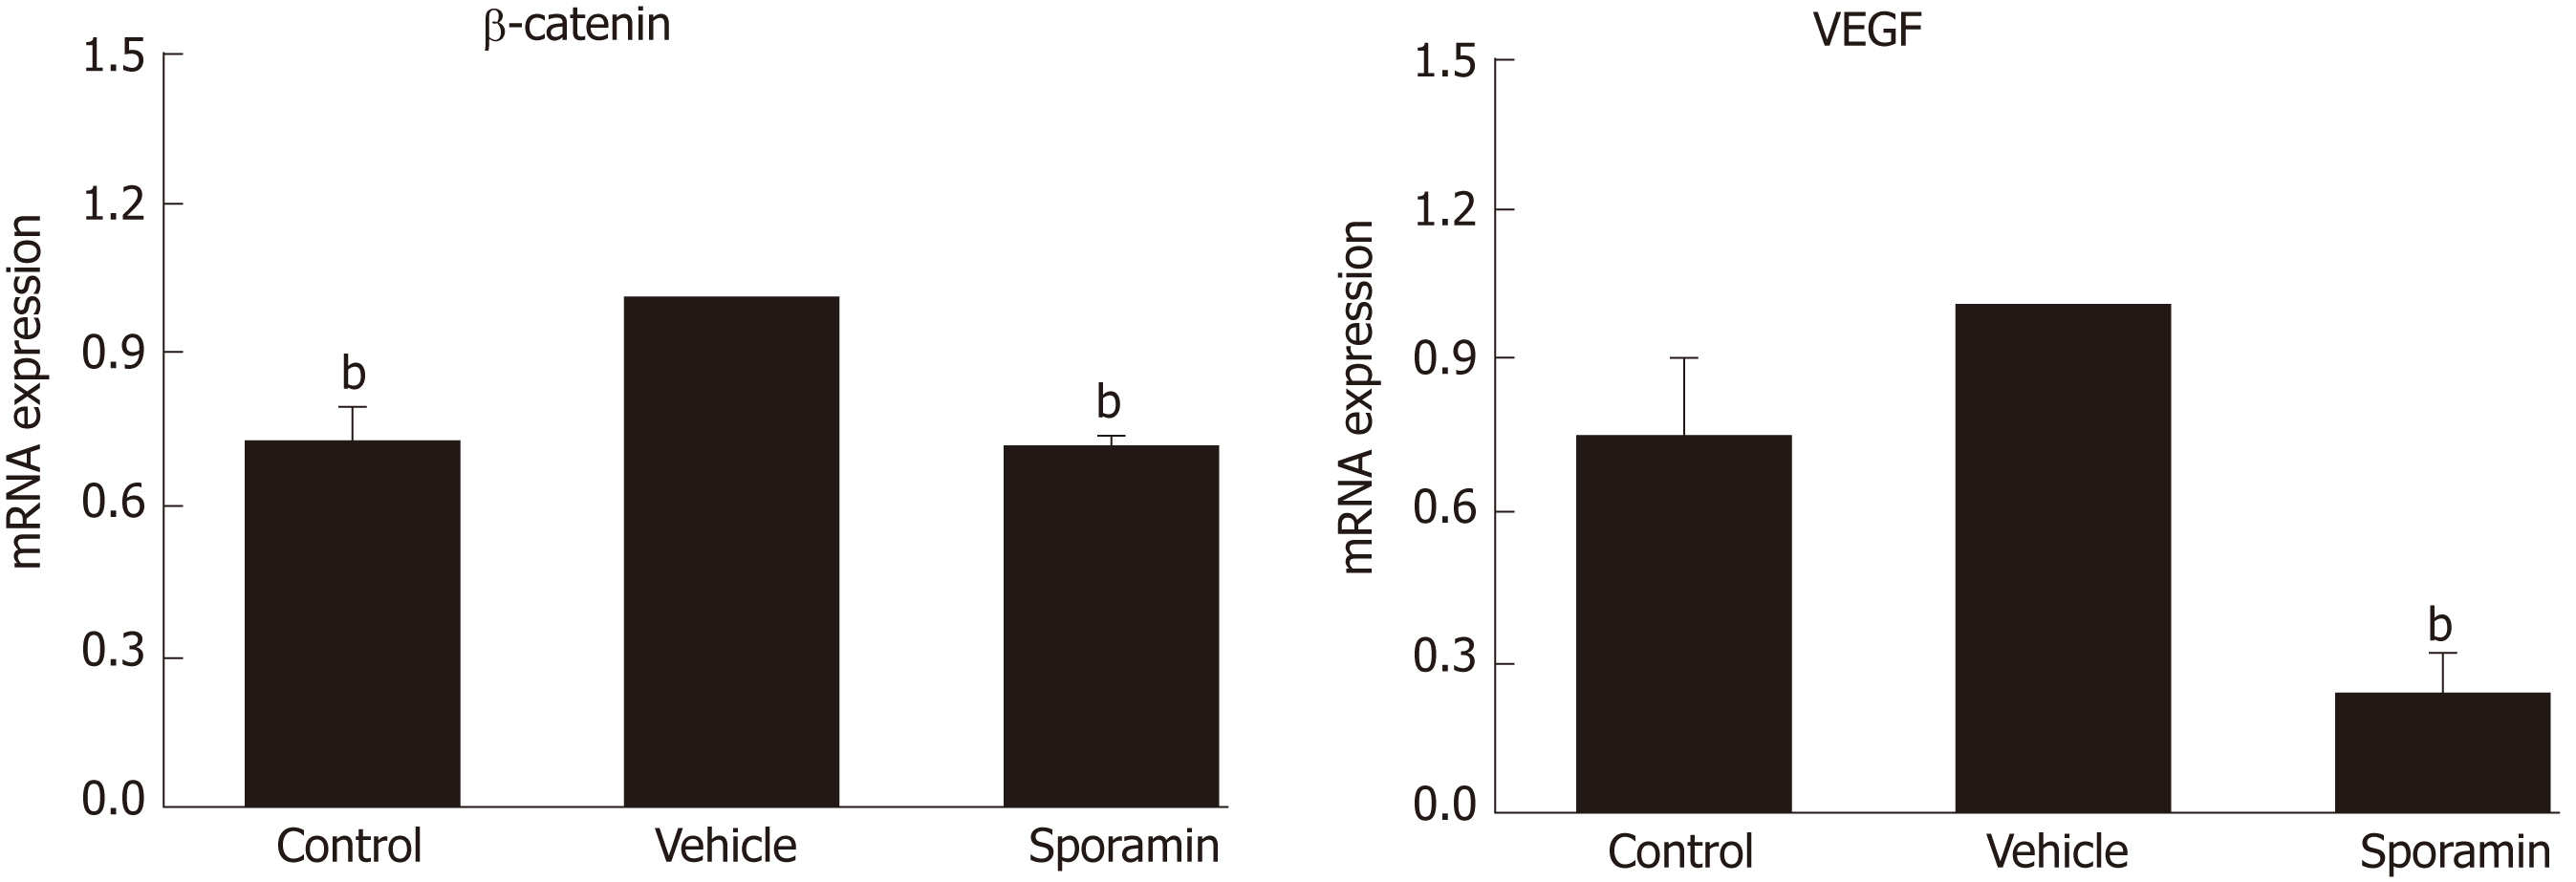
Figure 8 Relative mRNA expression of β-catenin and vascular endothelial growth factor.
bP < 0.01 vs vehicle.
- Citation: Yang C, Zhang JJ, Zhang XP, Xiao R, Li PG. Sporamin suppresses growth of xenografted colorectal carcinoma in athymic BALB/c mice by inhibiting liver β-catenin and vascular endothelial growth factor expression. World J Gastroenterol 2019; 25(25): 3196-3206
- URL: https://www.wjgnet.com/1007-9327/full/v25/i25/3196.htm
- DOI: https://dx.doi.org/10.3748/wjg.v25.i25.3196


