Copyright
©The Author(s) 2019.
World J Gastroenterol. Jun 21, 2019; 25(23): 2924-2934
Published online Jun 21, 2019. doi: 10.3748/wjg.v25.i23.2924
Published online Jun 21, 2019. doi: 10.3748/wjg.v25.i23.2924
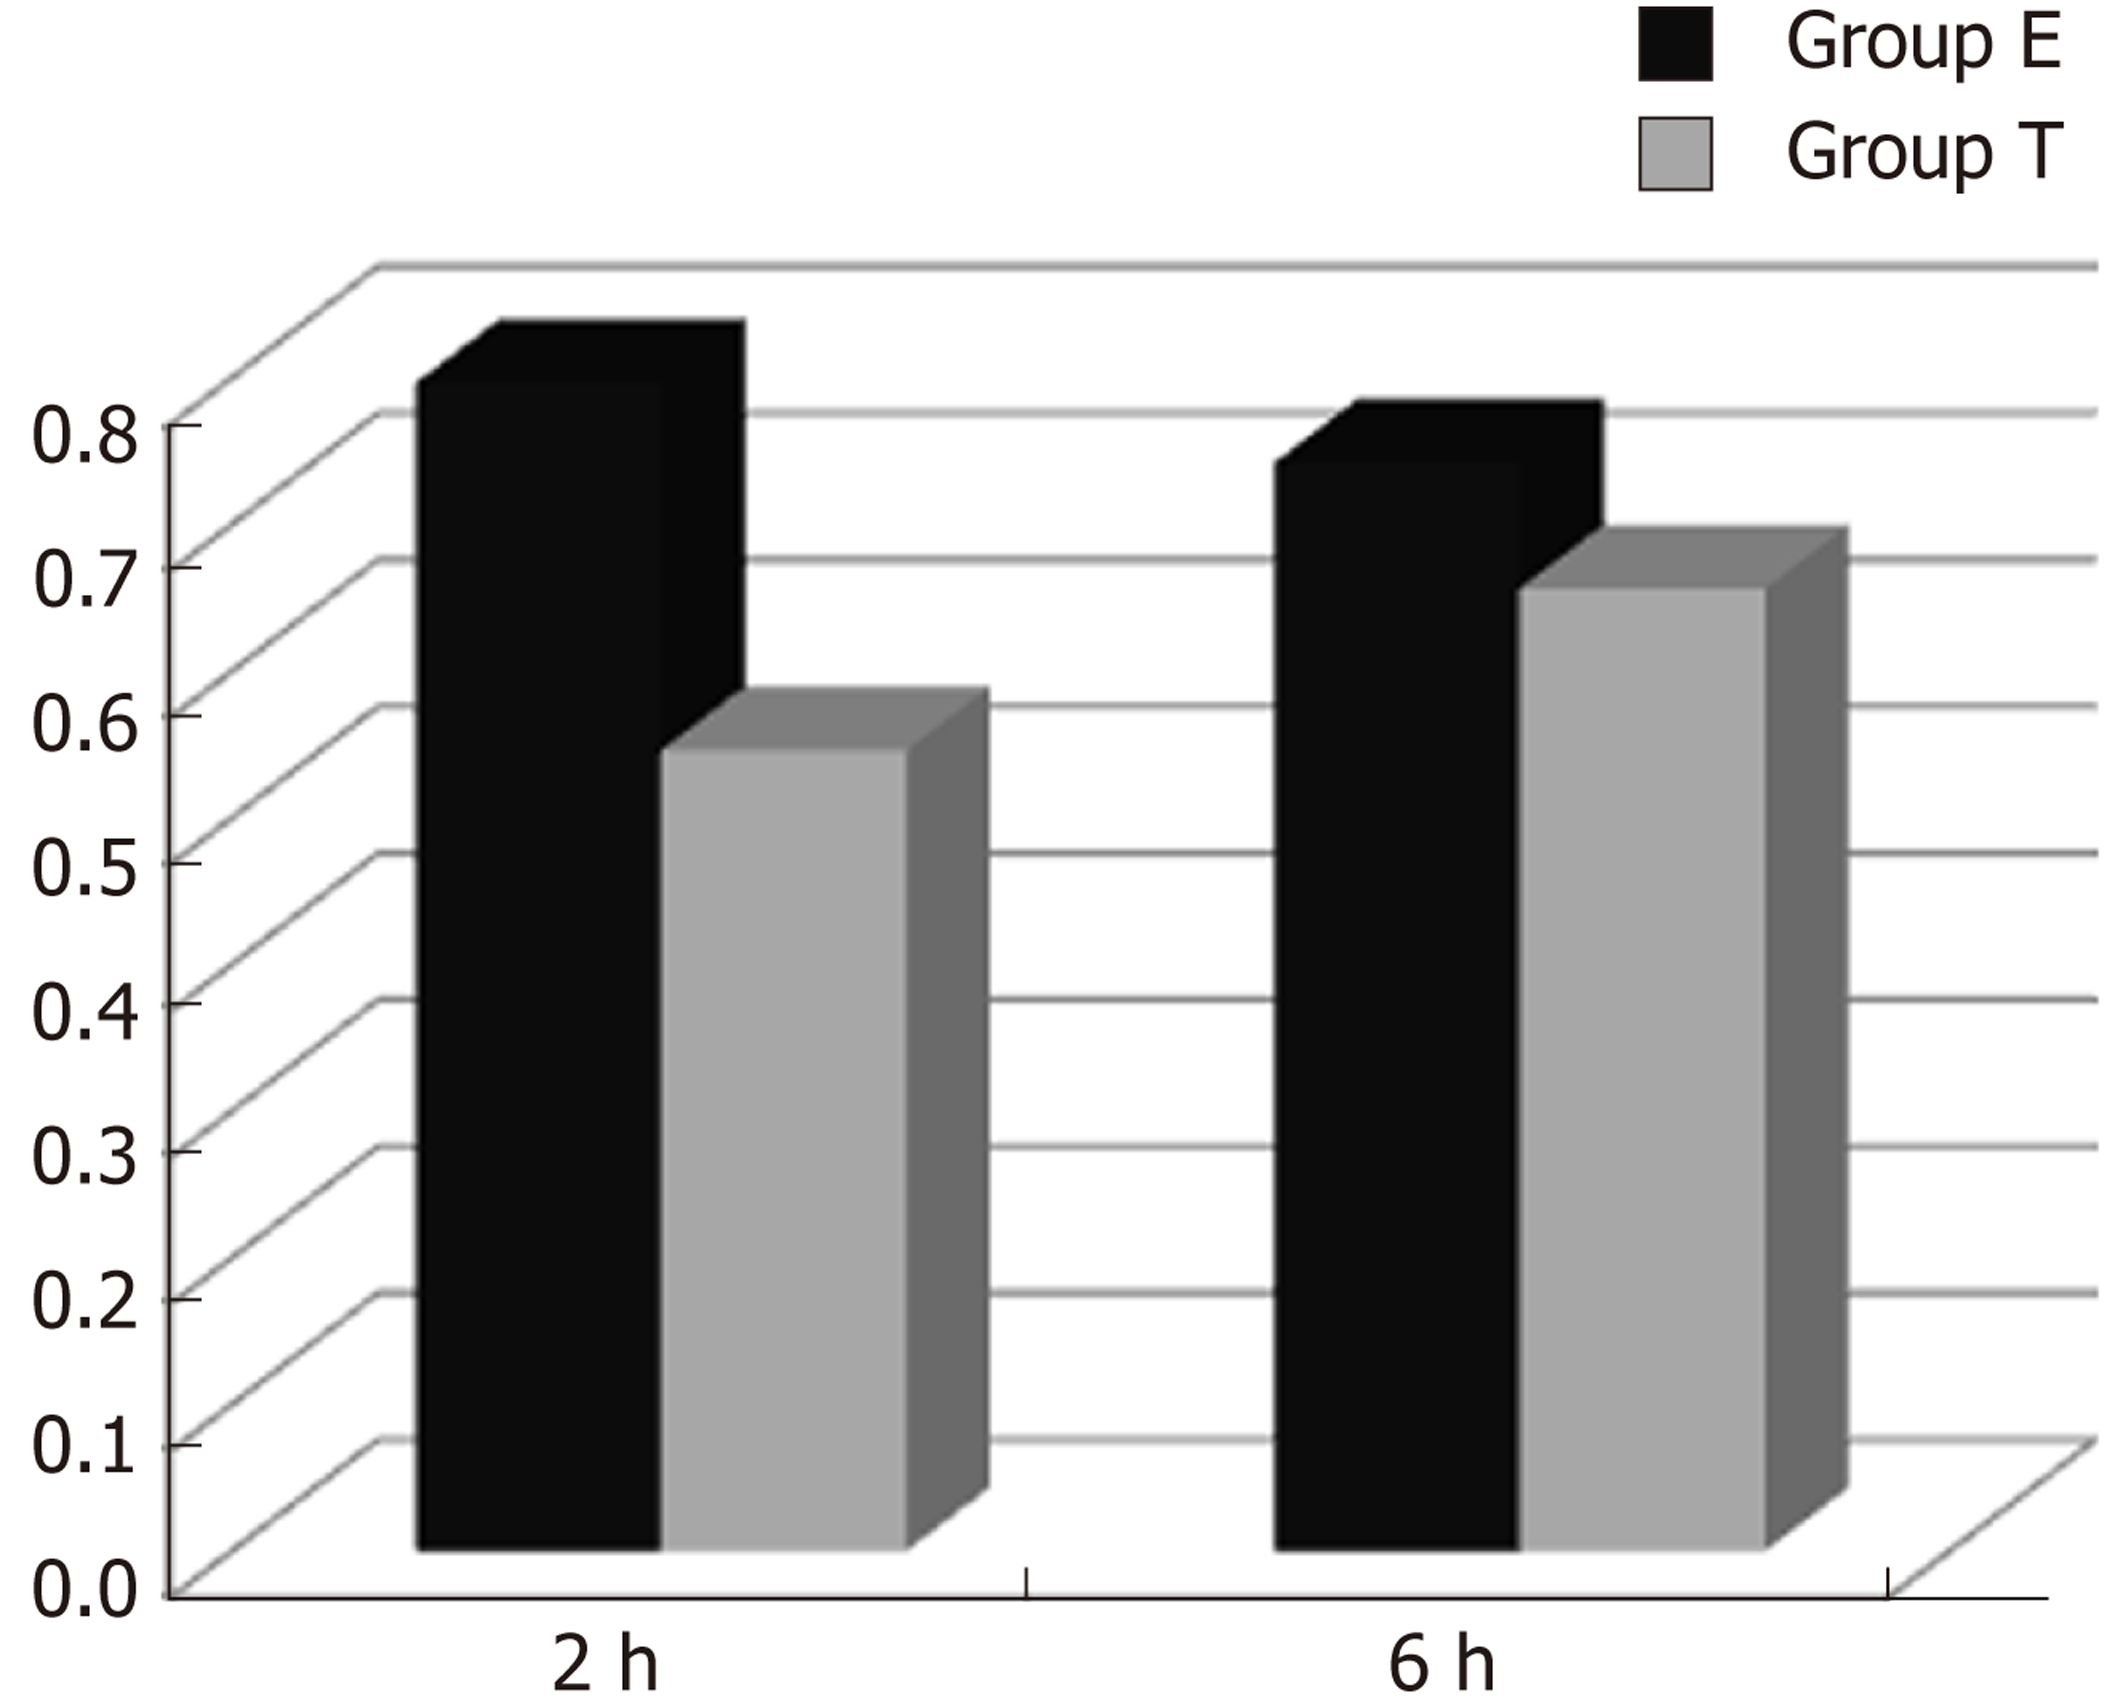
Figure 1 Optical density ratio of cytokine-induced neutrophil chemoattractant mRNA/β-actin mRNA in ileal tissue (mean ± SD).
Figure 2 Cytokine-induced neutrophil chemoattractant mRNA expression in ileal tissue.
M: DNA marker; C: Group C; E1–3: Group E 2 h, 6 h, and 12 h, respectively; T1–3: Group T 2 h, 6 h, and 12 h, respectively; 390 bp: Expected size of cytokine-induced neutrophil chemoattractant RT-PCR product.
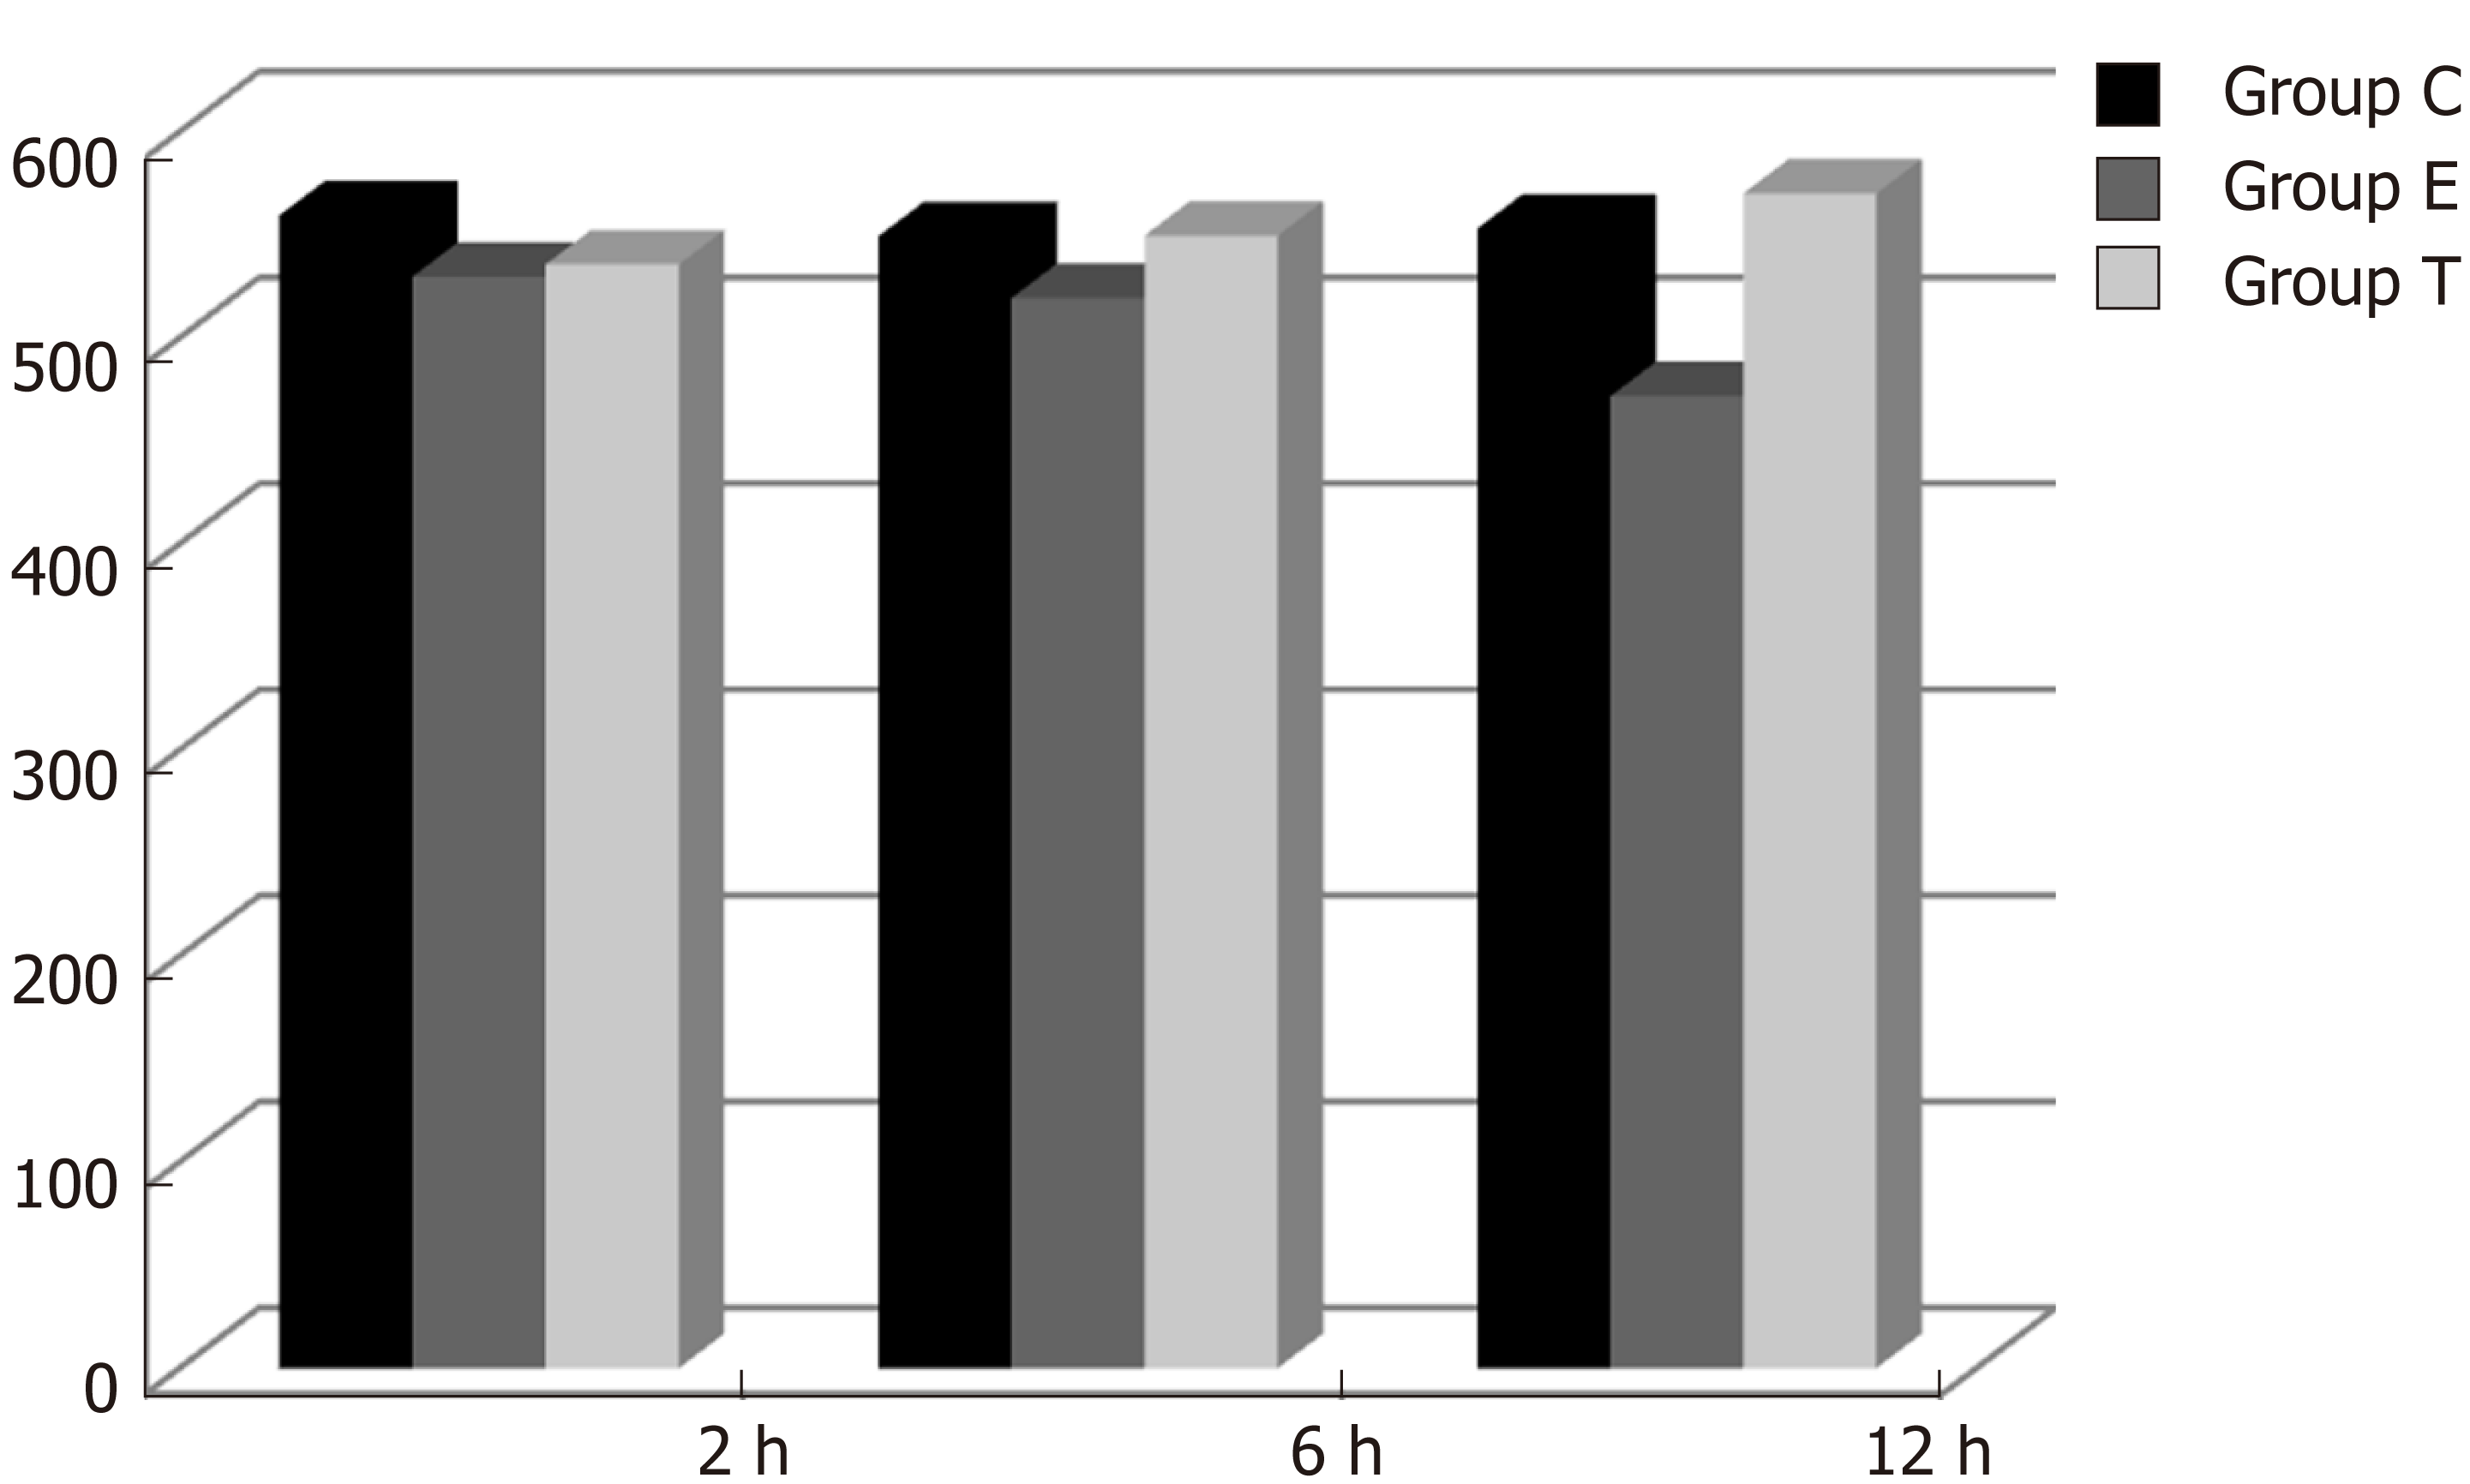
Figure 3 Immunohistochemical density of insulin-like growth factor 1 in the ileum (mean ± SD).
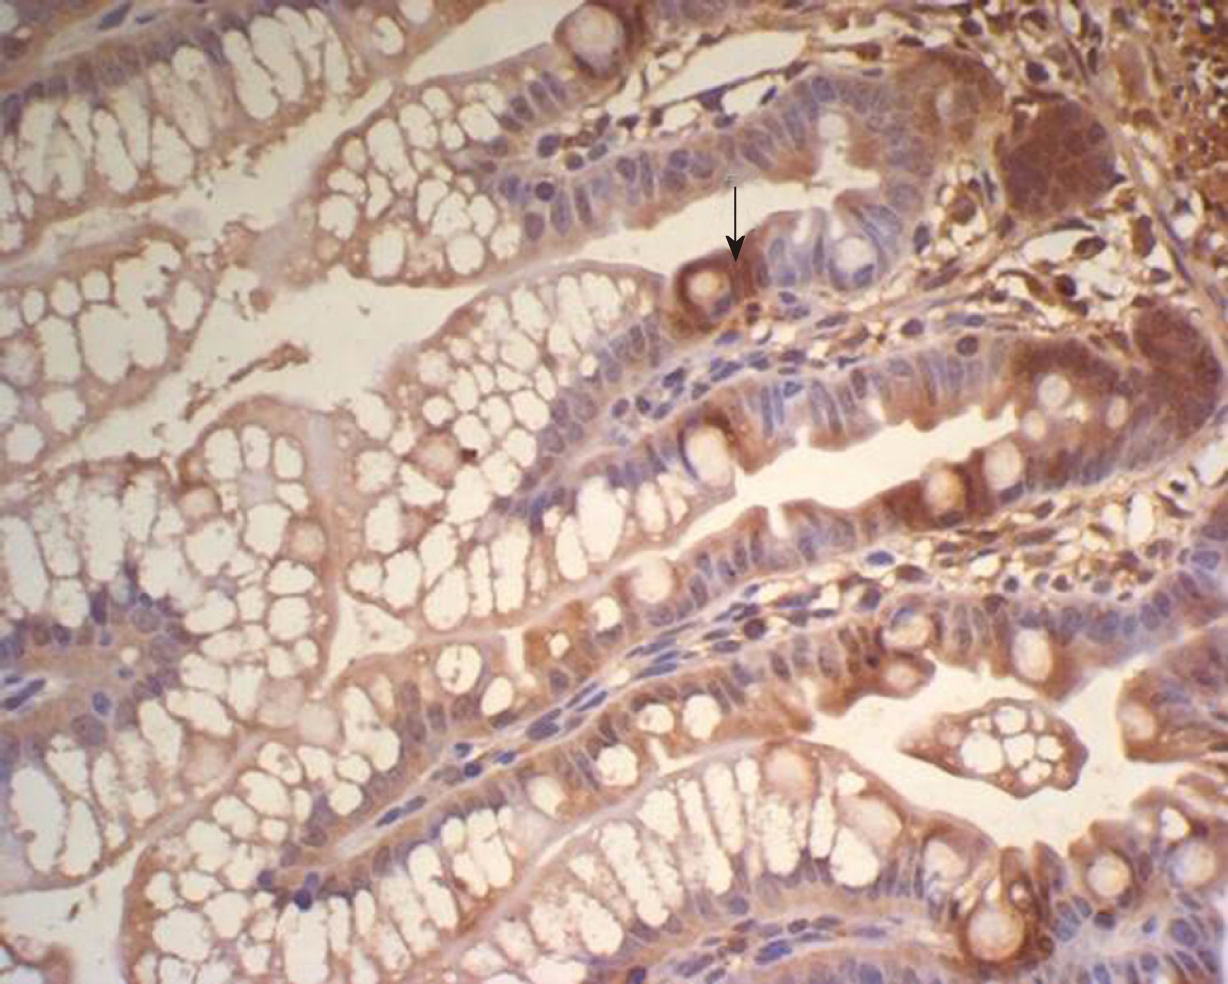
Figure 4 Insulin-like growth factor 1 expression in the ileum of group C, showing a large number of brown granules in the intestinal crypt and epithelial cells (× 400).
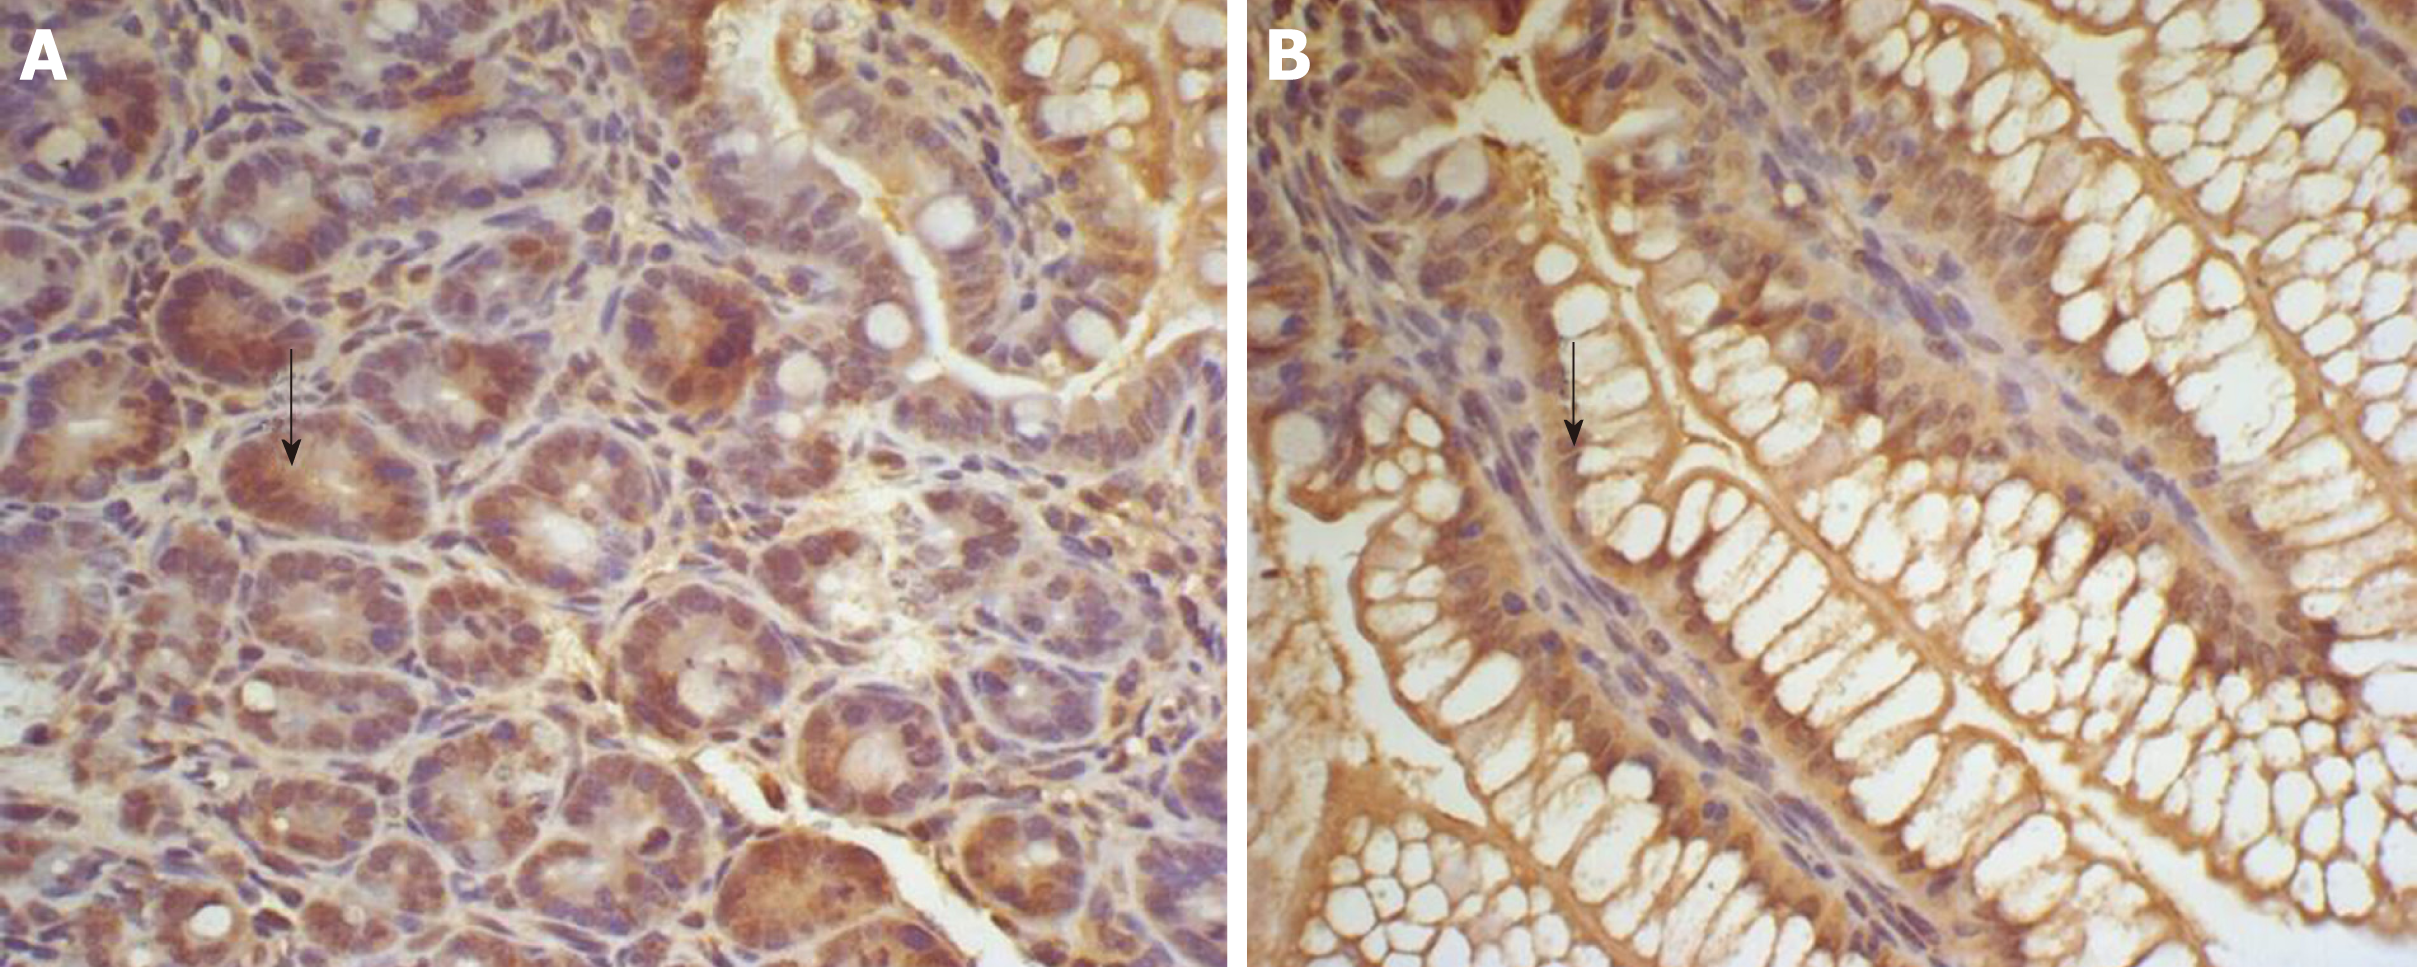
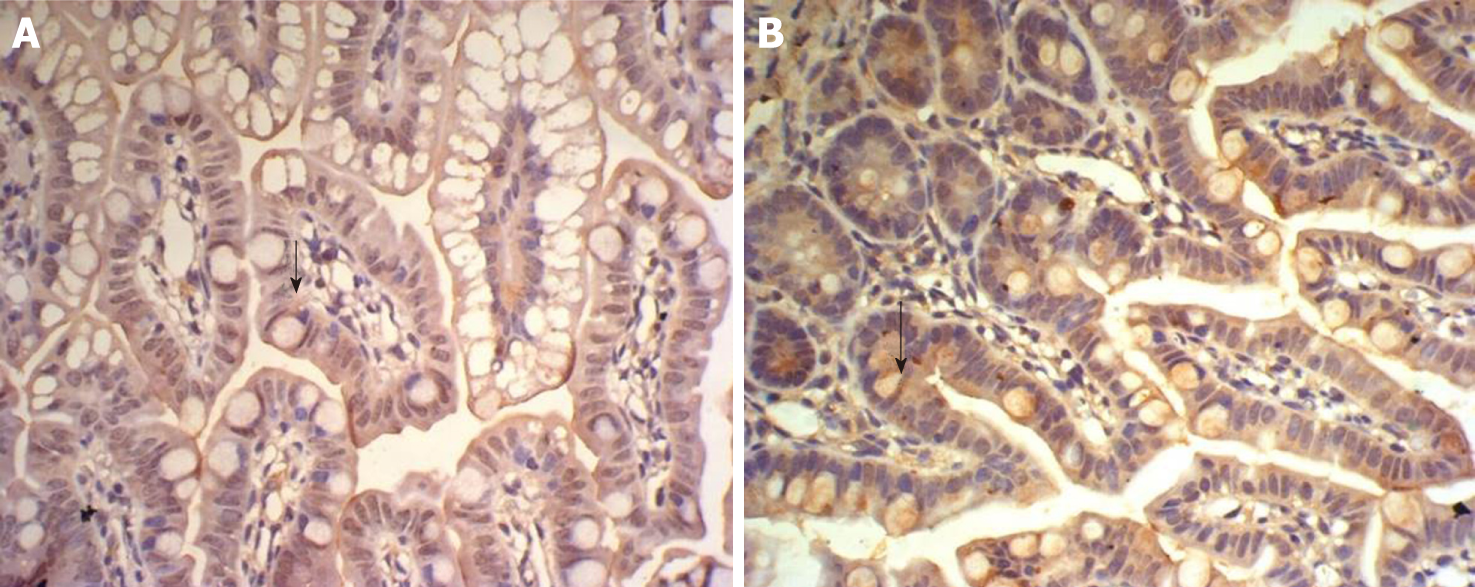
Figure 5 Expression of insulin-like growth factor 1 in the ileum of Group E and T at 2 h.
A: Expression of insulin-like growth factor 1 in the ileum of group E at 2 h, showing many brown-staining granules in the intestinal epithelial cells (× 400); B: Expression of insulin-like growth factor 1 in the ileum of group T at 2 h, showing many brown-staining granules in intestinal crypt and epithelial cells (× 400).
Figure 6 Expression of insulin-like growth factor 1 in the ileum of group E and T at 6 h.
A: Expression of insulin-like growth factor 1 in the ileum of group E at 6 h, showing faint brown-staining granules in the intestinal epithelial cells (× 400); B: Expression of insulin-like growth factor 1 in the ileum of group T at 6 h, showing many densely distributed brown-staining granules in the intestinal crypt and epithelial cells (× 400).
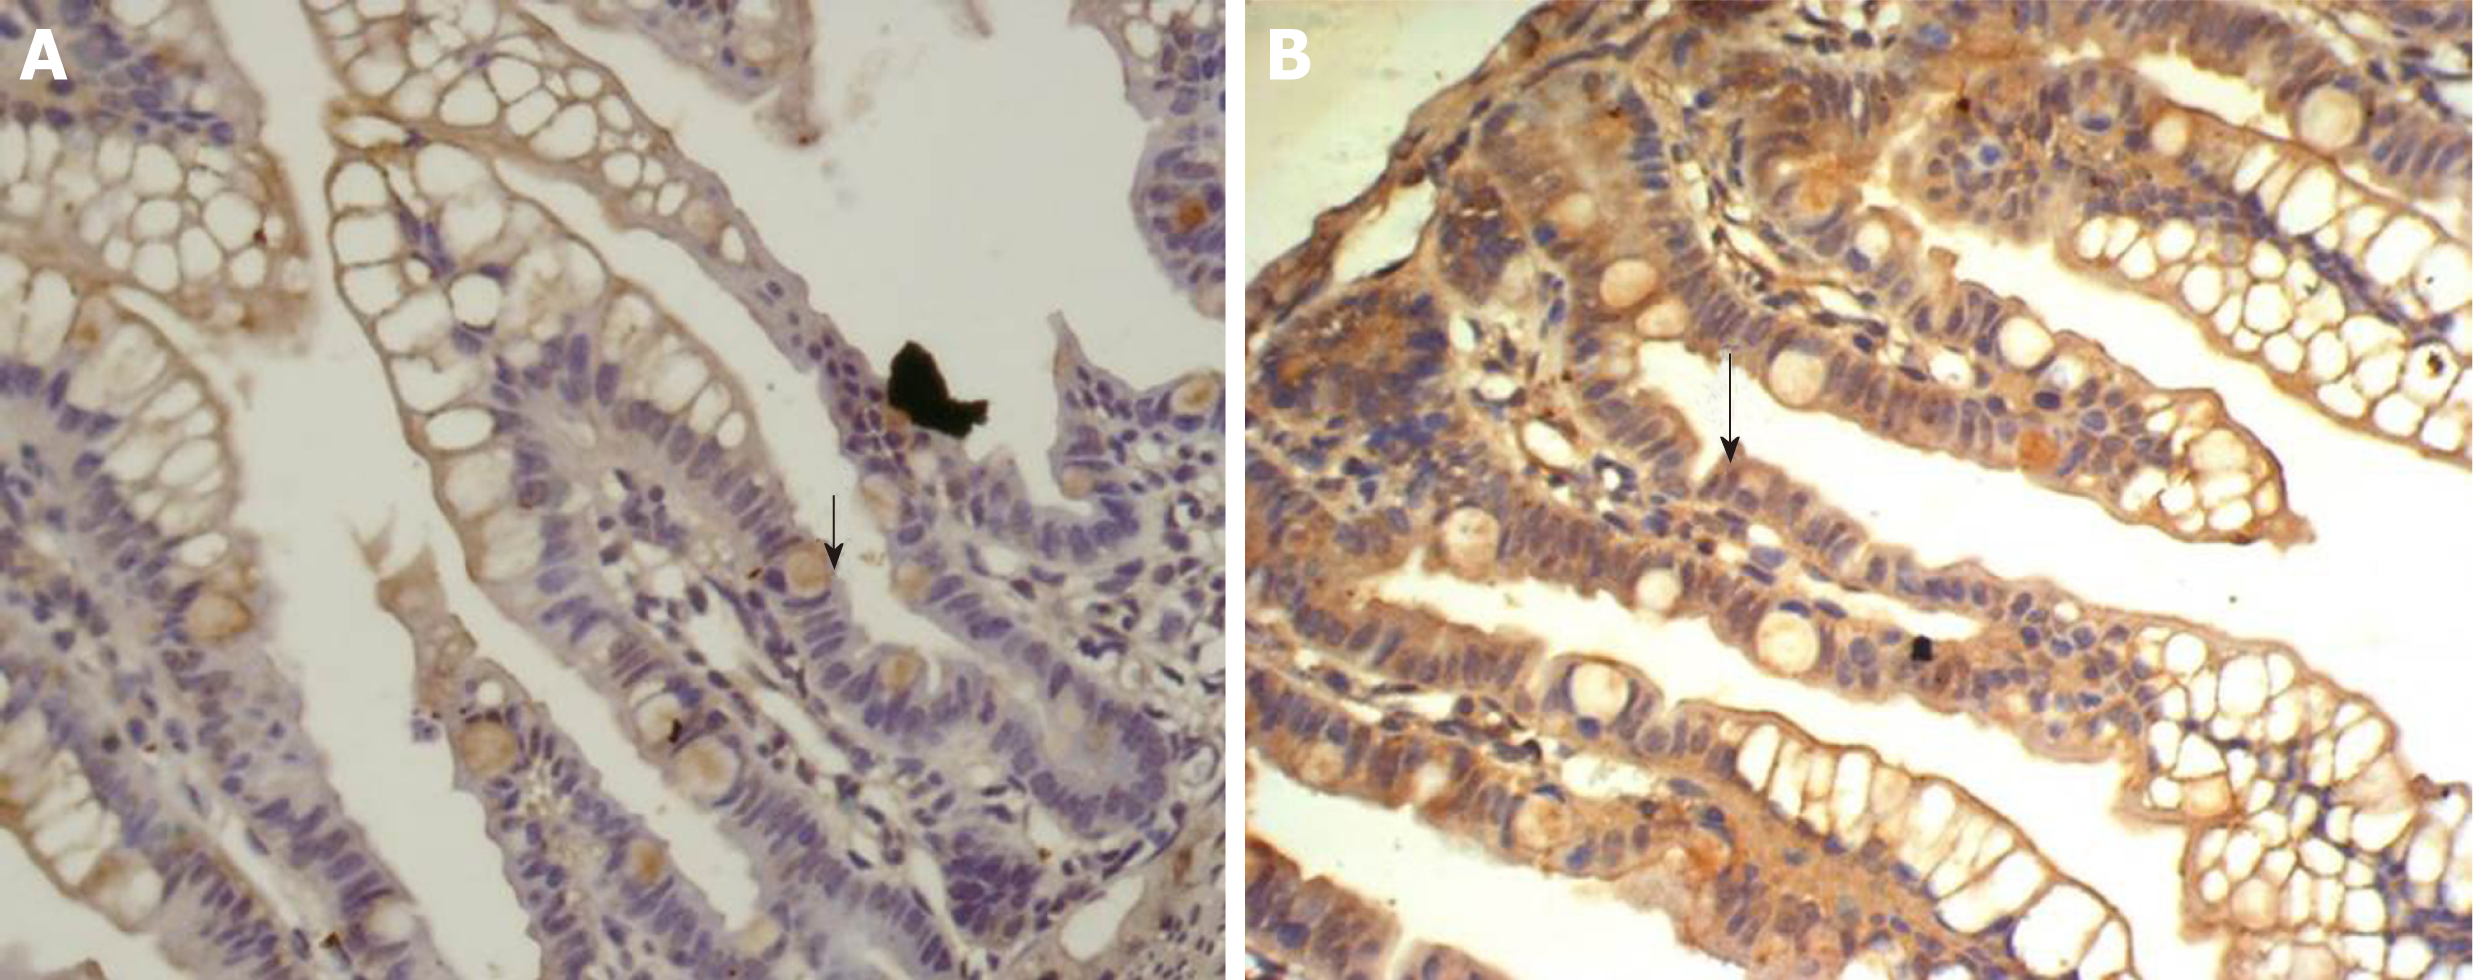
Figure 7 Expression of insulin-like growth factor 1 in the ileum of group E and T at 12 h.
A: Expression of insulin-like growth factor 1 in the ileum of the group E at 12 h, showing faint and sparse brown-staining granules in the intestinal epithelial cells (× 400); B: Expression of insulin-like growth factor 1 in the ileum of group T at 12 h, showing diffuse and dense distribution of brown-staining granules in intestinal crypt and epithelial cells (× 400).
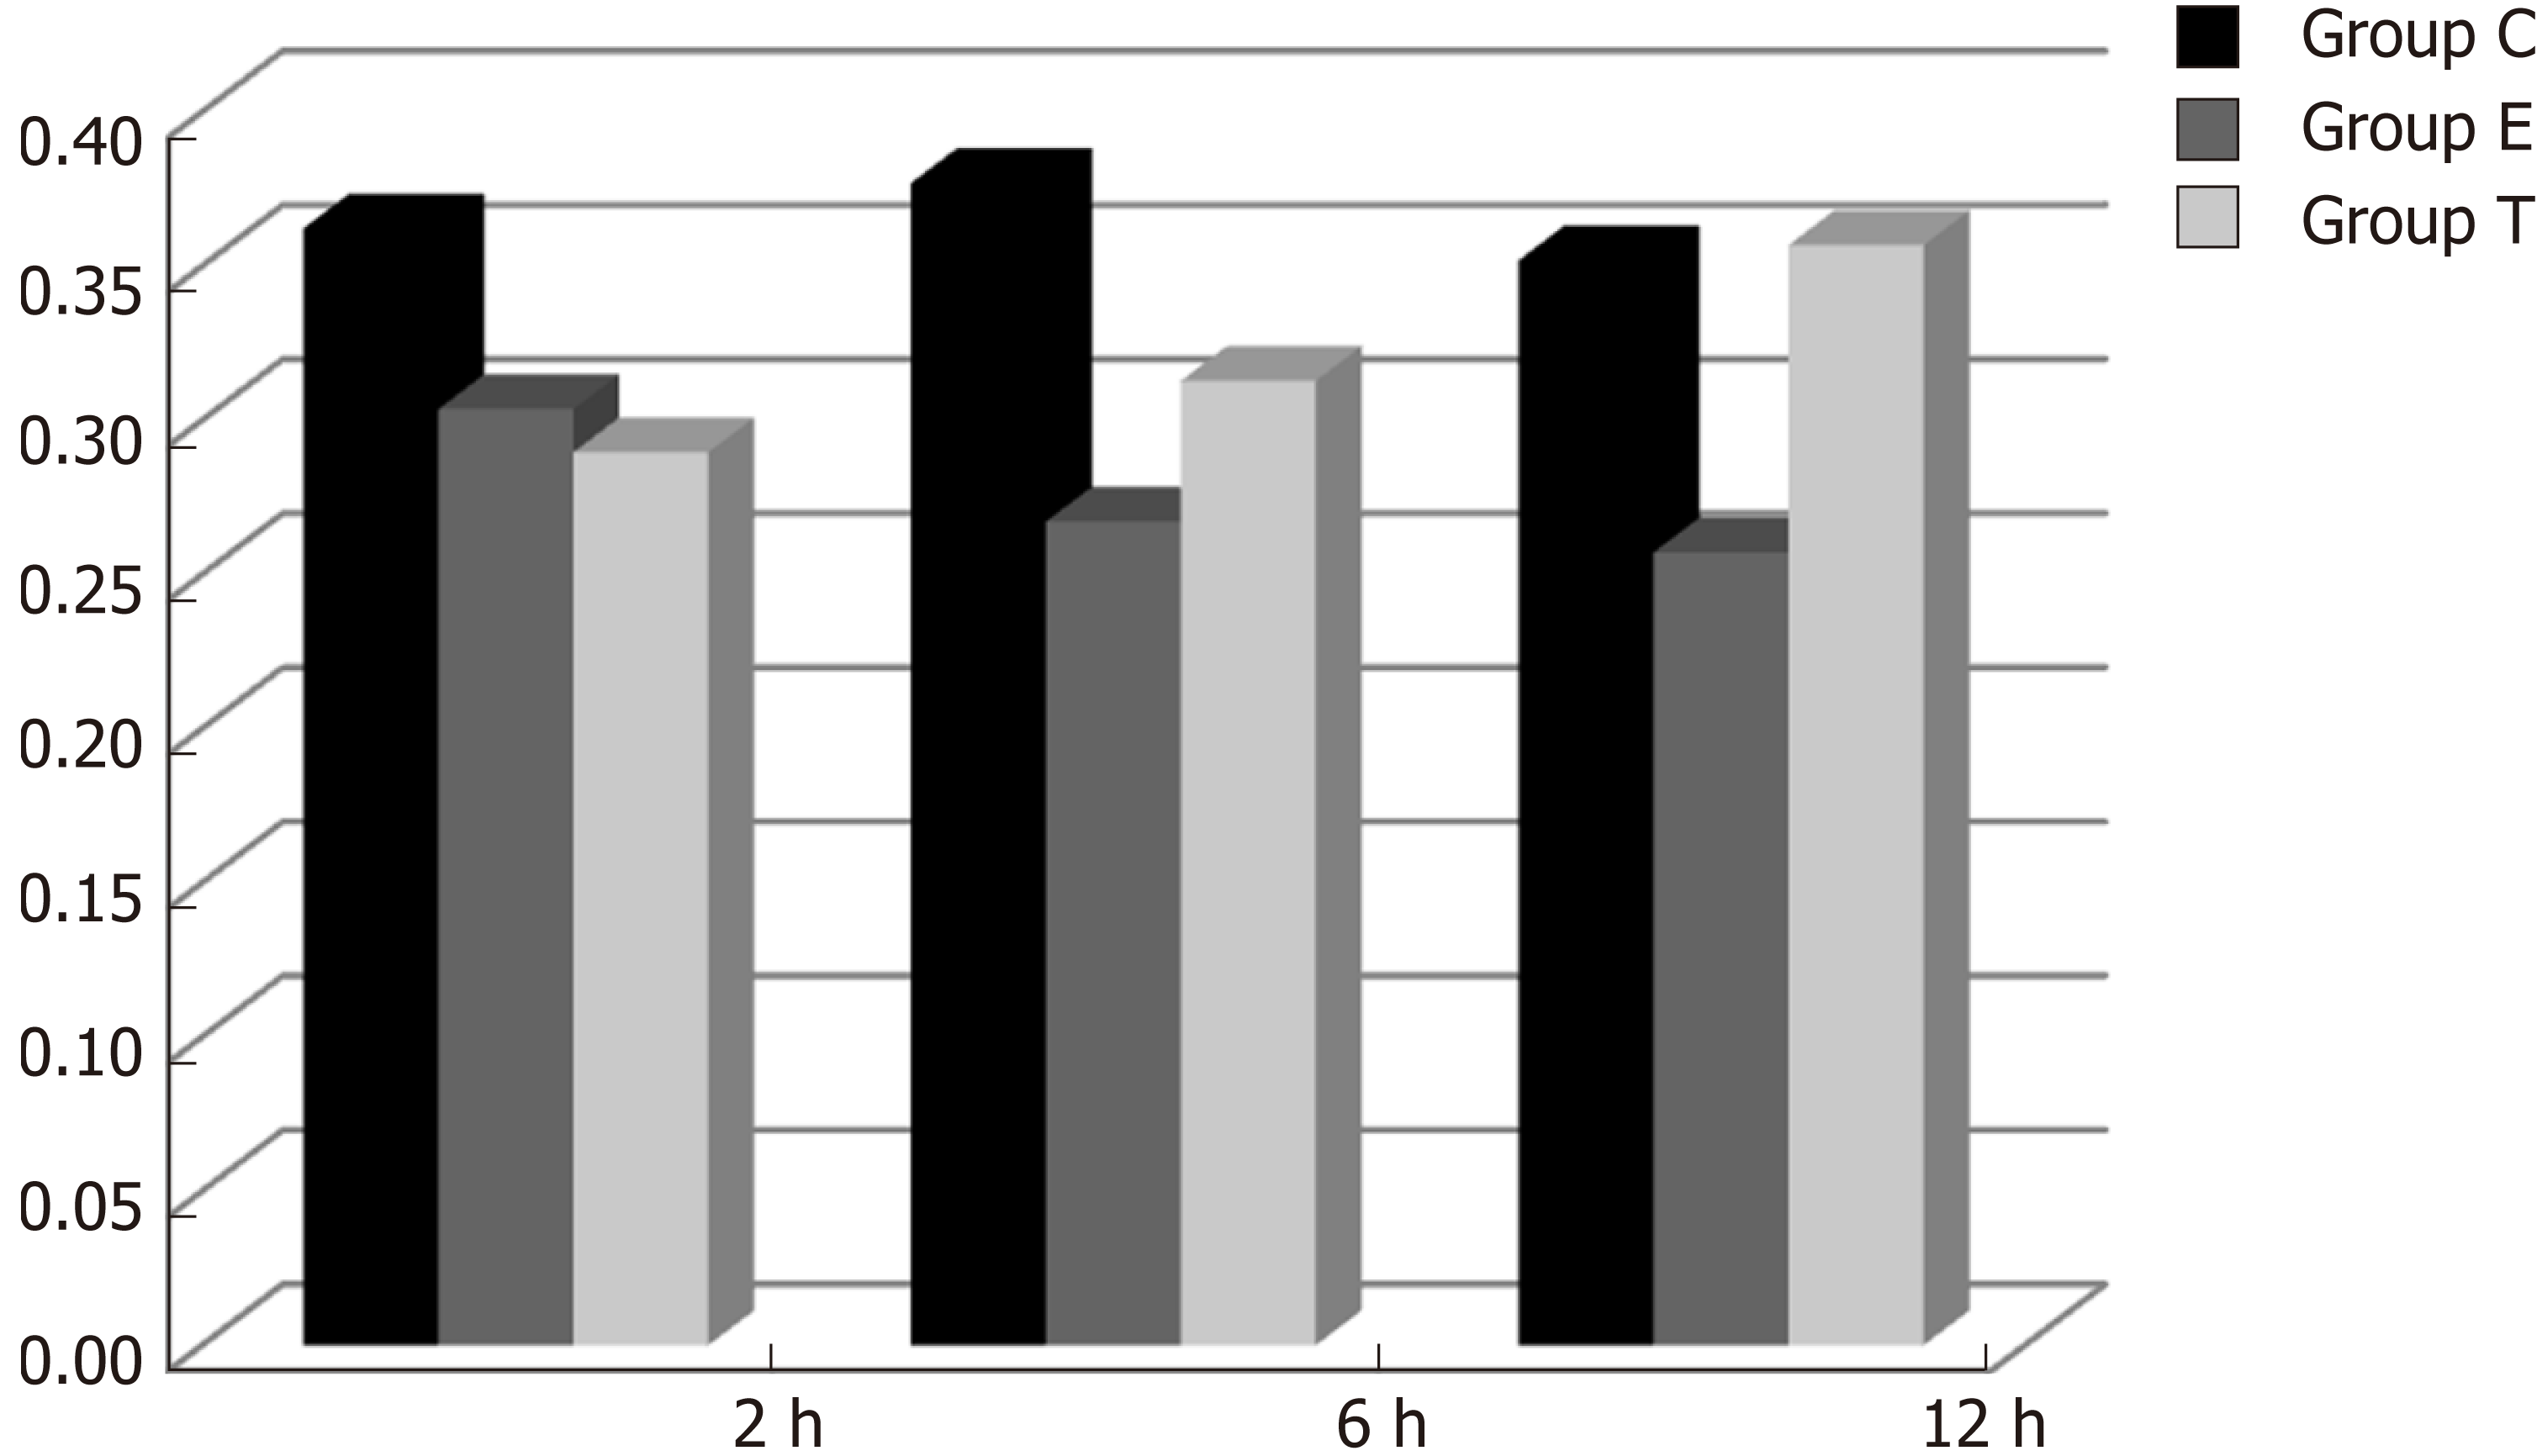
Figure 8 Optical density ratio of insulin-like growth factor 1 mRNA/β-actin mRNA in the ileum (mean ± SD).
- Citation: Wang W, Sun M, Zheng YL, Sun LY, Qu SQ. Effects of Bifidobacterium infantis on cytokine-induced neutrophil chemoattractant and insulin-like growth factor-1 in the ileum of rats with endotoxin injury. World J Gastroenterol 2019; 25(23): 2924-2934
- URL: https://www.wjgnet.com/1007-9327/full/v25/i23/2924.htm
- DOI: https://dx.doi.org/10.3748/wjg.v25.i23.2924


