Copyright
©The Author(s) 2019.
World J Gastroenterol. Jun 7, 2019; 25(21): 2623-2635
Published online Jun 7, 2019. doi: 10.3748/wjg.v25.i21.2623
Published online Jun 7, 2019. doi: 10.3748/wjg.v25.i21.2623
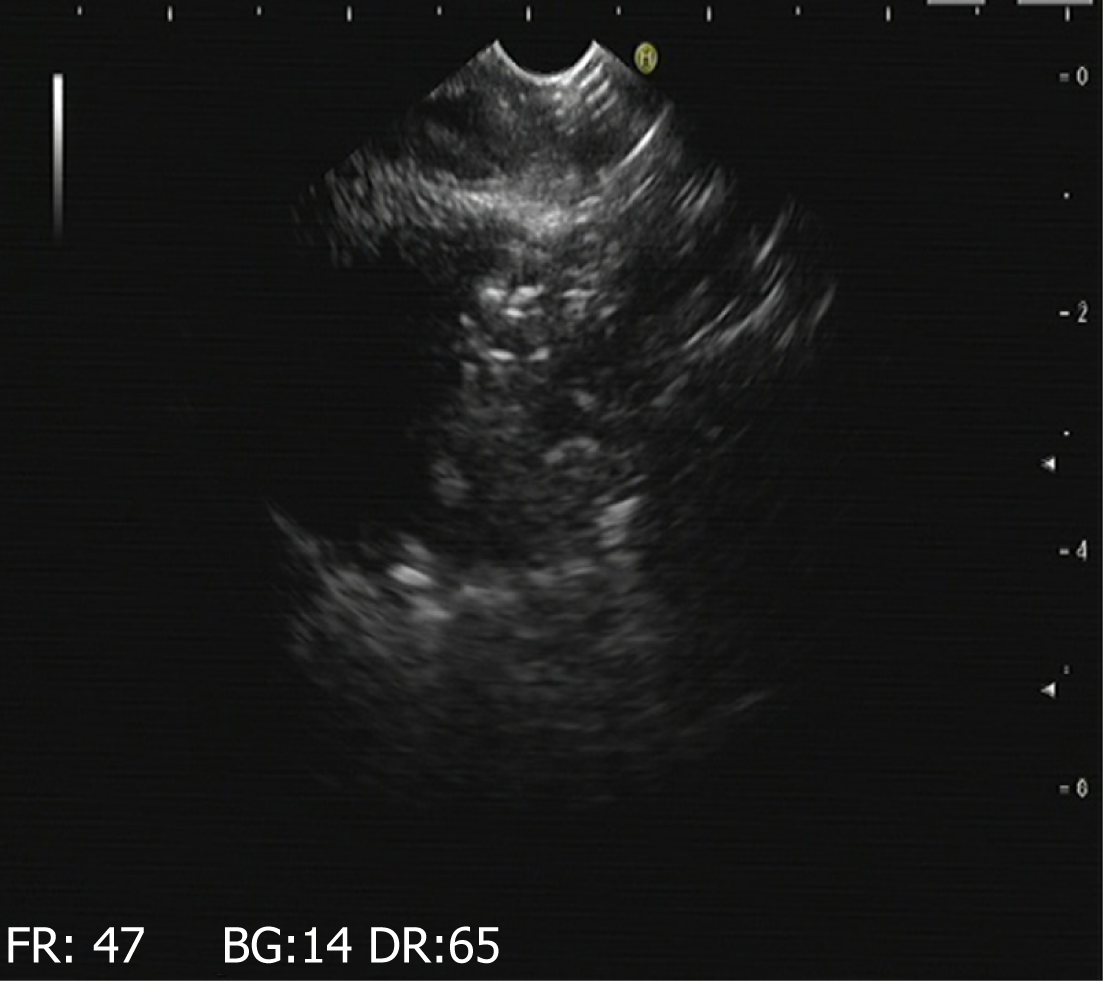
Figure 1 Endoscopic ultrasound-guided fine needle puncture of the pancreatic tail through the stomach wall and injection of a small amount of methylene blue liquid.
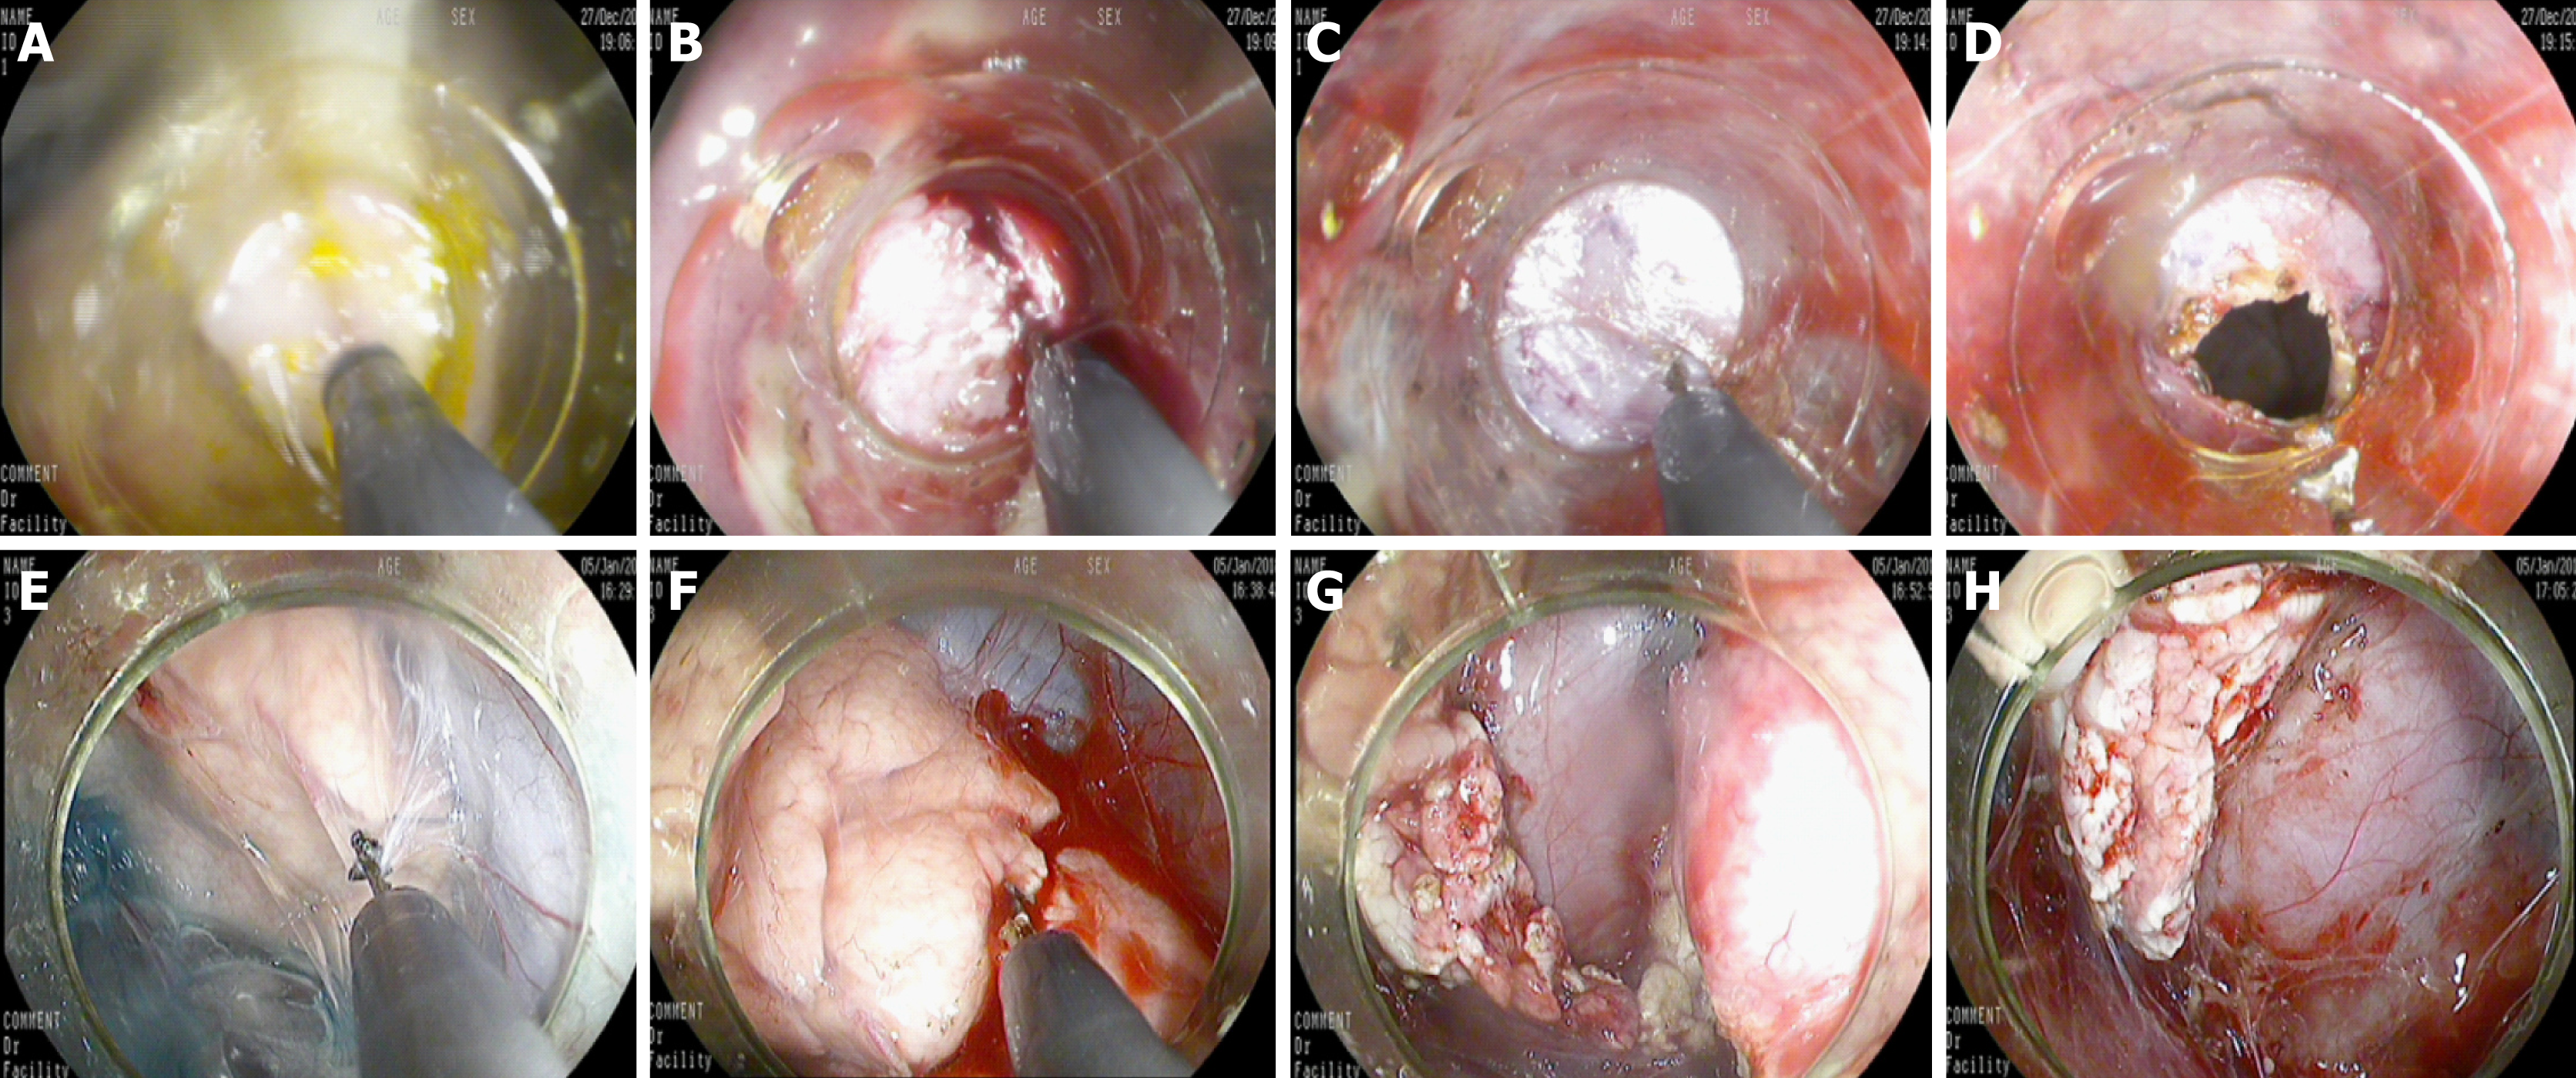
Figure 2 The mucosal, submucosal, and muscular layers were sequentially cut with a triangular knife until the retroperitoneum was reached.
A: The incising of the mucosa of the gastric wall; B: The incising of the submucosa of the gastric wall; C: The incising of the muscular layer of the gastric wall; D: The incising of the serosal layer of the gastric wall; E: The separation of the pancreatic capsule; F: The incision of the parenchyma of the pancreatic body and tail; G: Cutting the pancreatic tail; H: The residual pancreatic body wound after removal of the pancreatic tail.
Figure 3 An inflation experiment was conducted to determine whether the wound was completely closed.
A: Using multiple metal clips to close the pancreatic wound; B: Closure of the gastric wound with metal clips.
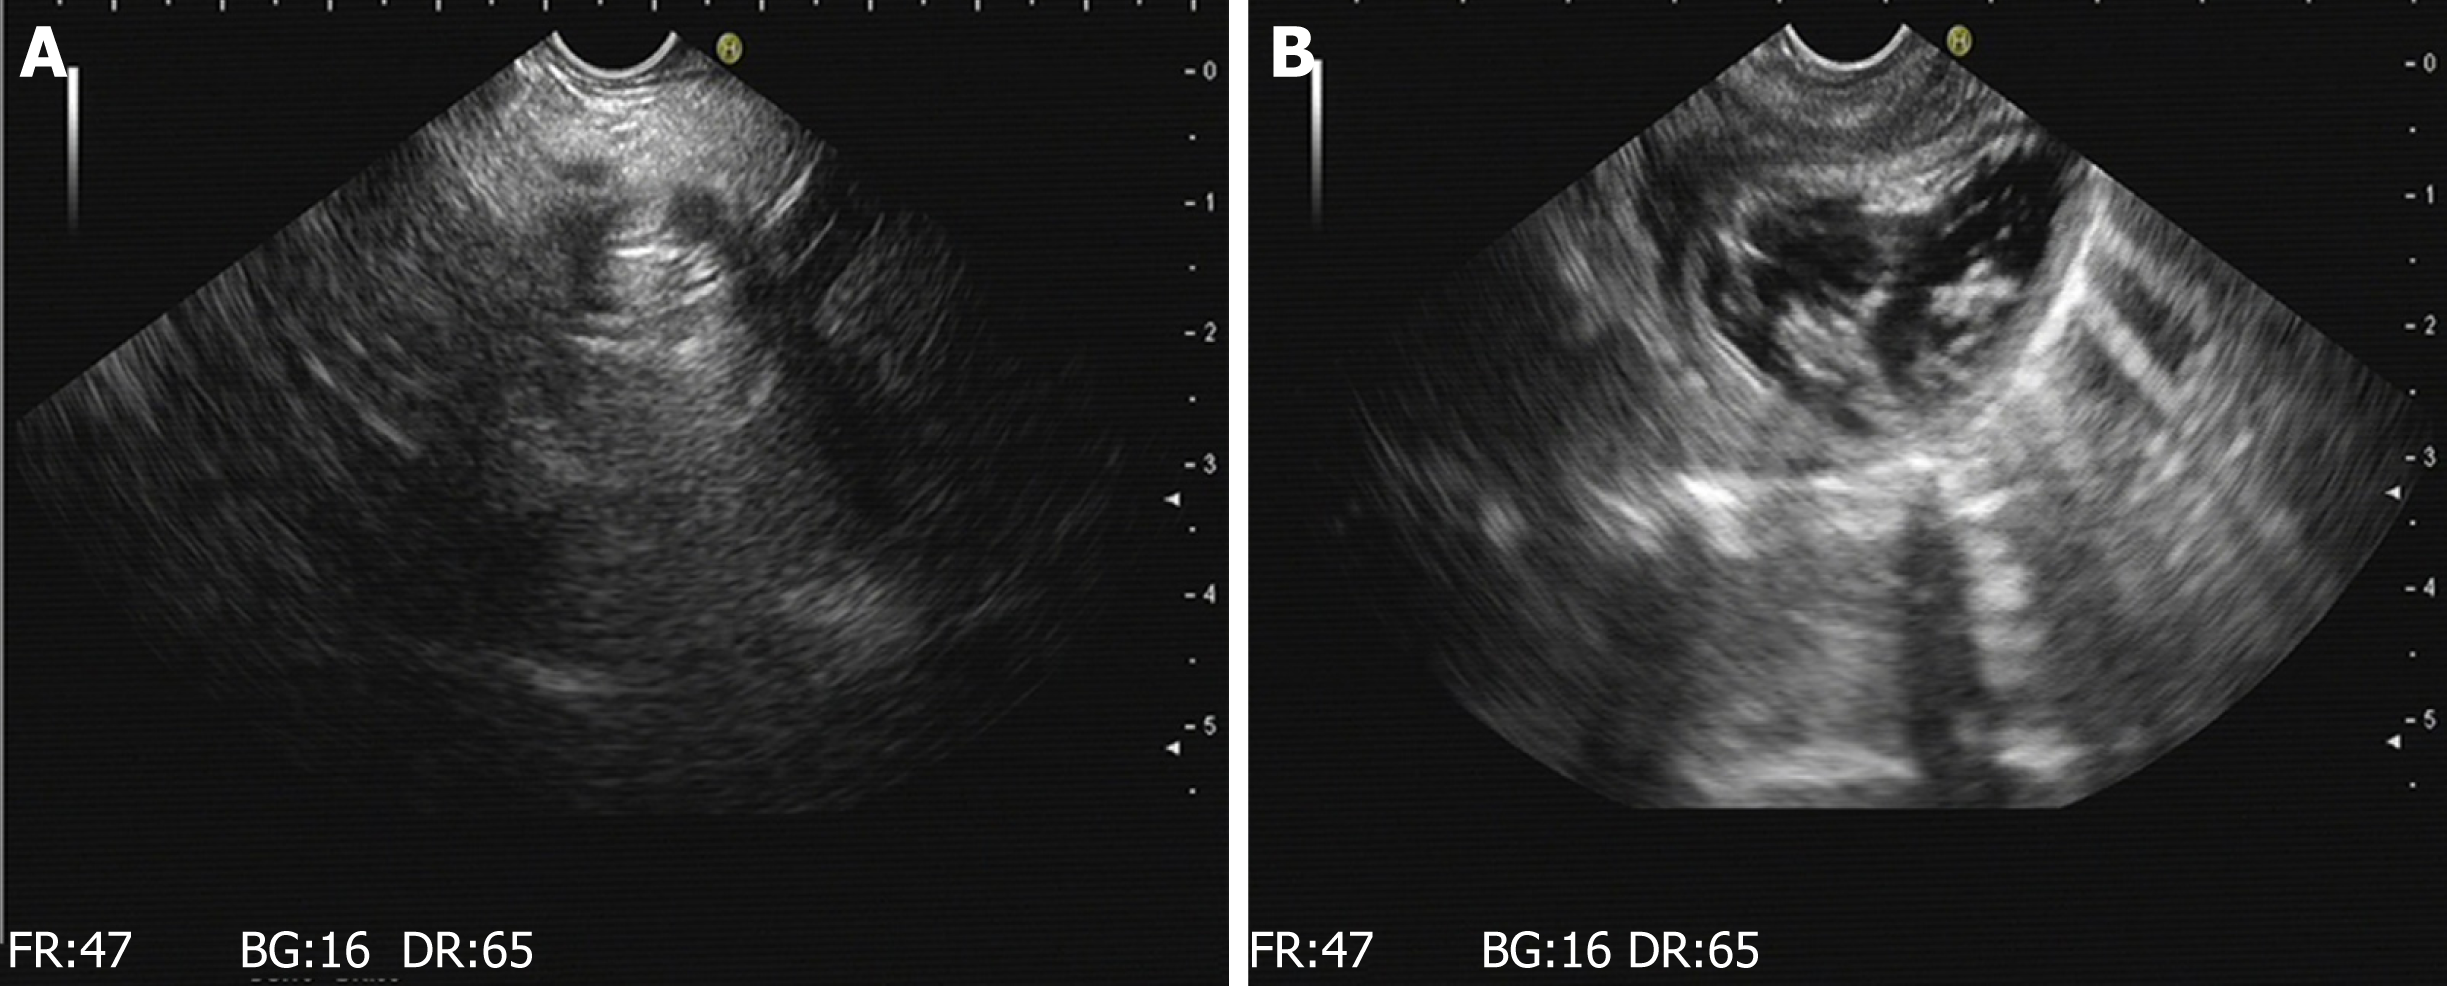
Figure 4 Results of gastroscopy and endoscopic ultrasound at 7 d.
A: Endoscopic ultrasonographic image obtained 7 d after surgery in experimental group one shows that a hyperechoic light mass near the pancreas is visible with the "comet tail sign.” B: Endoscopic ultrasonographic image obtained 7 d after surgery in experimental group two reveals effusions around the pancreas with a hyperechoic mass with the "comet tail sign”.
Figure 5 Adhesive bandages between the posterior wall of the stomach and the retroperitoneal tissues at 3 d, 7 d, and 14 d postoperatively, respectively.
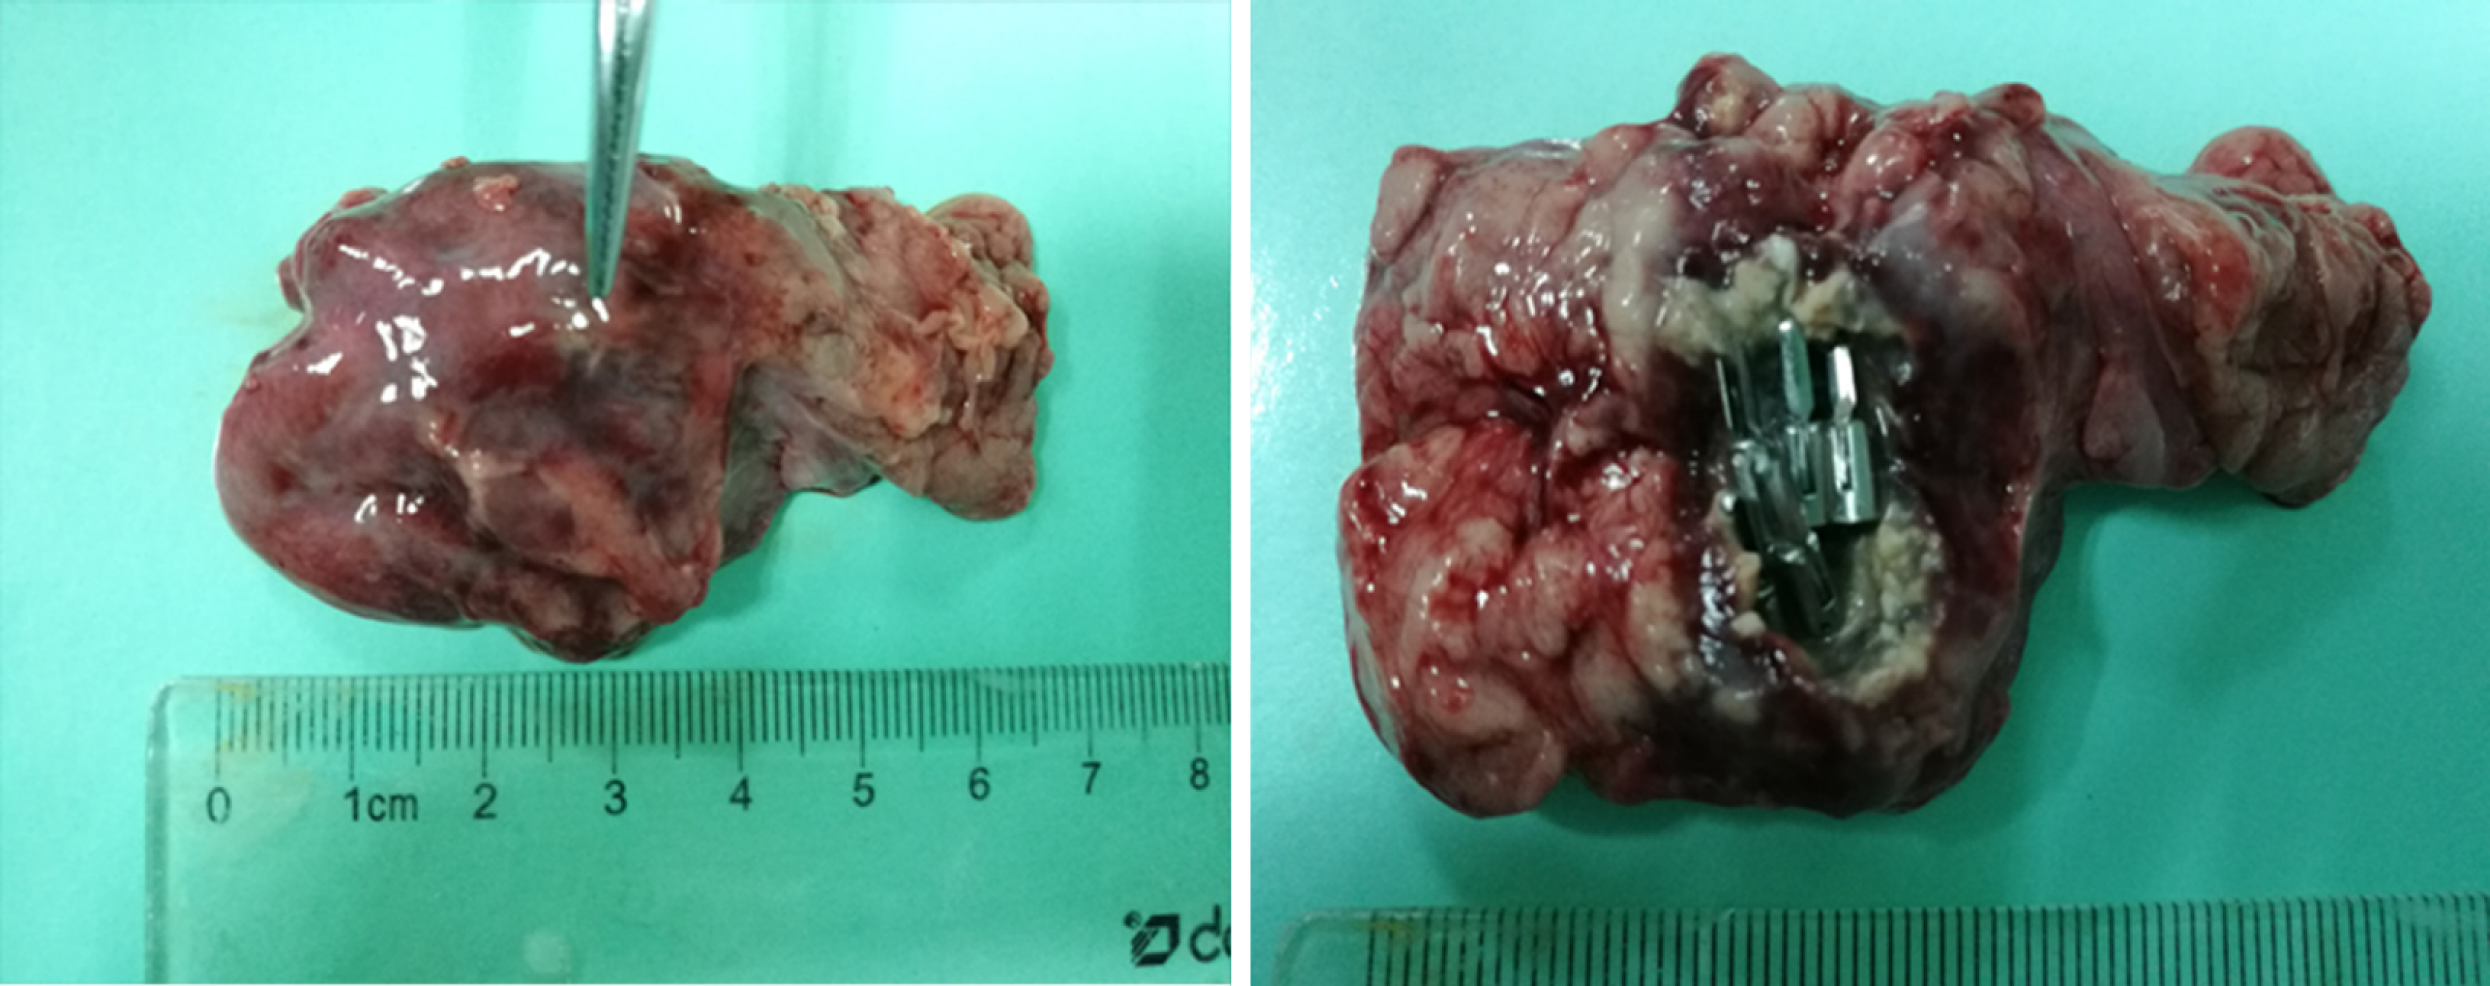
Figure 6 No definite scar was visible to the naked eye in animals sacrificed at 7 d and 14 d postoperatively, and the metal clip was visible outside the pancreas.
A: In group one, the metal clips were all present and exposed in the pancreatic wound of the experimental animals sacrificed 7 d after the operation. B and C: The pancreatic wounds enclosed by visible white scar tissue and metal clips were seen in the exposed wound in experimental animals sacrificed 14 d after surgery.
Figure 7 In the group two experimental animals sacrificed 14 d after surgery, the pancreatic wound surface was locally swollen and the metal clips were covered with scar tissue to form a cystic cavity.
The surface of the pancreas was incised to expose the wound.
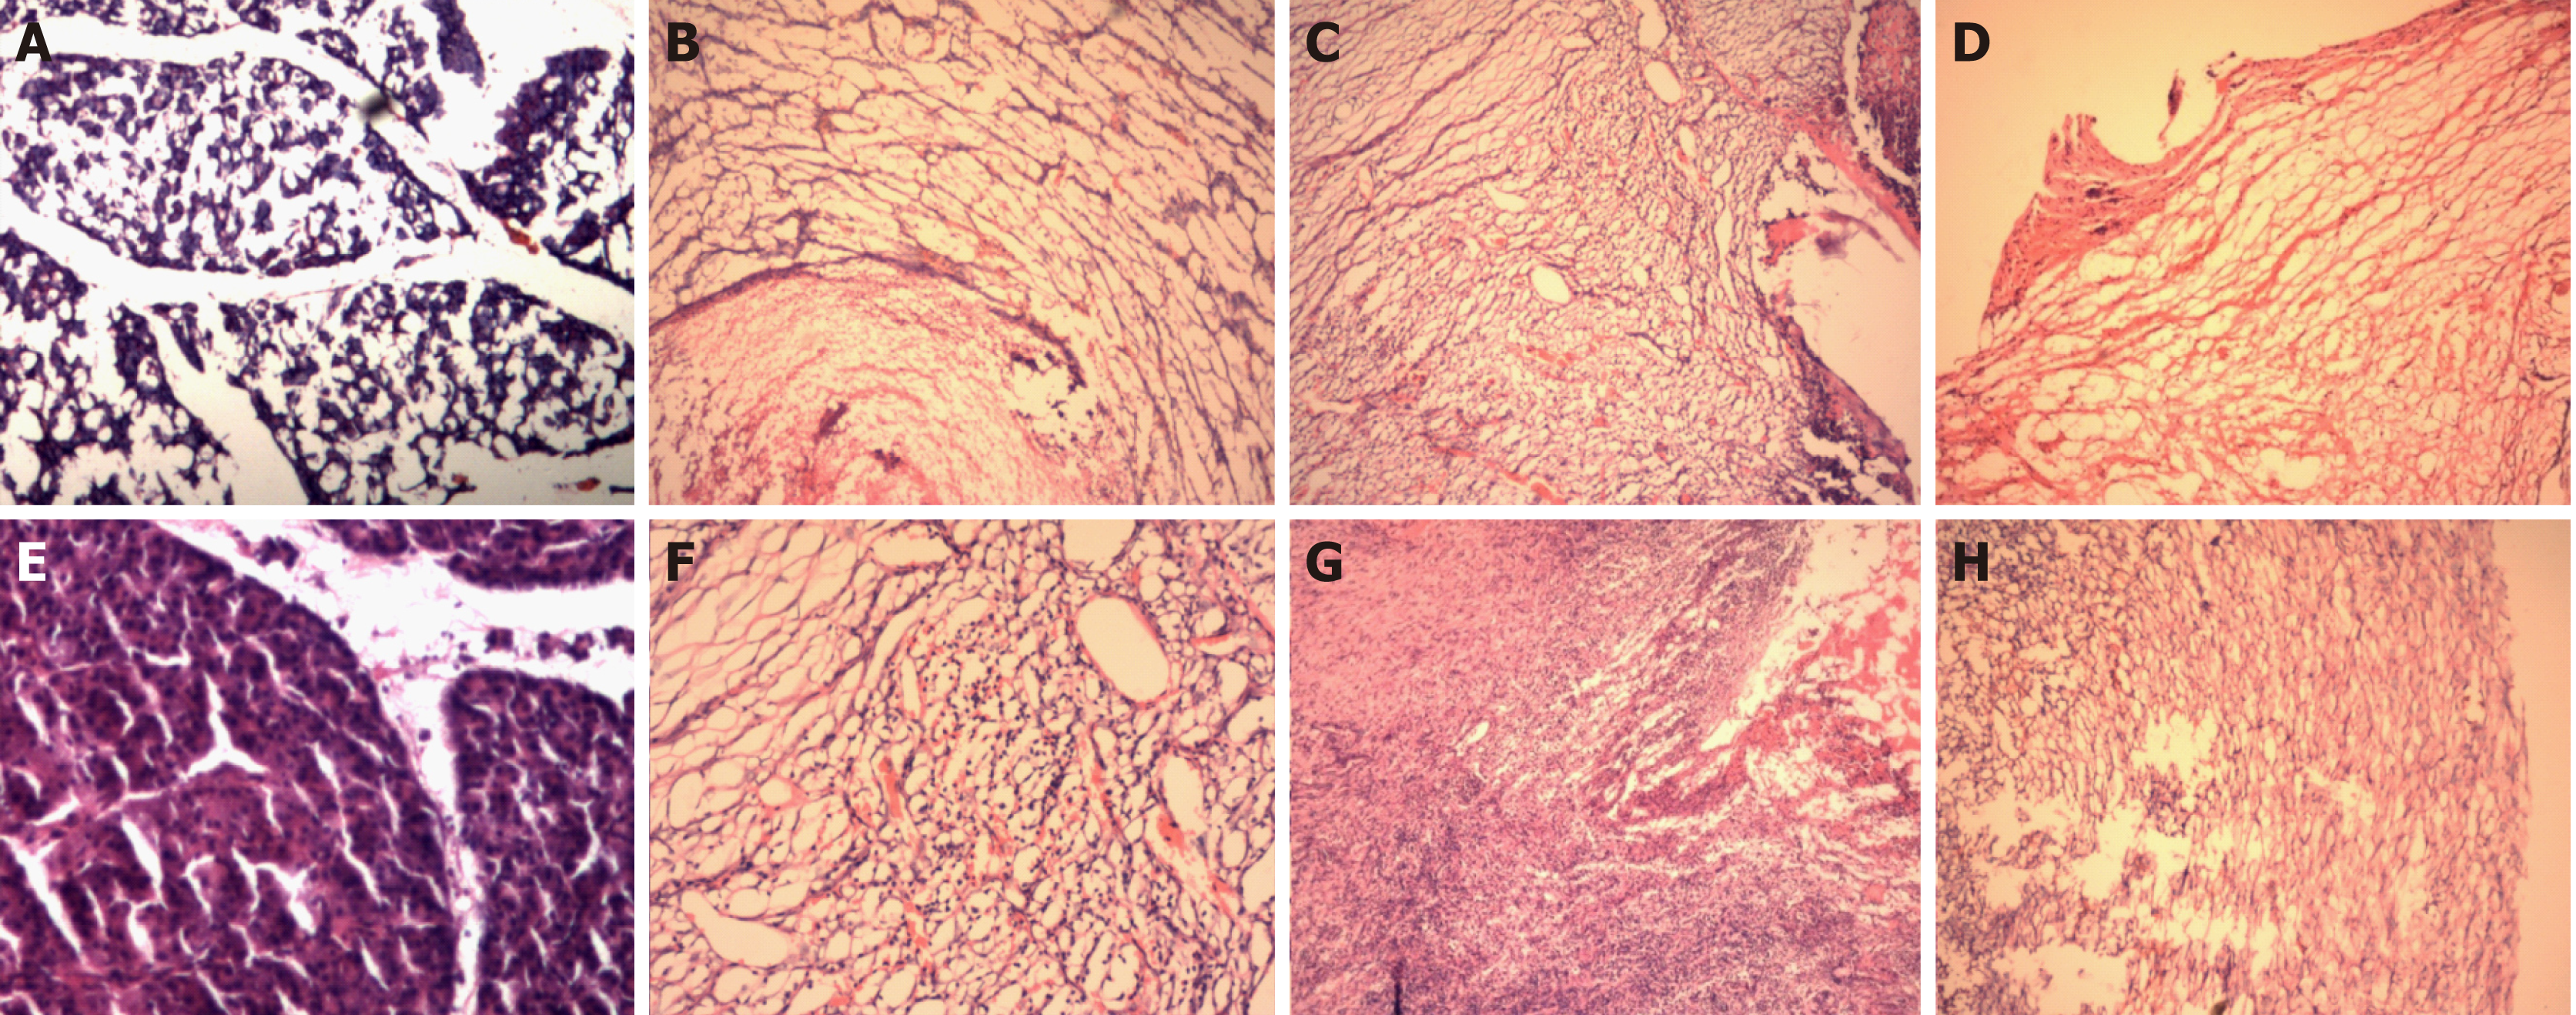
Figure 8 Hematoxylin and eosin staining.
A: Hematoxylin and eosin (HE) staining of the normal pancreas in the control group (40×); B: HE stained image (40×) on the 3rd day postoperatively in experimental group one; C: HE stained image (40×) on the 7th day postoperatively in experimental group one. D: HE stained image (40×) on the 14th day postoperatively in experimental group one. E: HE staining of the normal pancreas in the control group (40×); F: HE stained image (40×) on the 3rd day postoperatively in experimental group two; G: HE stained image (40×) on the 7th day postoperatively in experimental group two. H: HE stained image (40×) on the 14th day postoperatively in experimental group two.
Figure 9 Immunohistochemical staining.
A: Immunohistochemical staining for transforming growth factor (TGF)-β1 at baseline (400×); B: Expression of TGF-β1 on the 3rd day postoperatively (400×), C: Expression of TGF-β1 on the 7th day postoperatively (400×). D: Expression of TGF-β1 at 14 d after surgery (400×). E: Immunohistochemical staining for Smad3 at baseline (400×), F: Expression of Smad3 at 3 d postoperatively (400×). G: Expression of Smad3 at 7 d postoperatively (400×). H: Expression of Smad3 at 14 d postoperatively (400×). I: Immunohistochemical staining for Smad7 at baseline (400×). J: Expression of Smad7 at 3 d postoperatively (400×). K: Expression of Smad7 at 7 d postoperatively (400×). L: Expression of Smad7 at 14 d postoperatively (400×).
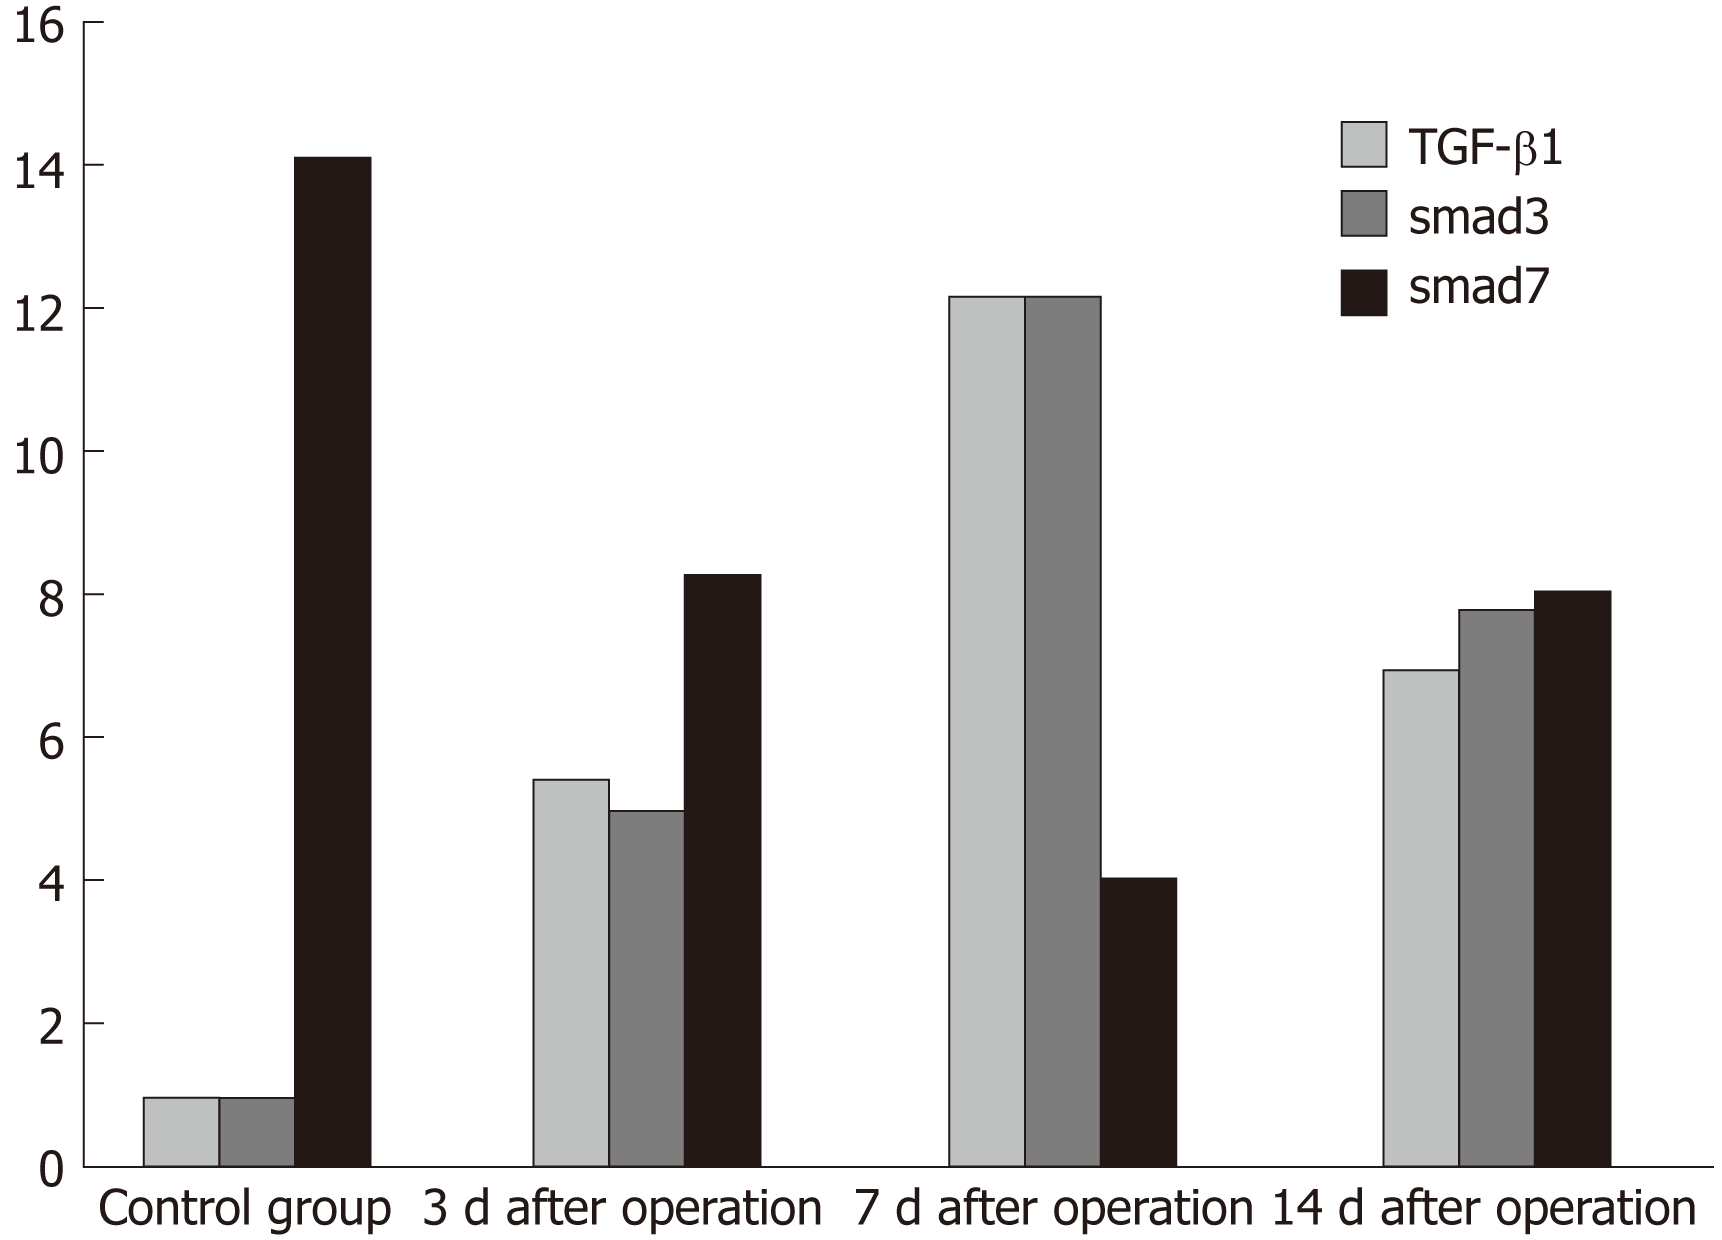
Figure 10 Immunohistochemical scores of transforming growth factor-β1, Smad3, and Smad7.
Transforming growth factor-β1 was negatively expressed in the control group and began to rise after pancreatic resection. The expression was the highest at 7 d after surgery and then decreased; Smad3 showed negative expression in the control group and began to rise after pancreatic resection. The highest level occurred at 7 d after surgery, followed by a downward trend; Smad7 was highly expressed in the control group, gradually decreased after surgery, and was expressed the least on the 7th day after surgery, then showing a trend of recovery. TGF-β1: Transforming growth factor-β1.
- Citation: Wang S, Zhang K, Hu JL, Wu WC, Liu X, Ge N, Guo JT, Wang GX, Sun SY. Endoscopic resection of the pancreatic tail and subsequent wound healing mechanisms in a porcine model. World J Gastroenterol 2019; 25(21): 2623-2635
- URL: https://www.wjgnet.com/1007-9327/full/v25/i21/2623.htm
- DOI: https://dx.doi.org/10.3748/wjg.v25.i21.2623


