Copyright
©The Author(s) 2019.
World J Gastroenterol. May 28, 2019; 25(20): 2503-2513
Published online May 28, 2019. doi: 10.3748/wjg.v25.i20.2503
Published online May 28, 2019. doi: 10.3748/wjg.v25.i20.2503
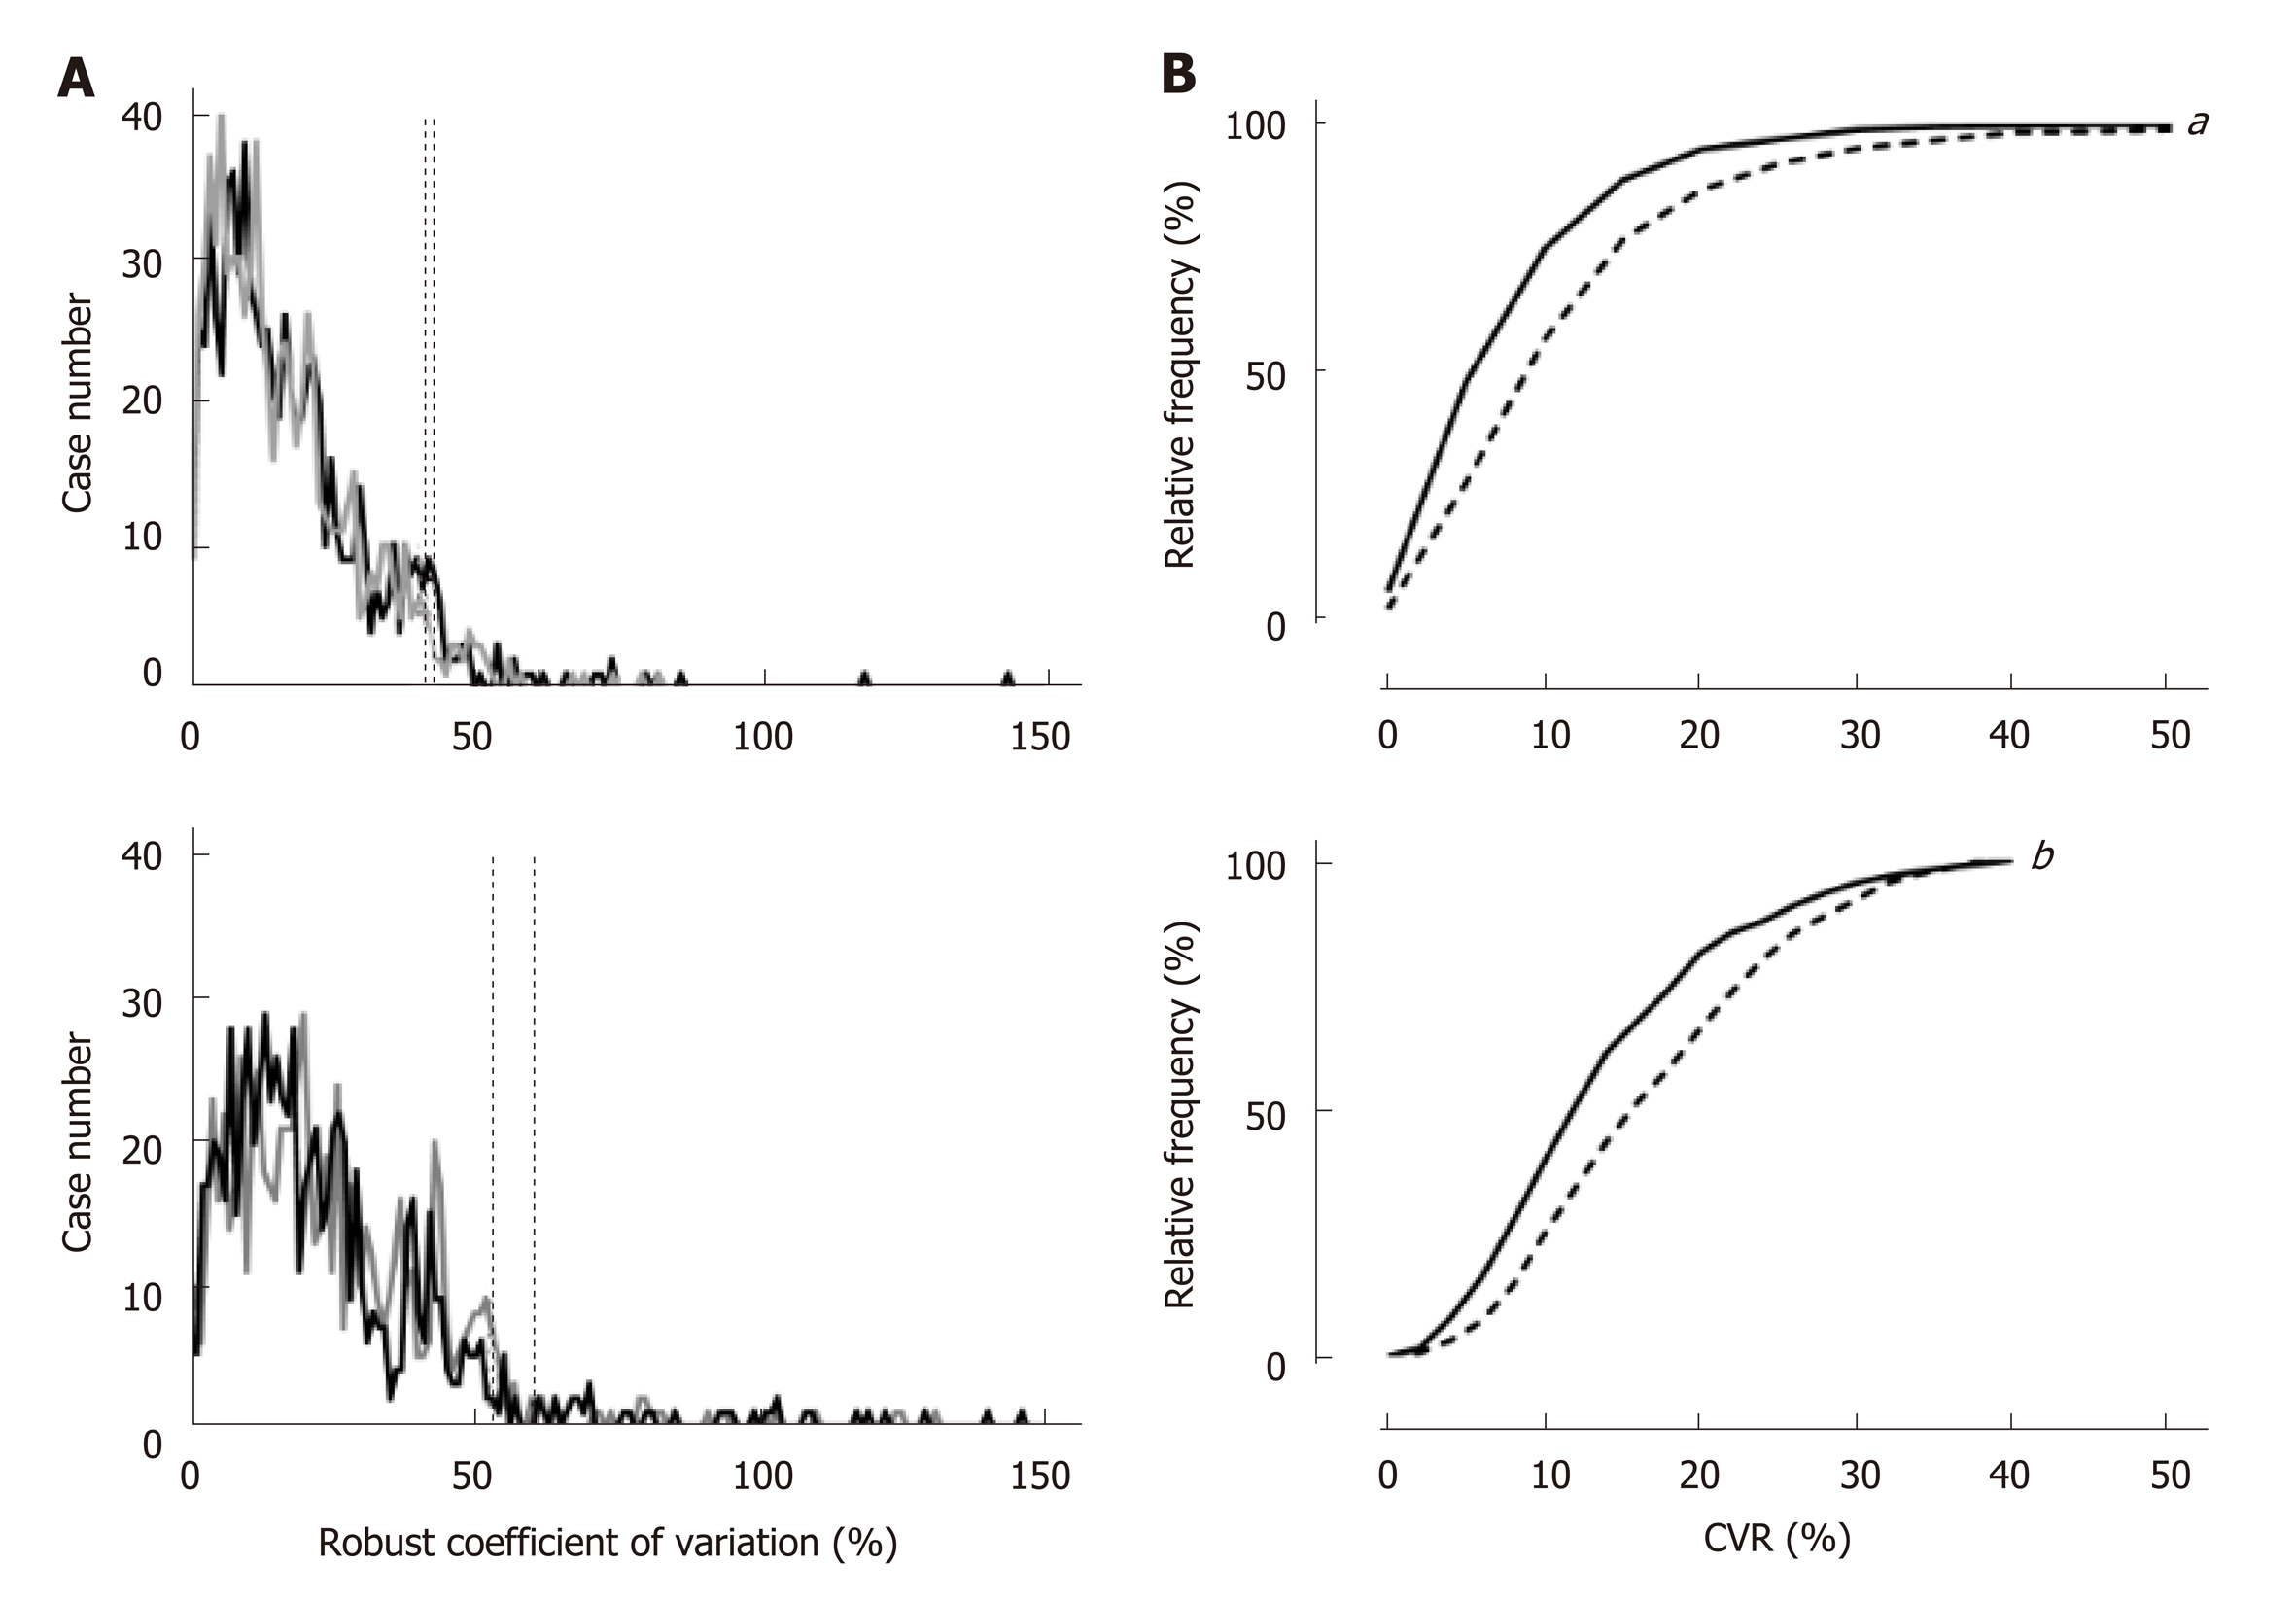
Figure 1 Distribution of robust coefficient-of-variation among the cases.
A: As shown in the upper panel, the lowest coefficient-of-variation (CVR) that covers 95% of cases was 42.1% (black dotted line) and 40.4% (gray dotted line) in right posterior (black line) and anterior segments (gray line), respectively, while the lower panel shows that 60.4% (black dotted line) and 52.8% (gray dotted line) of the CVR are required in the left medial (black line) and lateral (gray dotted line) segments, respectively. B: The cumulative distribution of the CVR was significantly different between the right (continuous line) and left (dotted line) lobes (upper panel, aP < 0.0001), and there is still a significant difference when the subjects are restricted to cases in which the CVR was 40.4% or less in any segment or lobe (lower panel, bP < 0.0001).
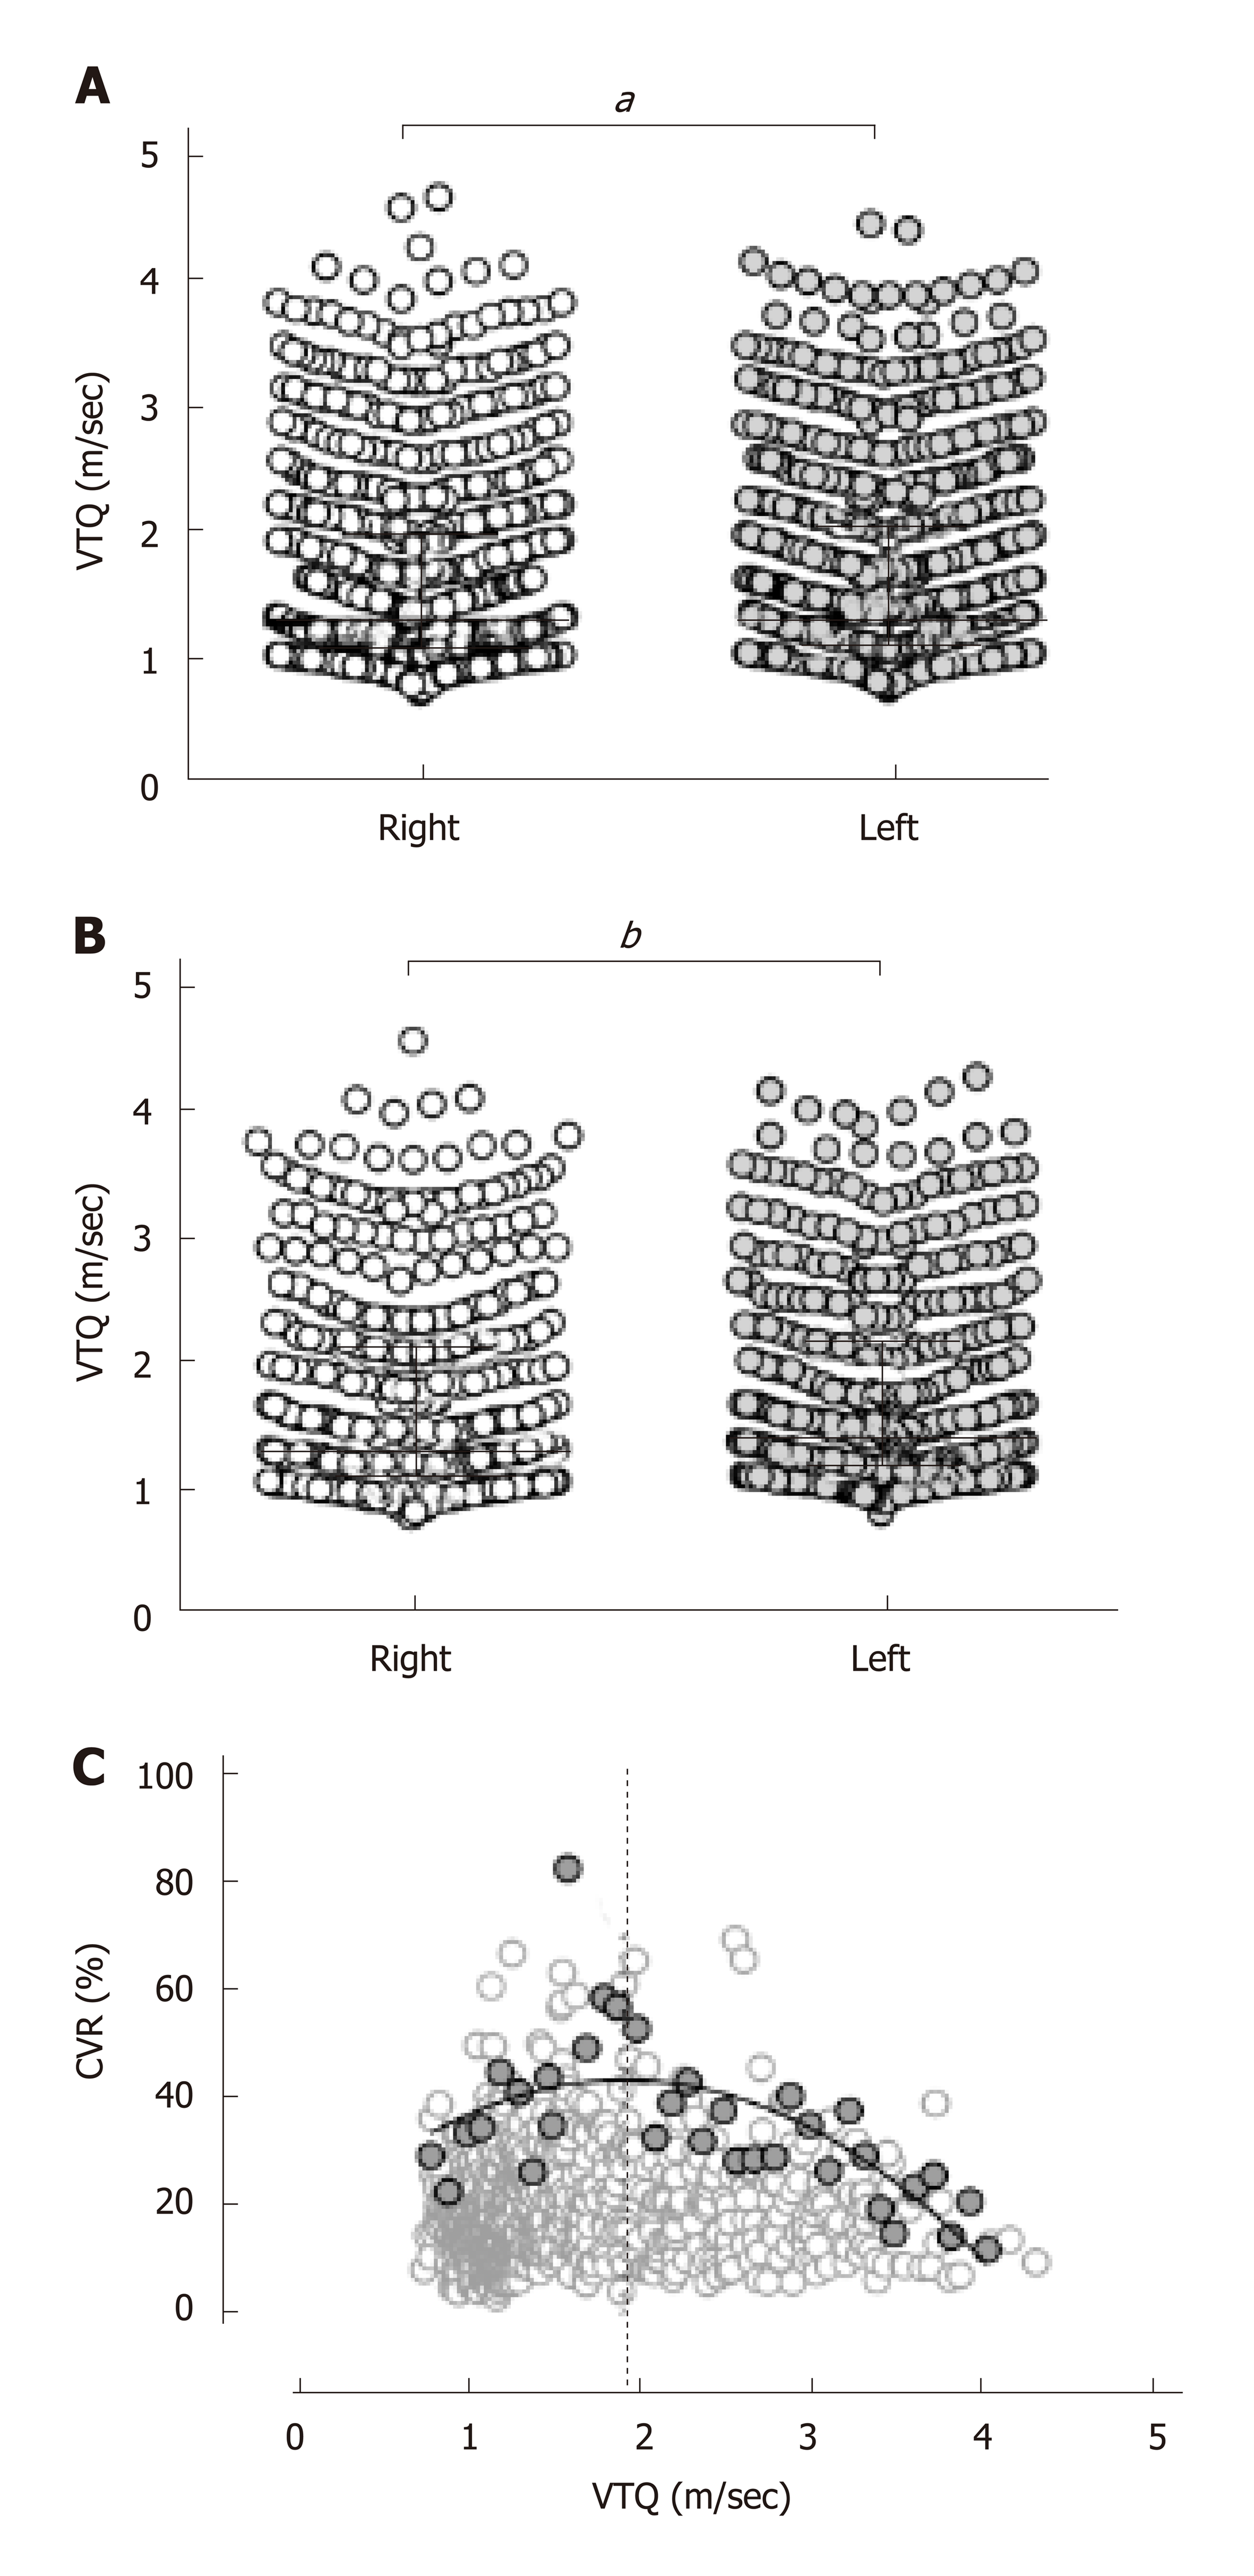
Figure 2 Virtual touch quantification difference between the lobes and alterations of the robust coefficient-of-variation through the progression of liver fibrosis.
A: The virtual touch quantification (VTQ) is significantly higher in the left lobe (1.63 ± 0.78 m/s) than in the right lobe (1.61 ± 0.78 m/s; aP = 0.0004). b. In the limited cases with a coefficient-of-variation (CVR) of 40.4% or less, the VTQ is still significantly higher in the left lobe (1.76 ± 0.80 m/s) than the right lobe (1.70 ± 0.82 m/s; bP < 0.0001). C: For every 0.1 ± 0.02 m/s interval of the VTQ values, 34 CVR values were selected as the highest value in each interval from 0.81 to 4.03 m/sec (gray closed circles) and plotted against the VTQ with the remaining 747 CVR values (open circles). The highest CVR values are scattered in convex upward pattern along the VTQ values with a peak at 1.93 m/s (dotted vertical line).
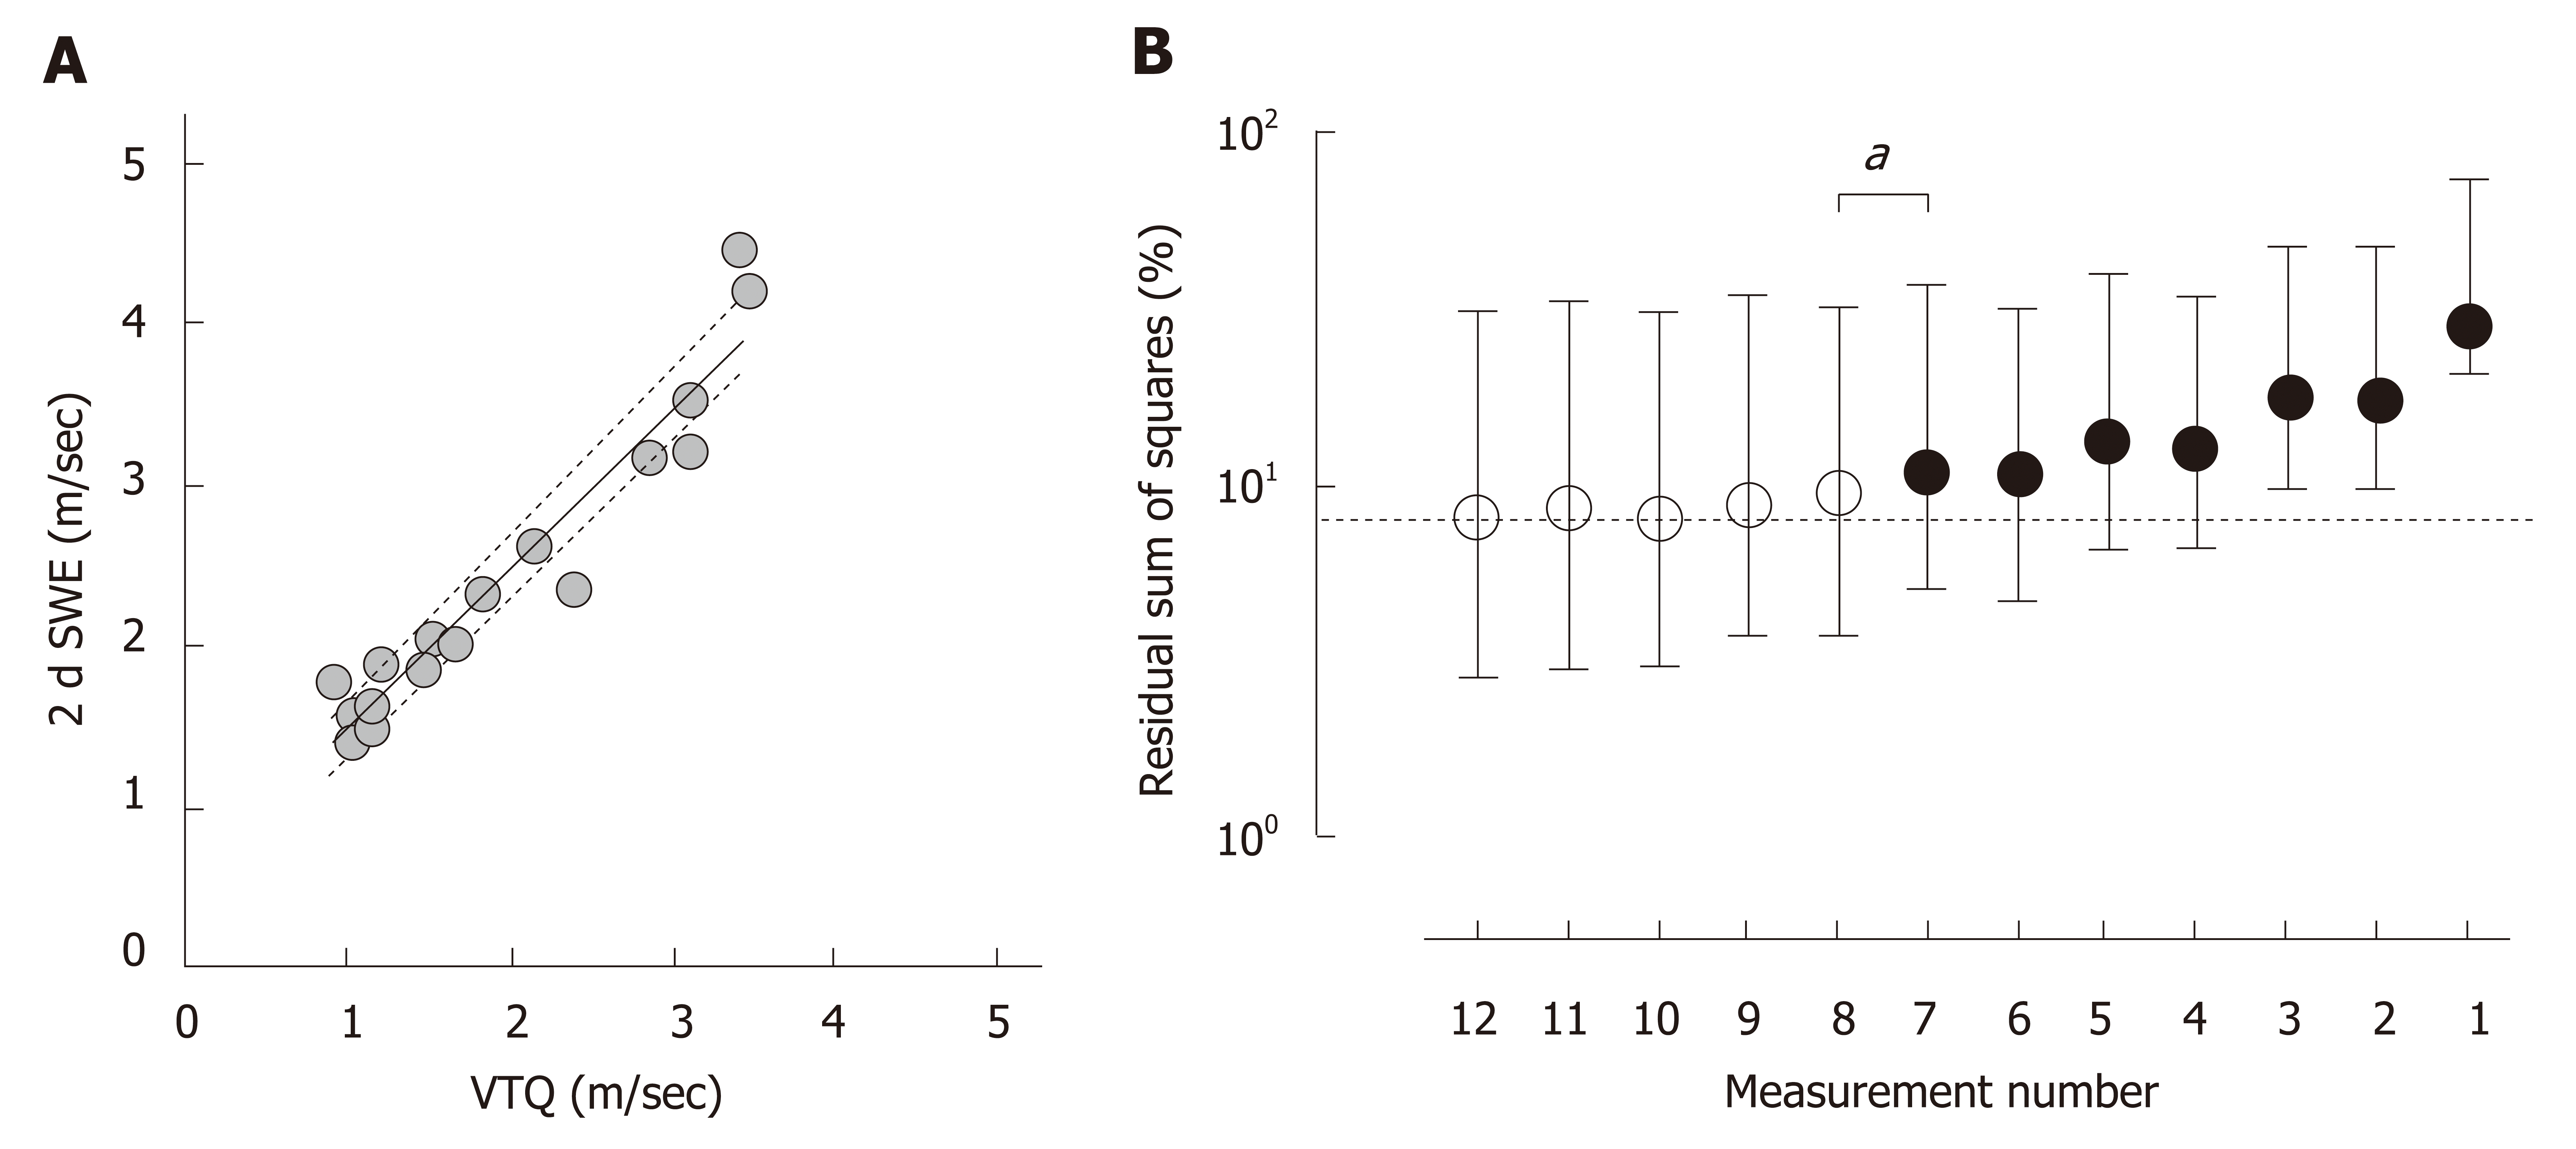
Figure 3 Deviation from an ideal shear wave speed.
A: Virtual touch quantification (VTQ) and 2-dimensional shear wave elastography (2dSWE) were measured on the same day in 18 cases and were significantly correlated with each other (P < 0.0001, r = 0.95). The bold and dotted lines indicate the best hit and 95% confidence bands based on the linear regression model of least-squares. b. A residual sum of squares (%Σdi2) was calculated using 1000 bootstrap resamples with the assumption of measuring the VTQ at 12 sites or fewer in each case and expressed as a percentage against a calculated value from the VTQ based on the linear regression model of least-squares between VTQ and 2dSWE. %Σdi2 increased as the number of acquisition sites were decreased, and the difference of %Σdi2 from that in 12 measurements reached significance as the number of acquisition sites decreased to 7 (bP = 0.027). Circles and horizontal bars indicate medians and interquartile ranges of %Σdi2, respectively. The dotted horizontal line indicates a %Σdi2 of 8.0% in 12 measurements.
- Citation: Yokoo T, Kanefuji T, Suda T, Nagayama I, Hoshi T, Abe S, Morita S, Kamimura H, Kamimura K, Tsuchiya A, Takamura M, Yagi K, Terai S. Rational arrangement of measuring shear wave speed in the liver. World J Gastroenterol 2019; 25(20): 2503-2513
- URL: https://www.wjgnet.com/1007-9327/full/v25/i20/2503.htm
- DOI: https://dx.doi.org/10.3748/wjg.v25.i20.2503


