Copyright
©The Author(s) 2019.
World J Gastroenterol. May 28, 2019; 25(20): 2503-2513
Published online May 28, 2019. doi: 10.3748/wjg.v25.i20.2503
Published online May 28, 2019. doi: 10.3748/wjg.v25.i20.2503
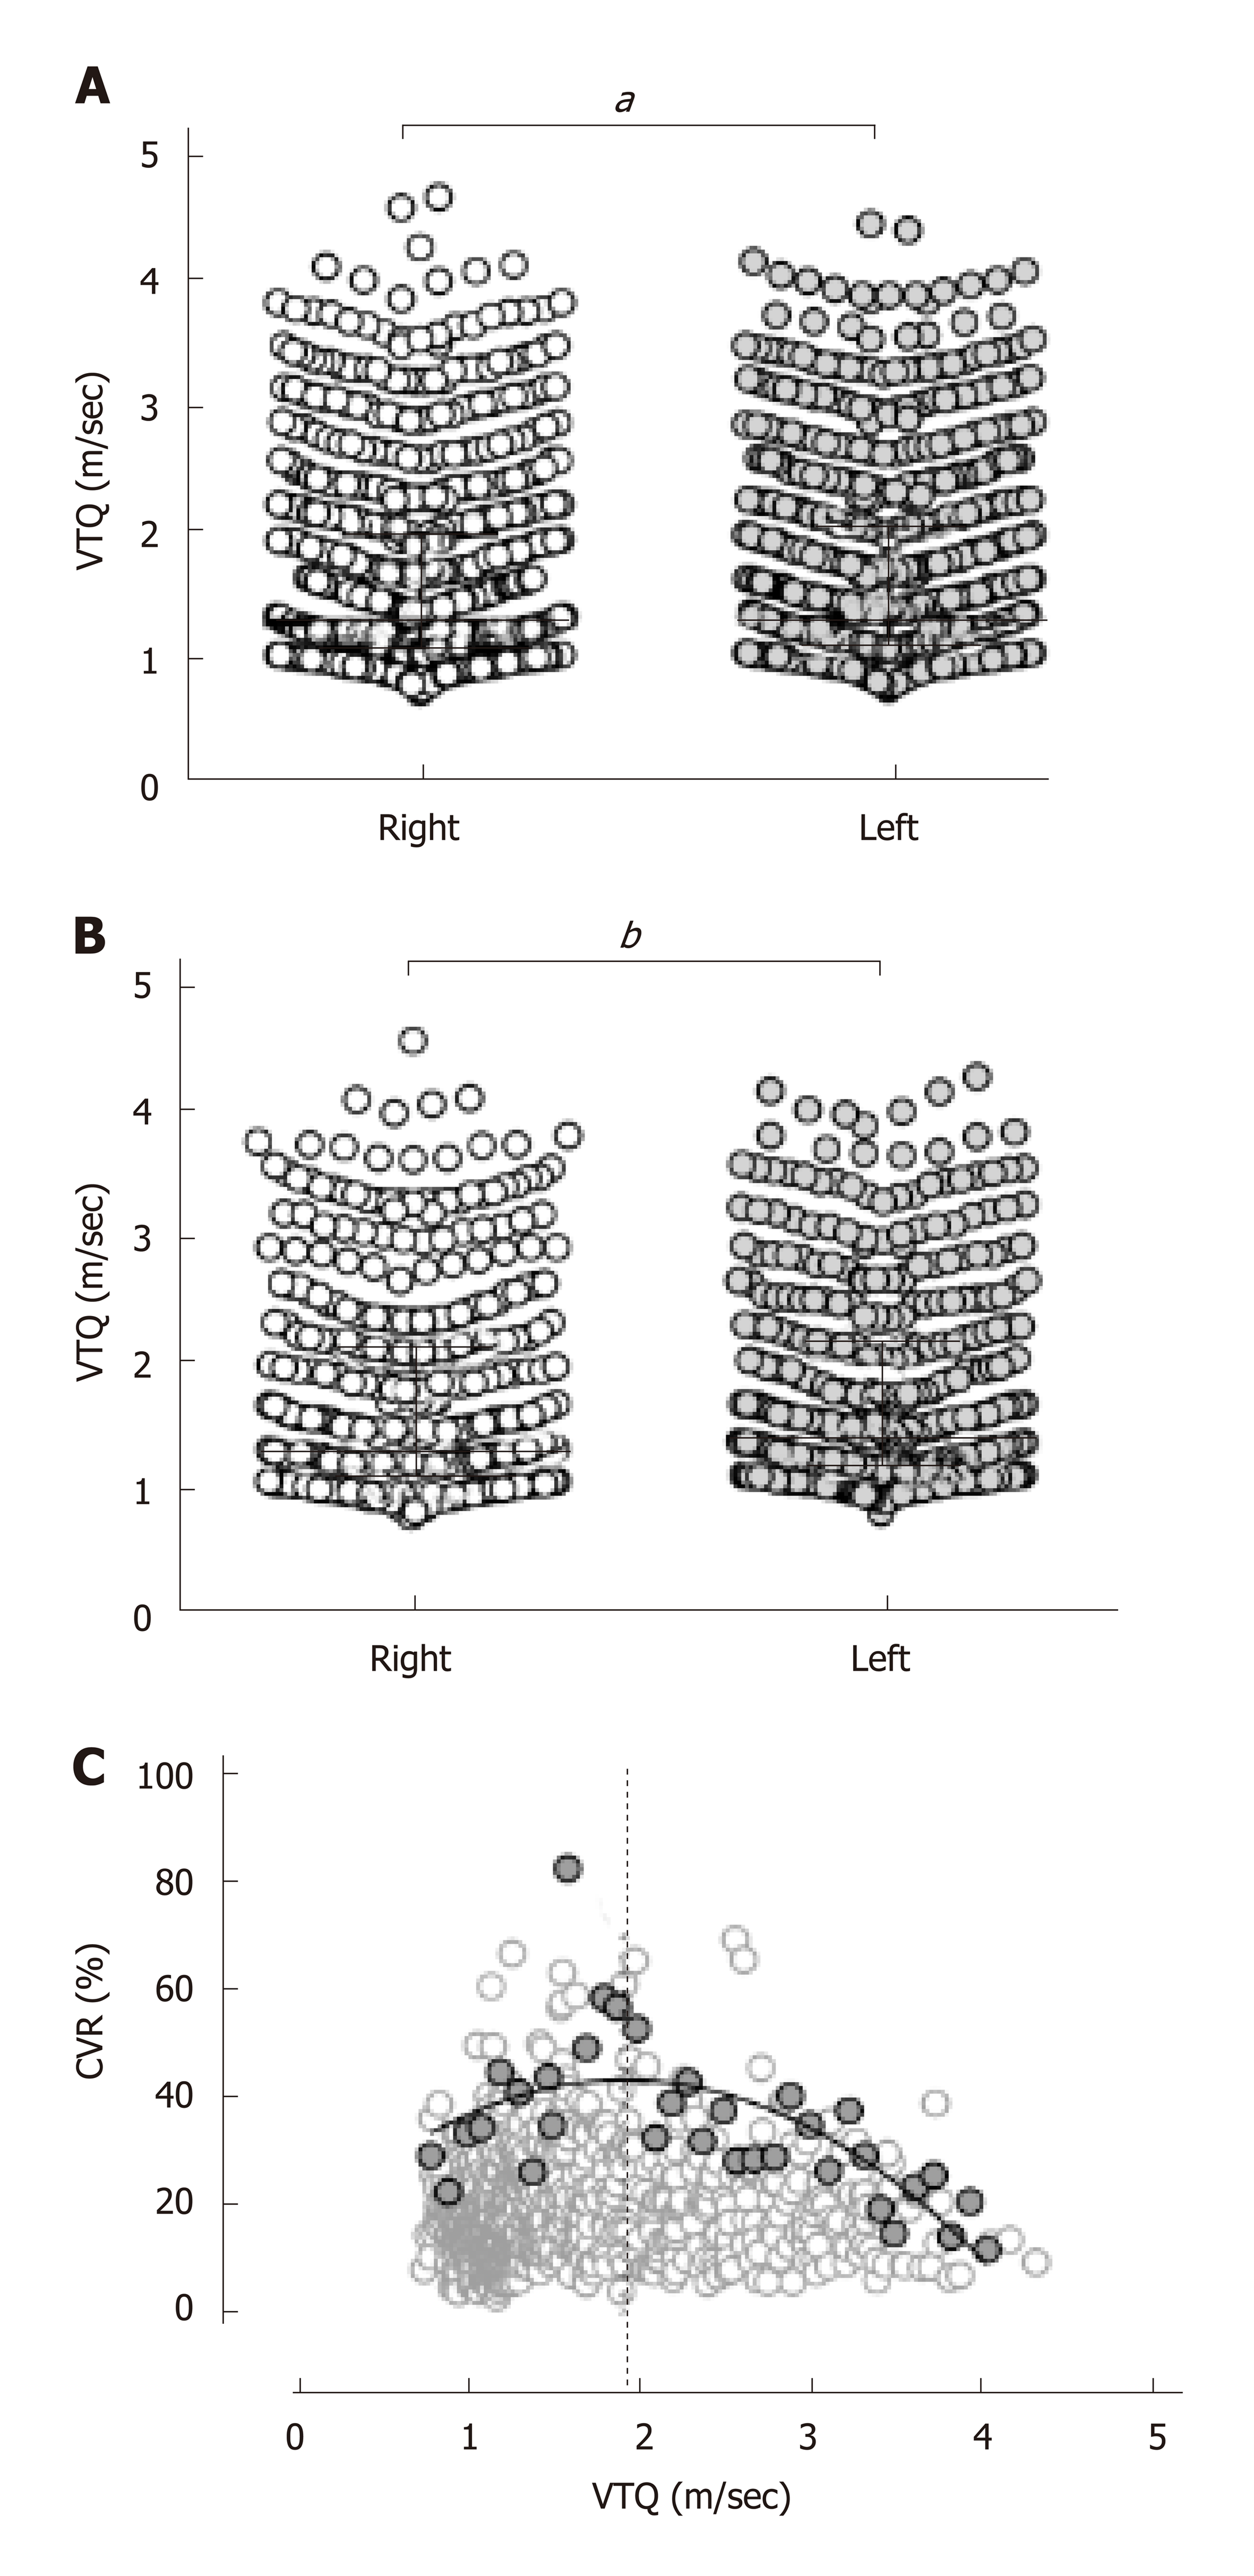
Figure 2 Virtual touch quantification difference between the lobes and alterations of the robust coefficient-of-variation through the progression of liver fibrosis.
A: The virtual touch quantification (VTQ) is significantly higher in the left lobe (1.63 ± 0.78 m/s) than in the right lobe (1.61 ± 0.78 m/s; aP = 0.0004). b. In the limited cases with a coefficient-of-variation (CVR) of 40.4% or less, the VTQ is still significantly higher in the left lobe (1.76 ± 0.80 m/s) than the right lobe (1.70 ± 0.82 m/s; bP < 0.0001). C: For every 0.1 ± 0.02 m/s interval of the VTQ values, 34 CVR values were selected as the highest value in each interval from 0.81 to 4.03 m/sec (gray closed circles) and plotted against the VTQ with the remaining 747 CVR values (open circles). The highest CVR values are scattered in convex upward pattern along the VTQ values with a peak at 1.93 m/s (dotted vertical line).
- Citation: Yokoo T, Kanefuji T, Suda T, Nagayama I, Hoshi T, Abe S, Morita S, Kamimura H, Kamimura K, Tsuchiya A, Takamura M, Yagi K, Terai S. Rational arrangement of measuring shear wave speed in the liver. World J Gastroenterol 2019; 25(20): 2503-2513
- URL: https://www.wjgnet.com/1007-9327/full/v25/i20/2503.htm
- DOI: https://dx.doi.org/10.3748/wjg.v25.i20.2503


