Copyright
©The Author(s) 2019.
World J Gastroenterol. Mar 14, 2019; 25(10): 1248-1258
Published online Mar 14, 2019. doi: 10.3748/wjg.v25.i10.1248
Published online Mar 14, 2019. doi: 10.3748/wjg.v25.i10.1248
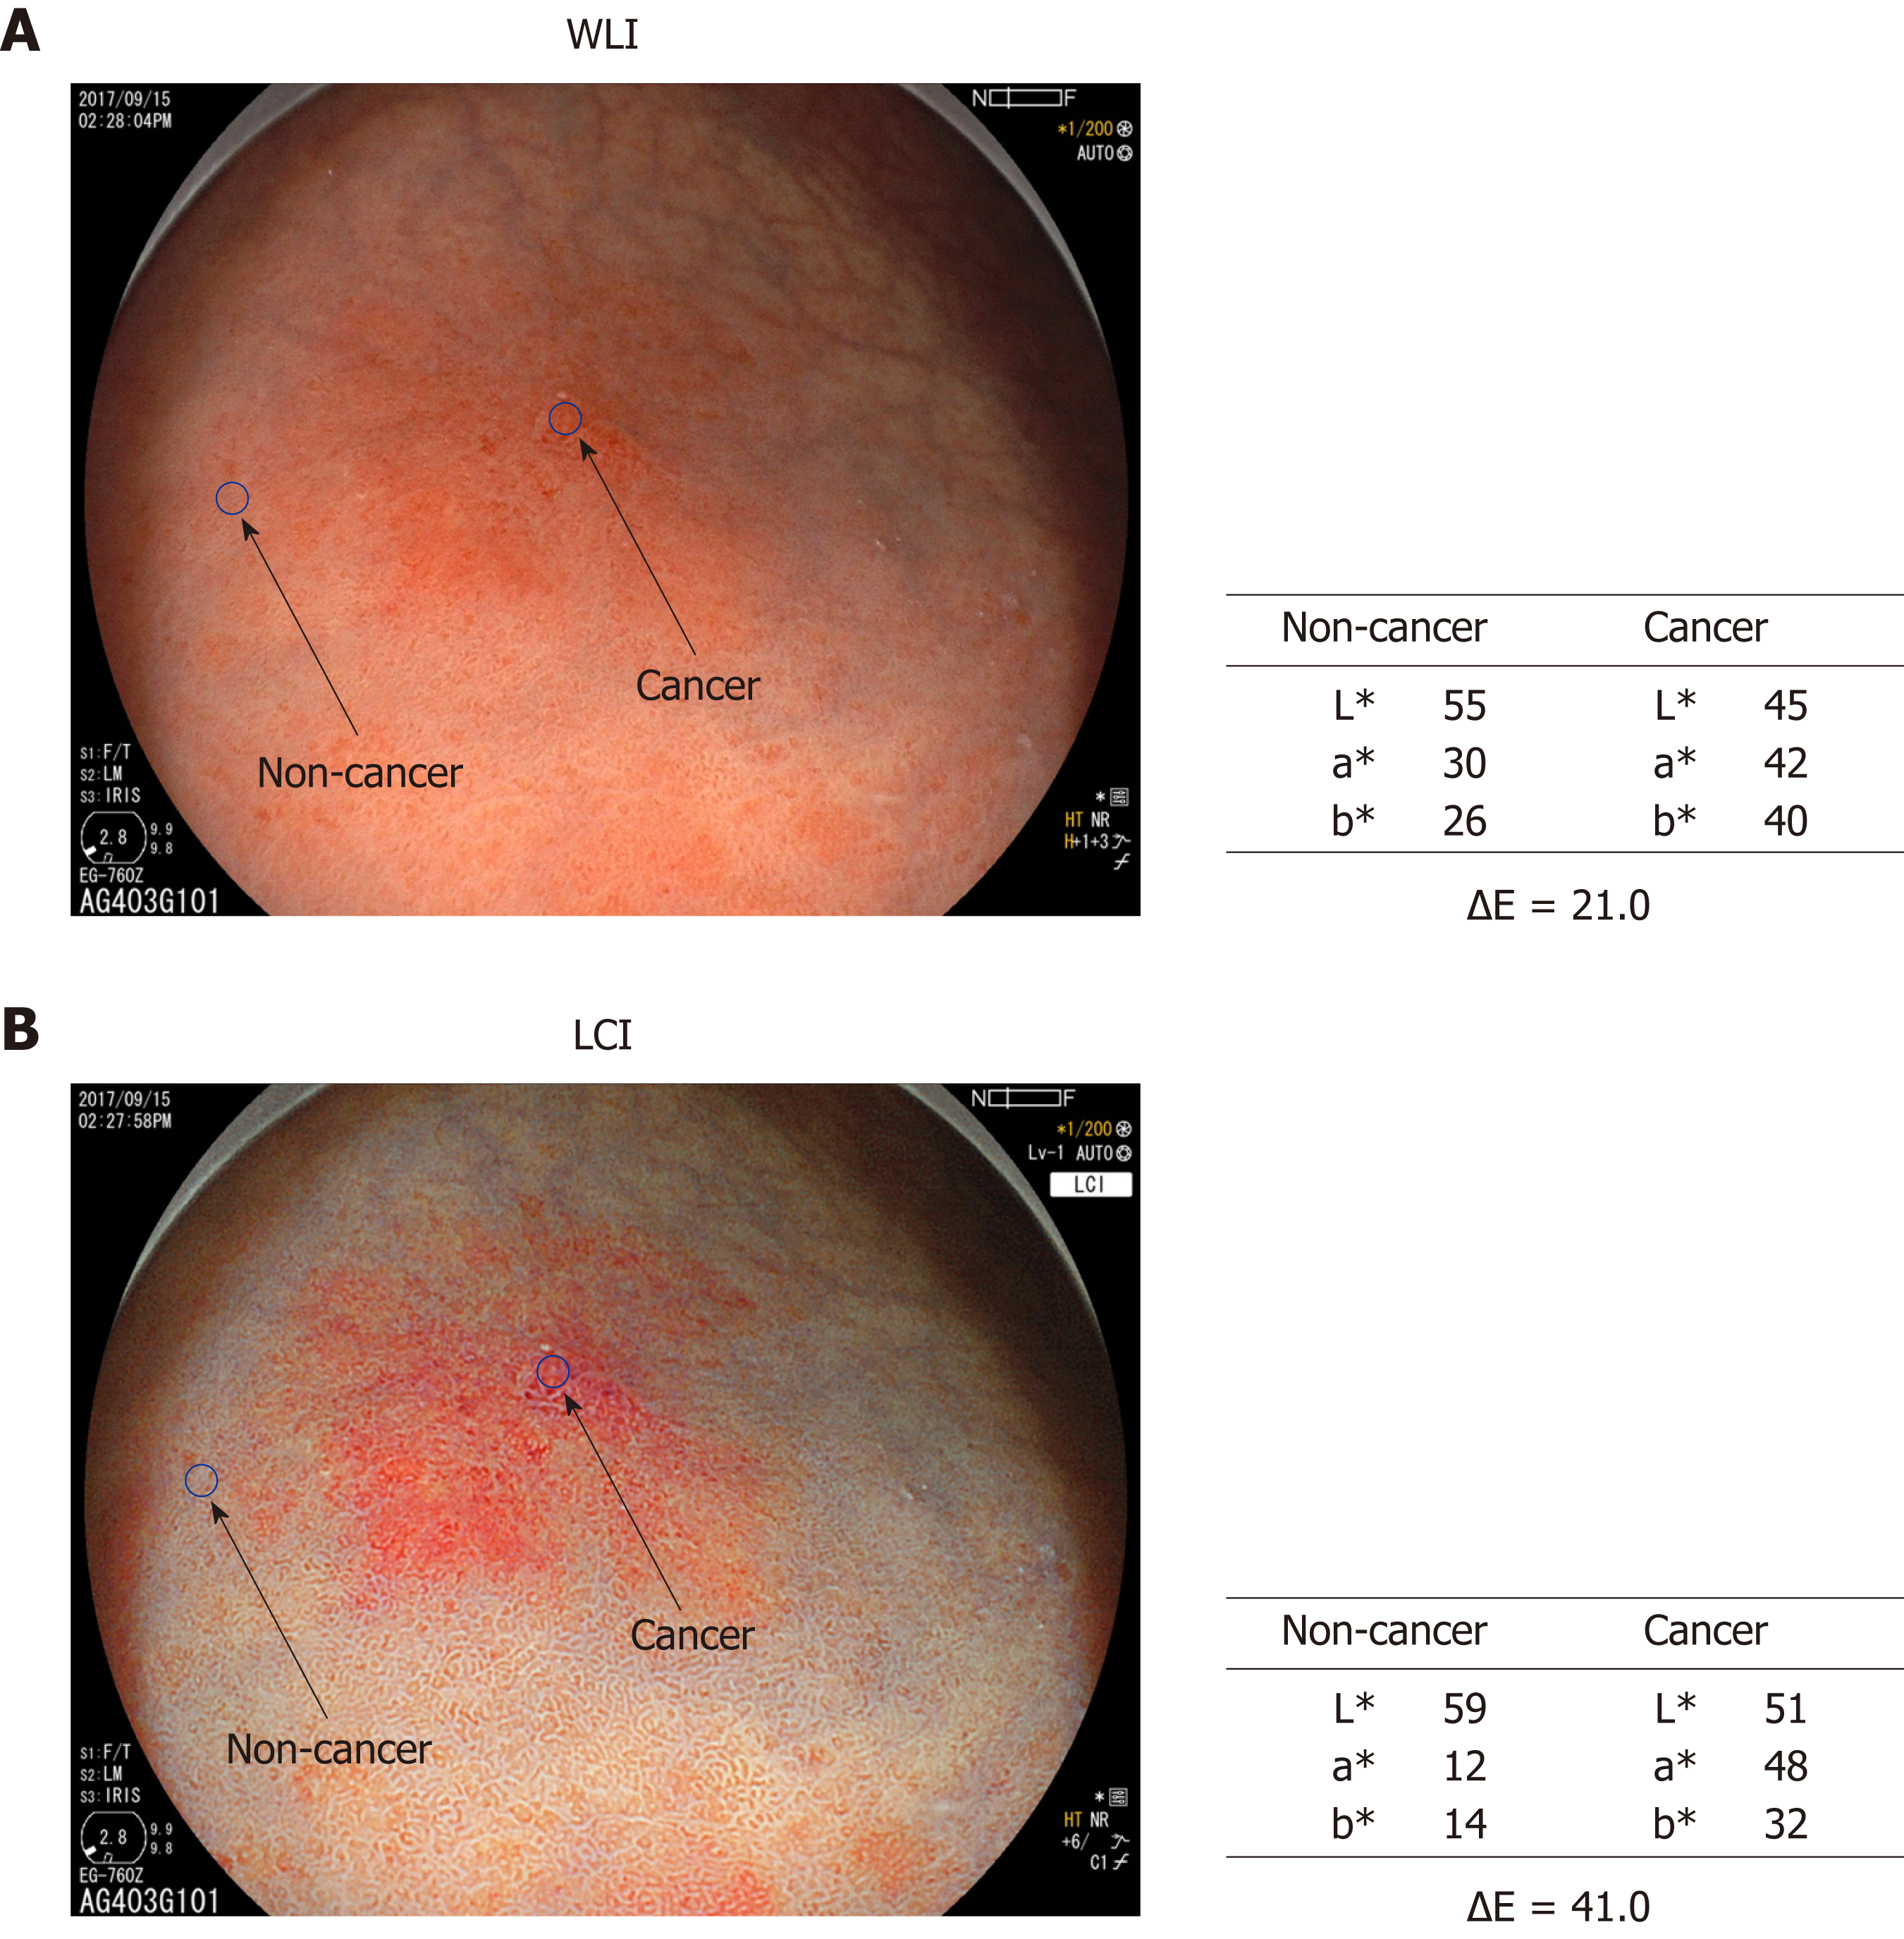
Figure 1 Color values and color differences between cancer and non- cancer areas.
A region of interest (diameter: 24 pixels) was established in each lesion. Color values (L*, a*, b*) were measured using Adobe Photoshop CS4 to estimate color differences (ΔE) between cancer and non-cancer areas. The results are shown in Table 2. WLI: White light imaging; LCI: Linked color imaging.
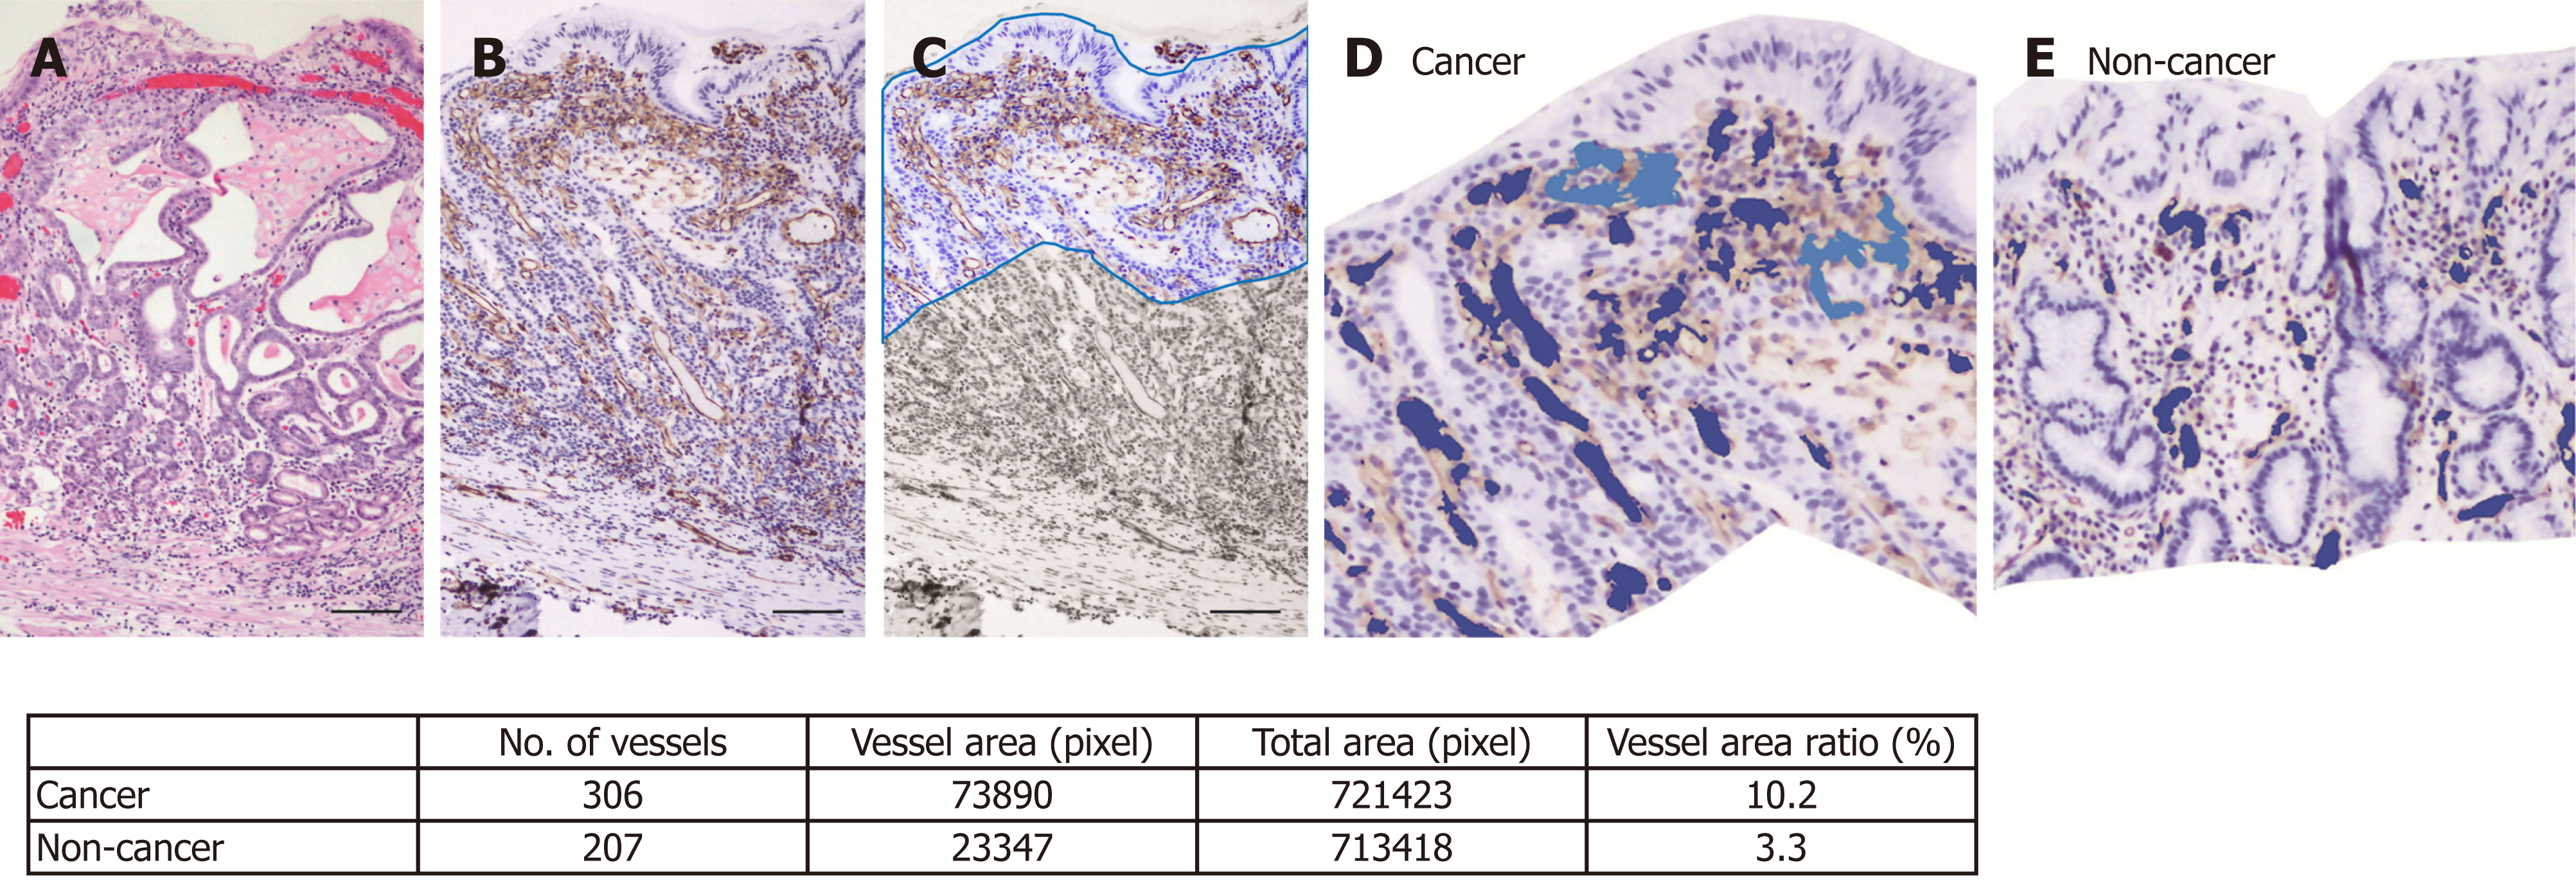
Figure 2 An example of blood vessel density calculation by imaging analysis software.
A: Hematoxylin and eosin staining of a cancer lesion (case 43, original magnification × 100, scale bar 100 μm). B: CD31 immunohistochemistry highlights blood vessels. C: A depth of 350 μm was trimmed manually. Automatically recognized blood vessels are colored in the cancer lesion (D) and non-cancer area (E). The calculated blood vessel area and ratio in this case are shown in the table.
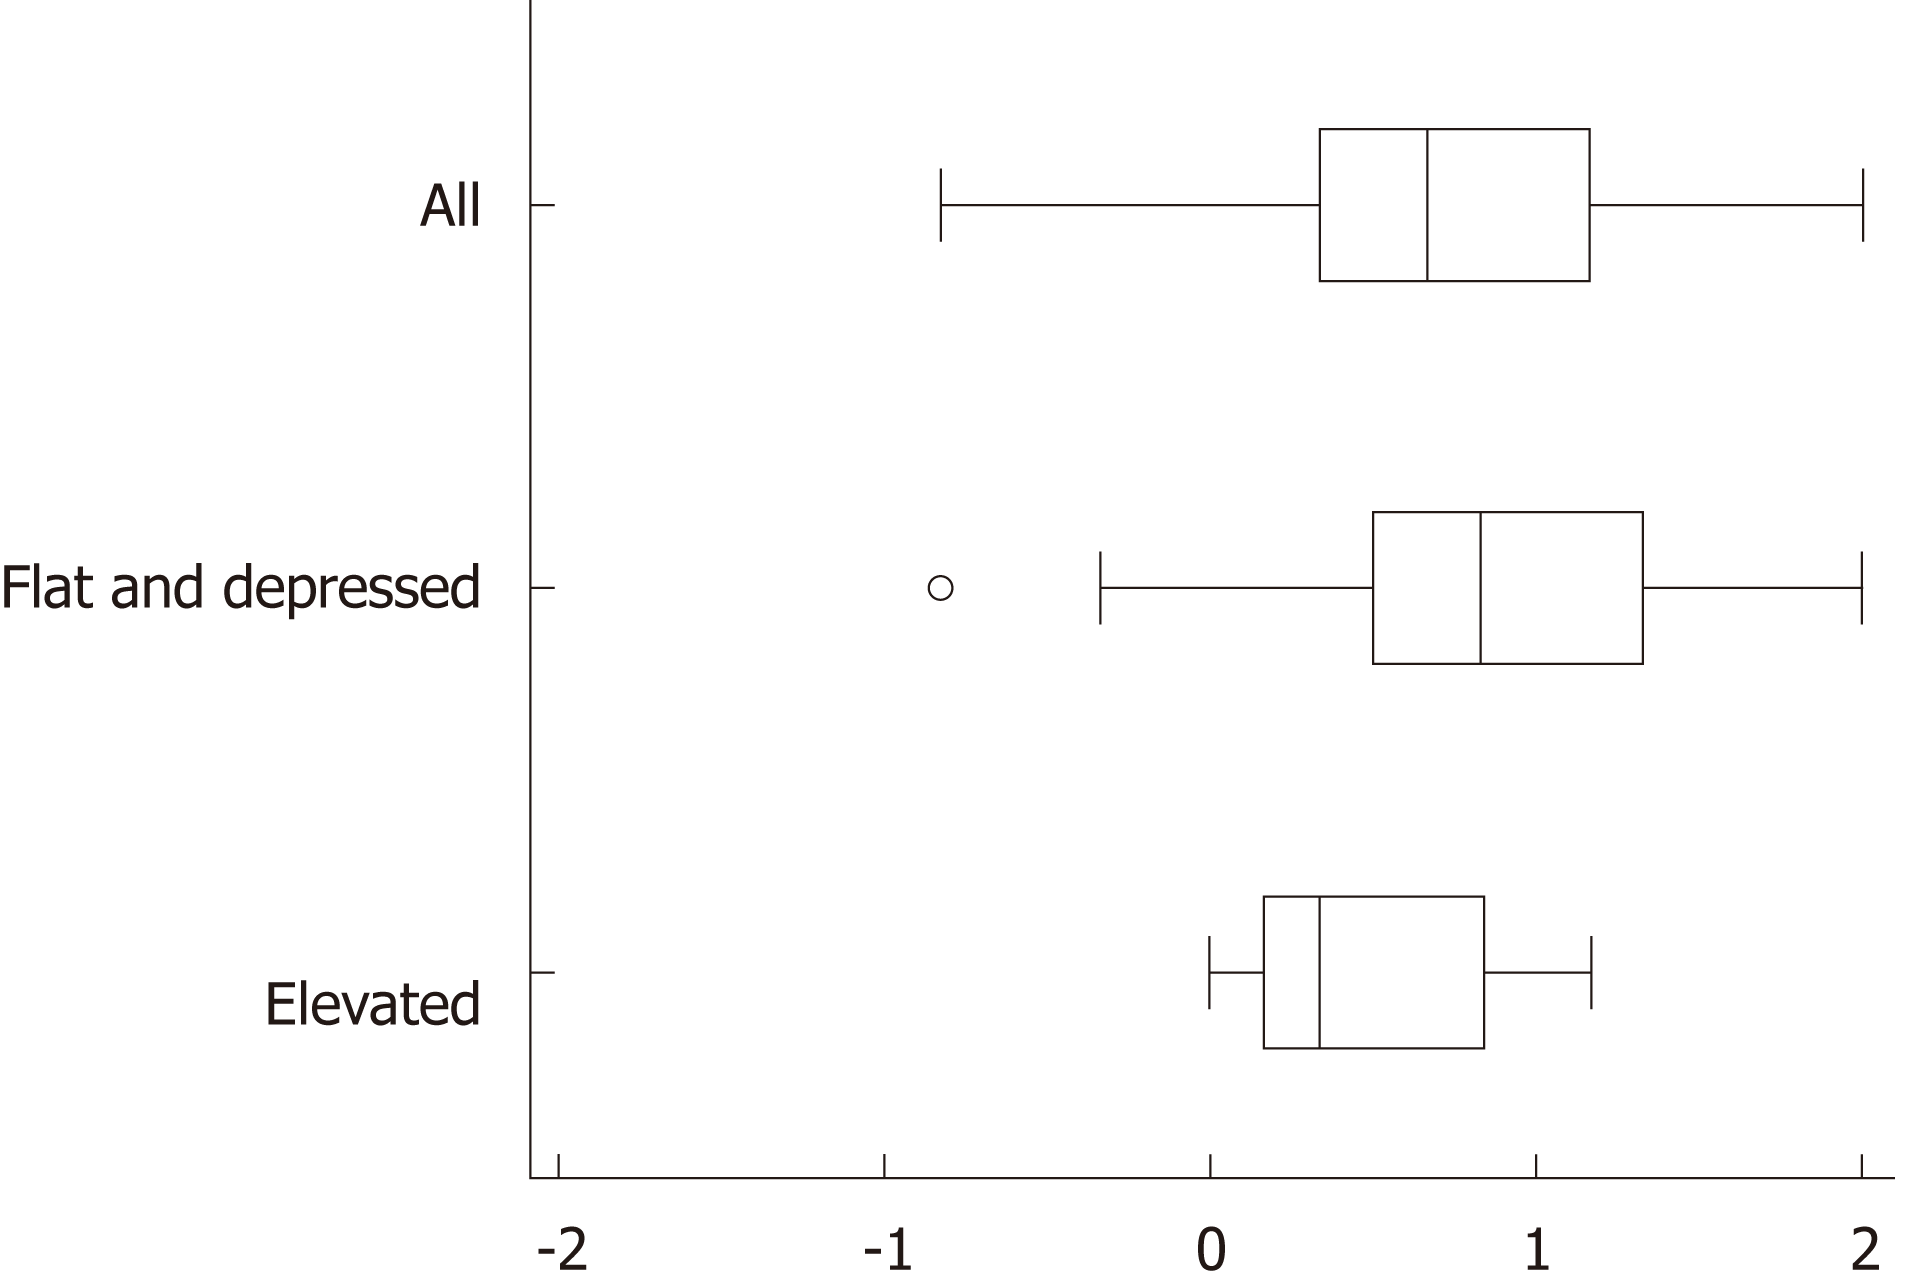
Figure 3 Recognition of early gastric cancer lesions using a Likert scale.
Linked color imaging was superior to white light imaging for recognition of early gastric cancer lesions based on evaluations by three endoscopists (P < 0.0001). This effect was stronger for flat/depressed lesions than for protruding lesions.
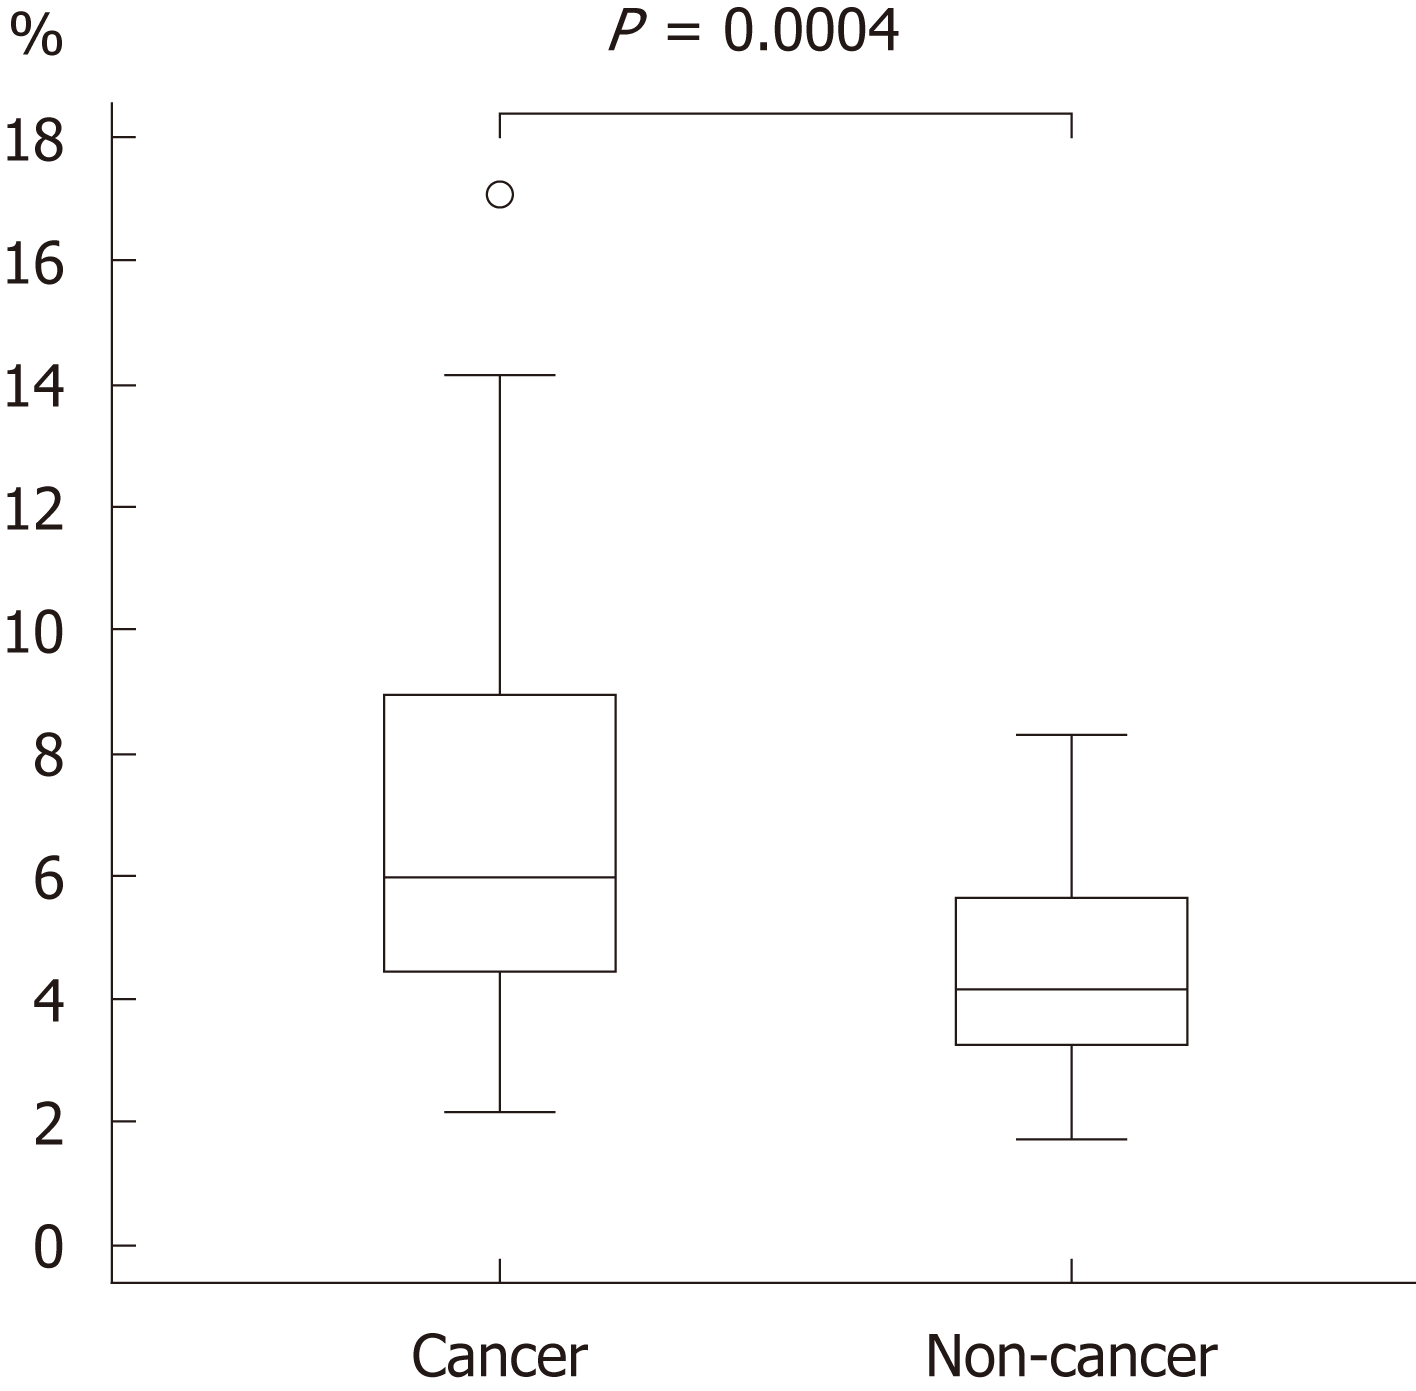
Figure 4 Blood vessel densities from the surface layer to a depth of 350 μm in cancer and non-cancer areas.
The blood vessel density was significantly higher in cancer than in non-cancer areas [median (range): 5.96% (2.17-17.08) vs 4.15% (1.71-8.22), P = 0.0004].
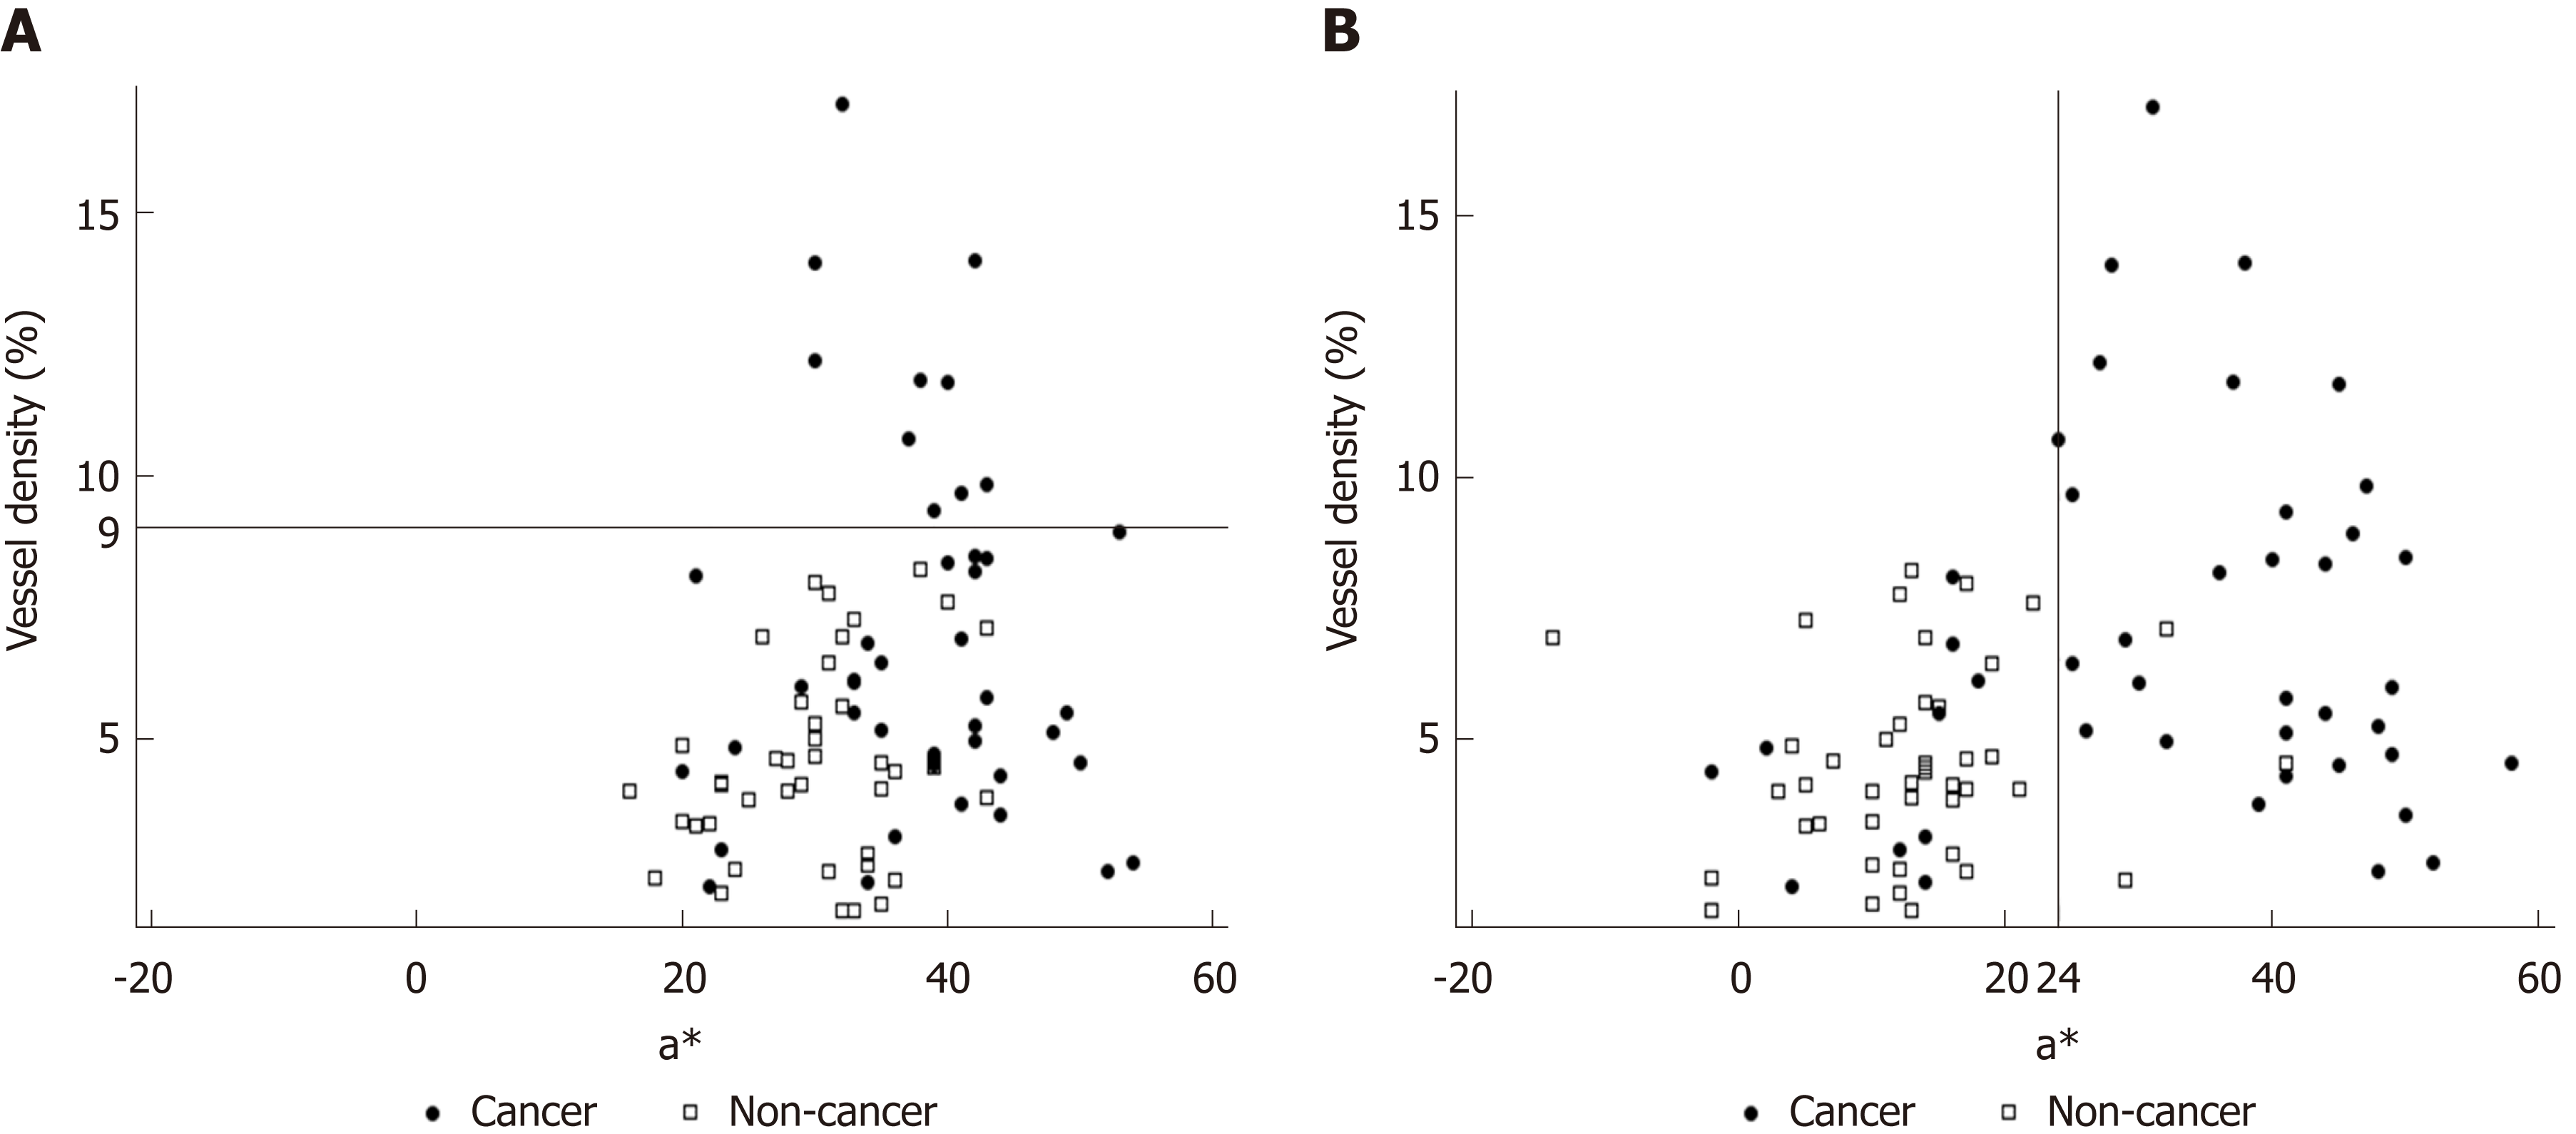
Figure 5 Relationship of a* in Commission Internationale de l'Eclairage 1976 L*a*b* color space (X axis) with blood vessel density from the surface layer to 350 μm (Y axis) using (A) white light imaging (WLI) and (B) linked color imaging (LCI).
Cancer and non-cancer areas were better differentiated with LCI compared to WLI. The blood vessel density was ≥ 9% in all cancer lesions. Using a cut-off value of ≥ 24 for cancer lesions, the diagnostic performance with LCI had sensitivity of 76.7%, specificity of 93.0%, positive predictive value of 91.7%, negative predictive value of 80.0%, and accuracy of 84.9%. WLI: White light imaging; LCI: Linked color imaging.
- Citation: Fujiyoshi T, Miyahara R, Funasaka K, Furukawa K, Sawada T, Maeda K, Yamamura T, Ishikawa T, Ohno E, Nakamura M, Kawashima H, Nakaguro M, Nakatochi M, Hirooka Y. Utility of linked color imaging for endoscopic diagnosis of early gastric cancer. World J Gastroenterol 2019; 25(10): 1248-1258
- URL: https://www.wjgnet.com/1007-9327/full/v25/i10/1248.htm
- DOI: https://dx.doi.org/10.3748/wjg.v25.i10.1248


