Copyright
©The Author(s) 2018.
World J Gastroenterol. Mar 7, 2018; 24(9): 971-981
Published online Mar 7, 2018. doi: 10.3748/wjg.v24.i9.971
Published online Mar 7, 2018. doi: 10.3748/wjg.v24.i9.971
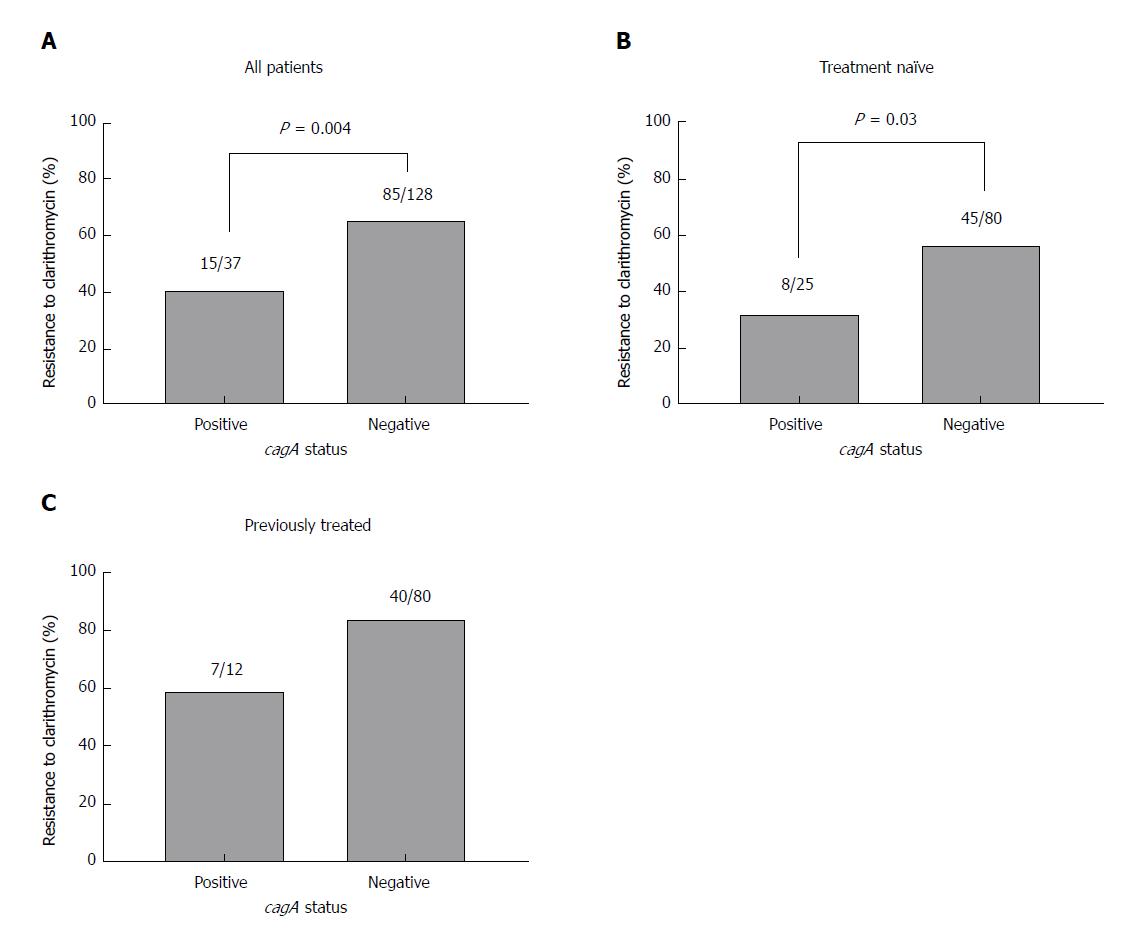
Figure 1 Prevalence of clarithromycin-resistance according to cagA genotype.
A: All patients; B: Treatment naïve patients; C: Previously treated patients.
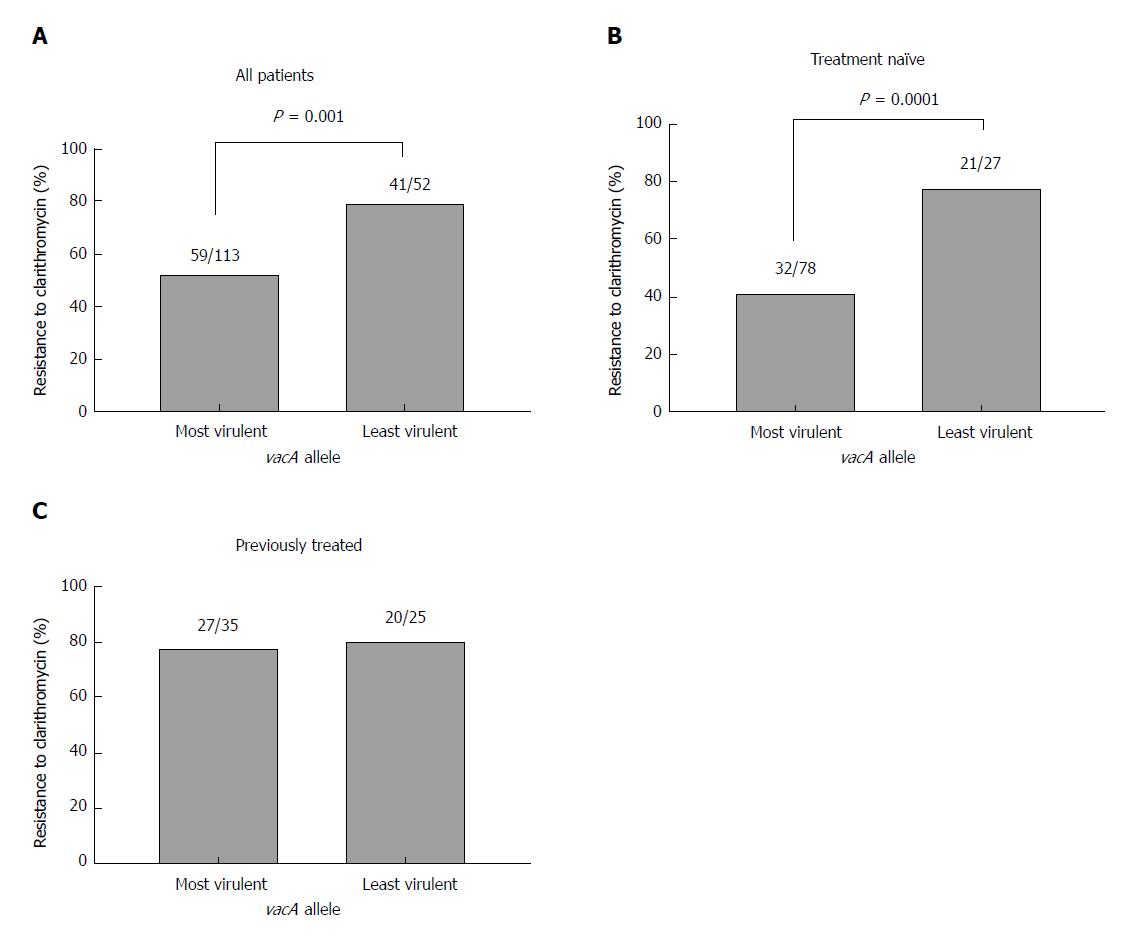
Figure 2 Prevalence of clarithromycin resistance according to vacA genotype.
A: All patients; B: Treatment naïve patients; C: Previously treated patients. Most virulent: S1/M1, S1/M2; Least virulent: S2/M1; S2/M2.
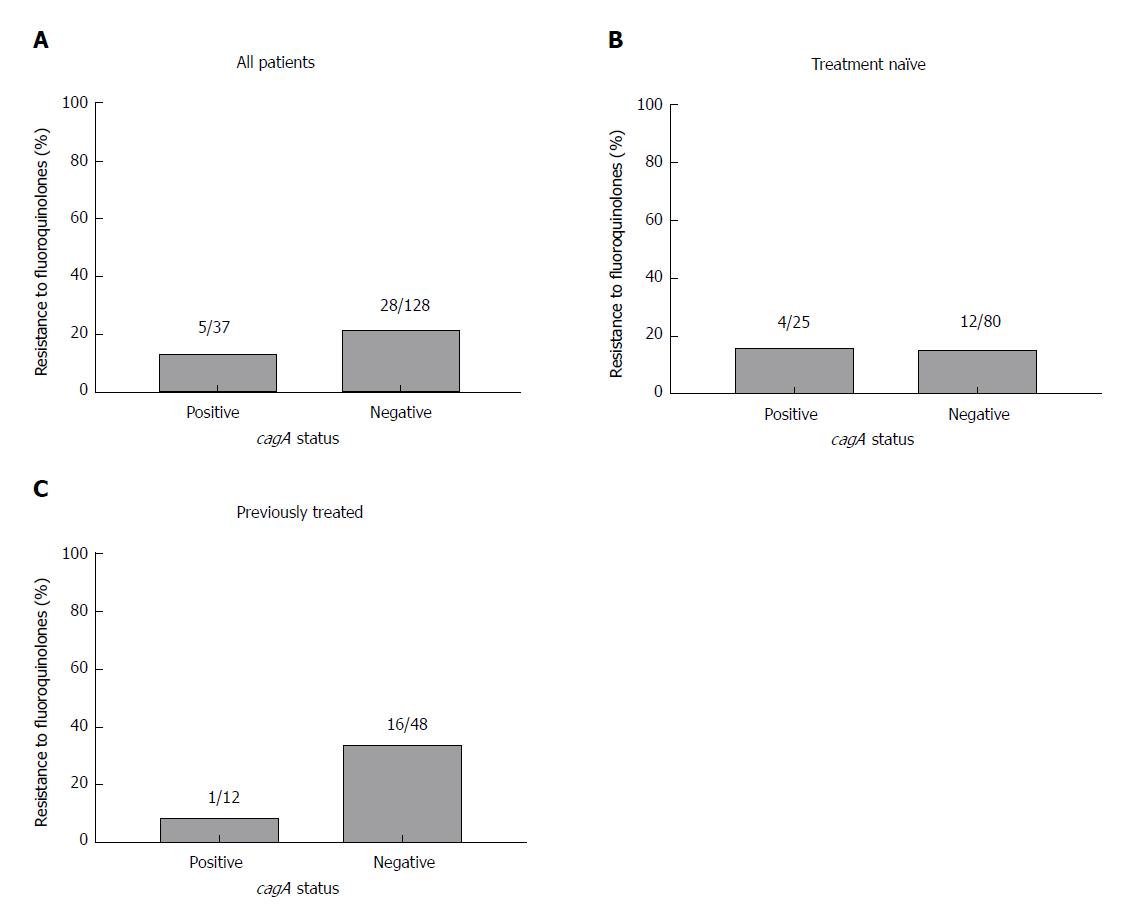
Figure 3 Prevalence of fluoroquinolone-resistance according to cagA genotype.
A: All patients; B: Treatment naïve patients; C: Previously treated patients.
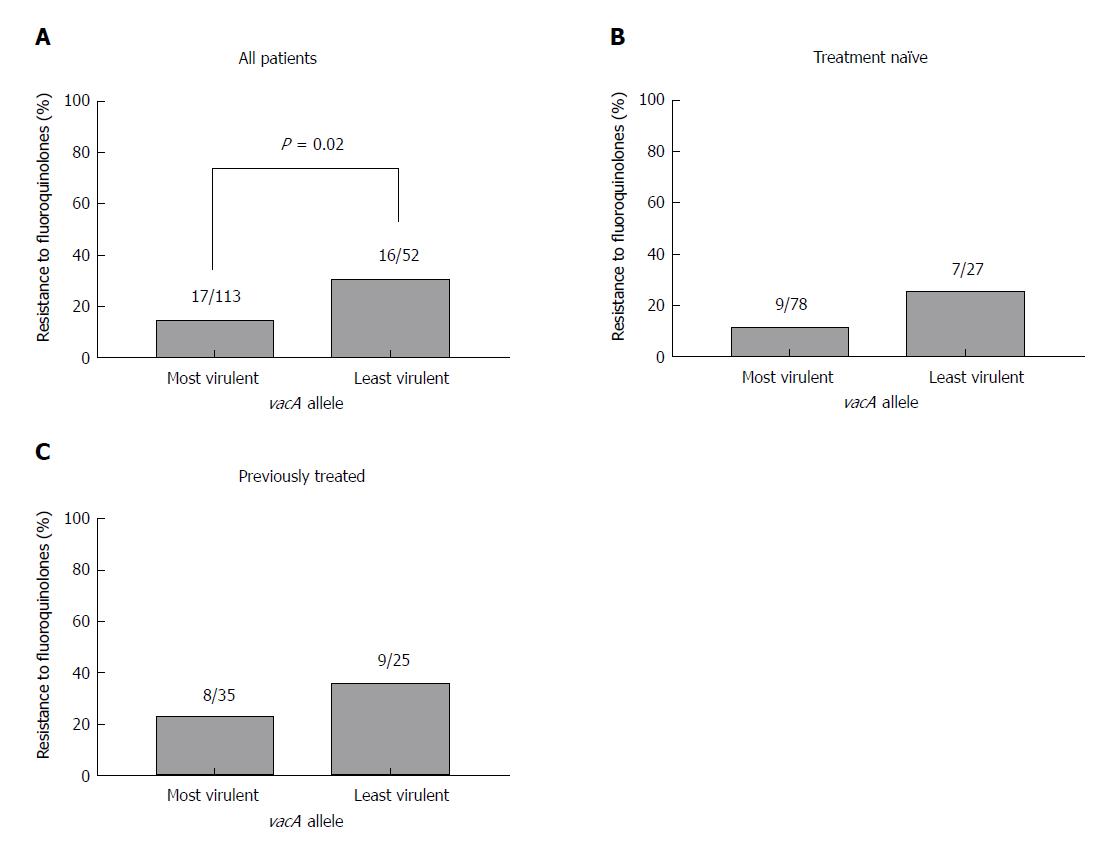
Figure 4 Prevalence of fluoroquinolone-resistance according to vacA genotype.
A: All patients; B: Treatment naïve patients; C: Previously treated patients. Most virulent: S1/M1, S1/M2; Least virulent: S2/M1; S2/M2.
- Citation: Brennan DE, Dowd C, O’Morain C, McNamara D, Smith SM. Can bacterial virulence factors predict antibiotic resistant Helicobacter pylori infection? World J Gastroenterol 2018; 24(9): 971-981
- URL: https://www.wjgnet.com/1007-9327/full/v24/i9/971.htm
- DOI: https://dx.doi.org/10.3748/wjg.v24.i9.971


