Copyright
©The Author(s) 2018.
World J Gastroenterol. Feb 7, 2018; 24(5): 573-582
Published online Feb 7, 2018. doi: 10.3748/wjg.v24.i5.573
Published online Feb 7, 2018. doi: 10.3748/wjg.v24.i5.573
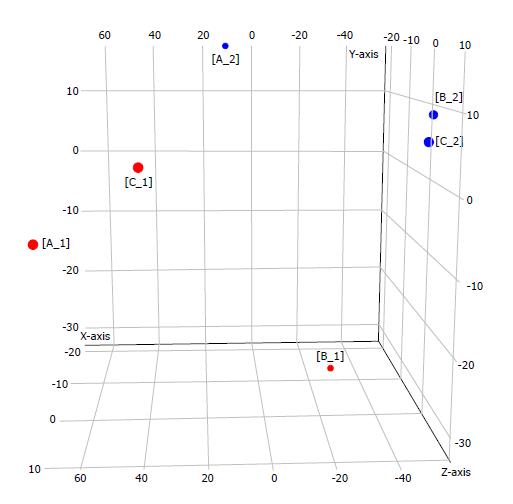
Figure 1 Principal component analysis plot of normalized miRNA expression values.
PCA was performed using R Bioconductor DESeq2. A clear separation between the tumour (red) and non-tumour (blue) samples was observed. PCA: Principal component analysis.
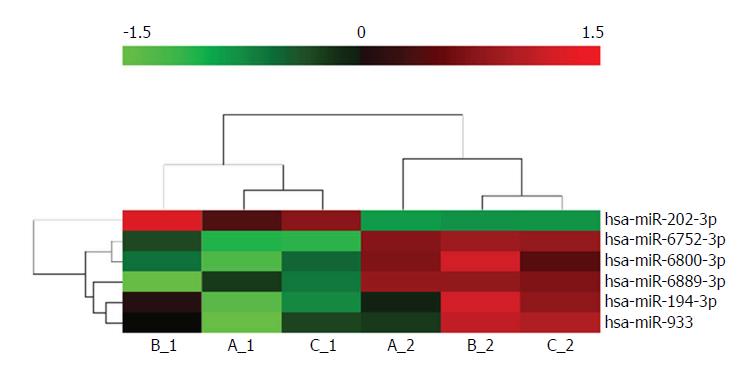
Figure 2 Hierarchical clustering analysis of differentially expressed miRNAs.
Differentially expressed miRNAs shown in the rows of the heatmap were clustered using Euclidean distance and complete linkage. The colour scale at the top illustrates the expression value of a particular miRNA on a log2 scale.
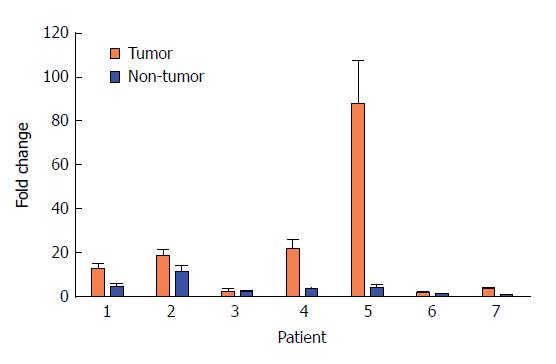
Figure 3 Quantitative RT-PCR analysis of miR-202-3p in type 1 g-neuroendocrine neoplasms and non-tumour gastric mucosal tissues.
The value of the lowest expression sample was set to 1, and thus, the fold change values indicate the relative trend of change in the expression levels among different samples.
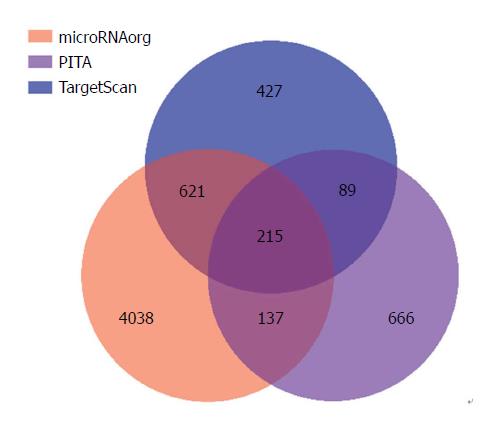
Figure 4 The intersection of the predicted genes of miR-202-3p.
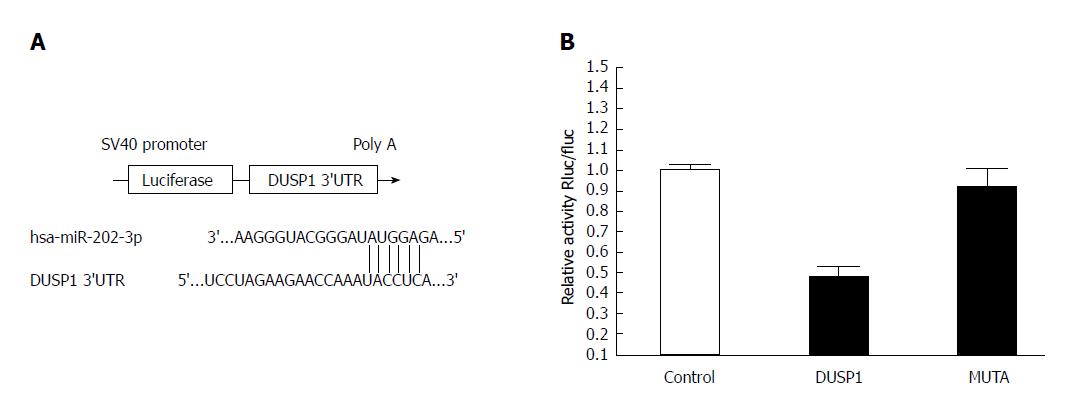
Figure 5 Luciferase reporter assay.
The relative activity of the wild-type group was decreased by 52% compared with that of the control group. Compared with the wild-type group, the relative activity of the mutant group was increased by 44%. There was a significant difference between the wild-type group and the control group (P < 0.05), and the relative activity of the mutant group recovered to almost the same level as that of the control group (P > 0.05). The other panel in the figure shows the target site where hsa-miR-202-3p binds to the DUSP1 3'-UTR.
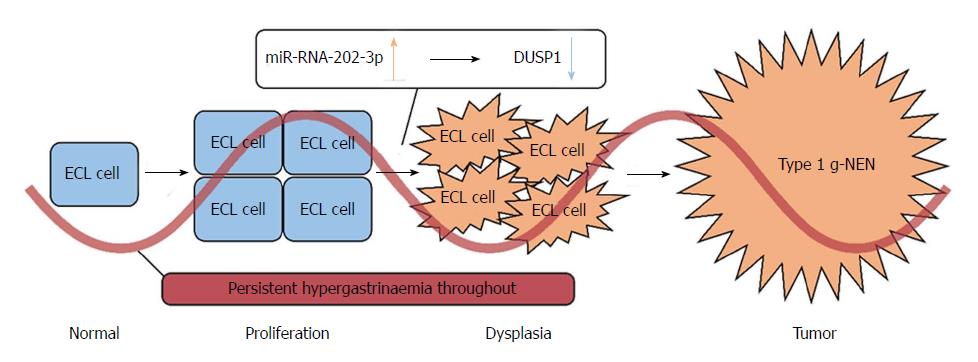
Figure 6 The possible role of miR-202-3p/DUSP1 in the pathogenesis of type 1 g-NETs.
- Citation: Dou D, Shi YF, Liu Q, Luo J, Liu JX, Liu M, Liu YY, Li YL, Qiu XD, Tan HY. Hsa-miR-202-3p, up-regulated in type 1 gastric neuroendocrine neoplasms, may target DUSP1. World J Gastroenterol 2018; 24(5): 573-582
- URL: https://www.wjgnet.com/1007-9327/full/v24/i5/573.htm
- DOI: https://dx.doi.org/10.3748/wjg.v24.i5.573


