Copyright
©The Author(s) 2018.
World J Gastroenterol. Dec 7, 2018; 24(45): 5167-5178
Published online Dec 7, 2018. doi: 10.3748/wjg.v24.i45.5167
Published online Dec 7, 2018. doi: 10.3748/wjg.v24.i45.5167
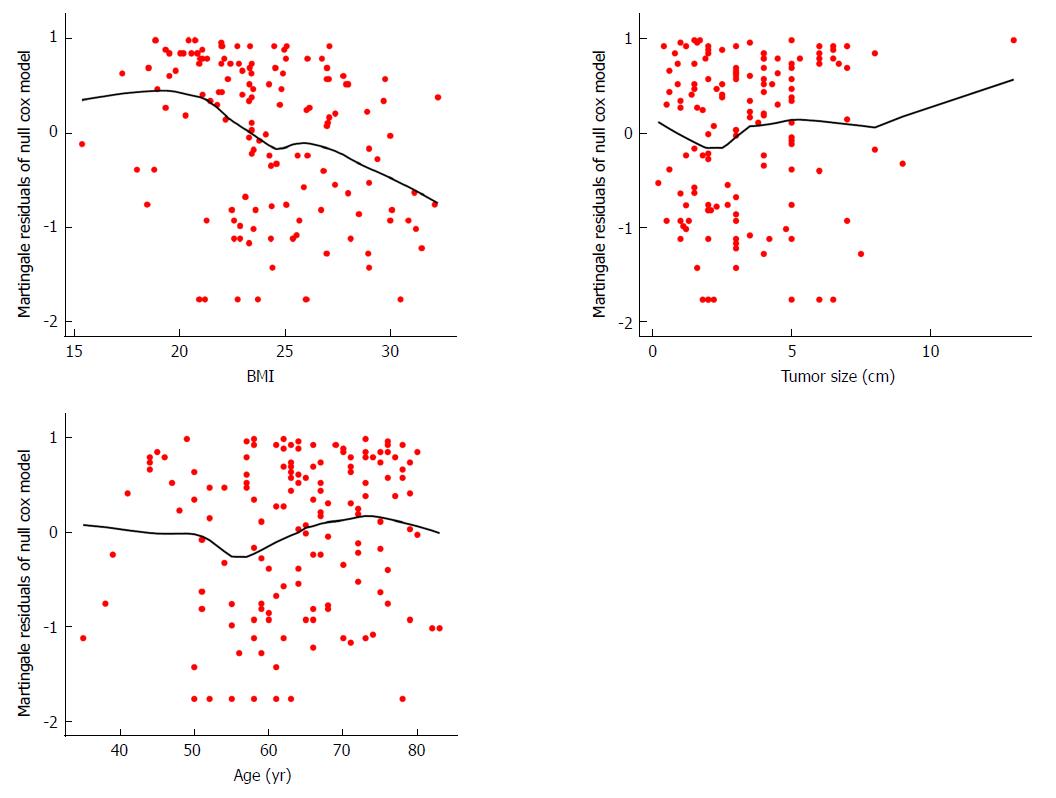
Figure 1 Graphical assessment for continuous predictors.
Null model residuals (martingale residuals) vs body mass index, tumor size, and age were plotted with LOESS line to obtain a preliminary assessment of which of these predictors should be incorporated into the model. BMI: Body mass index.
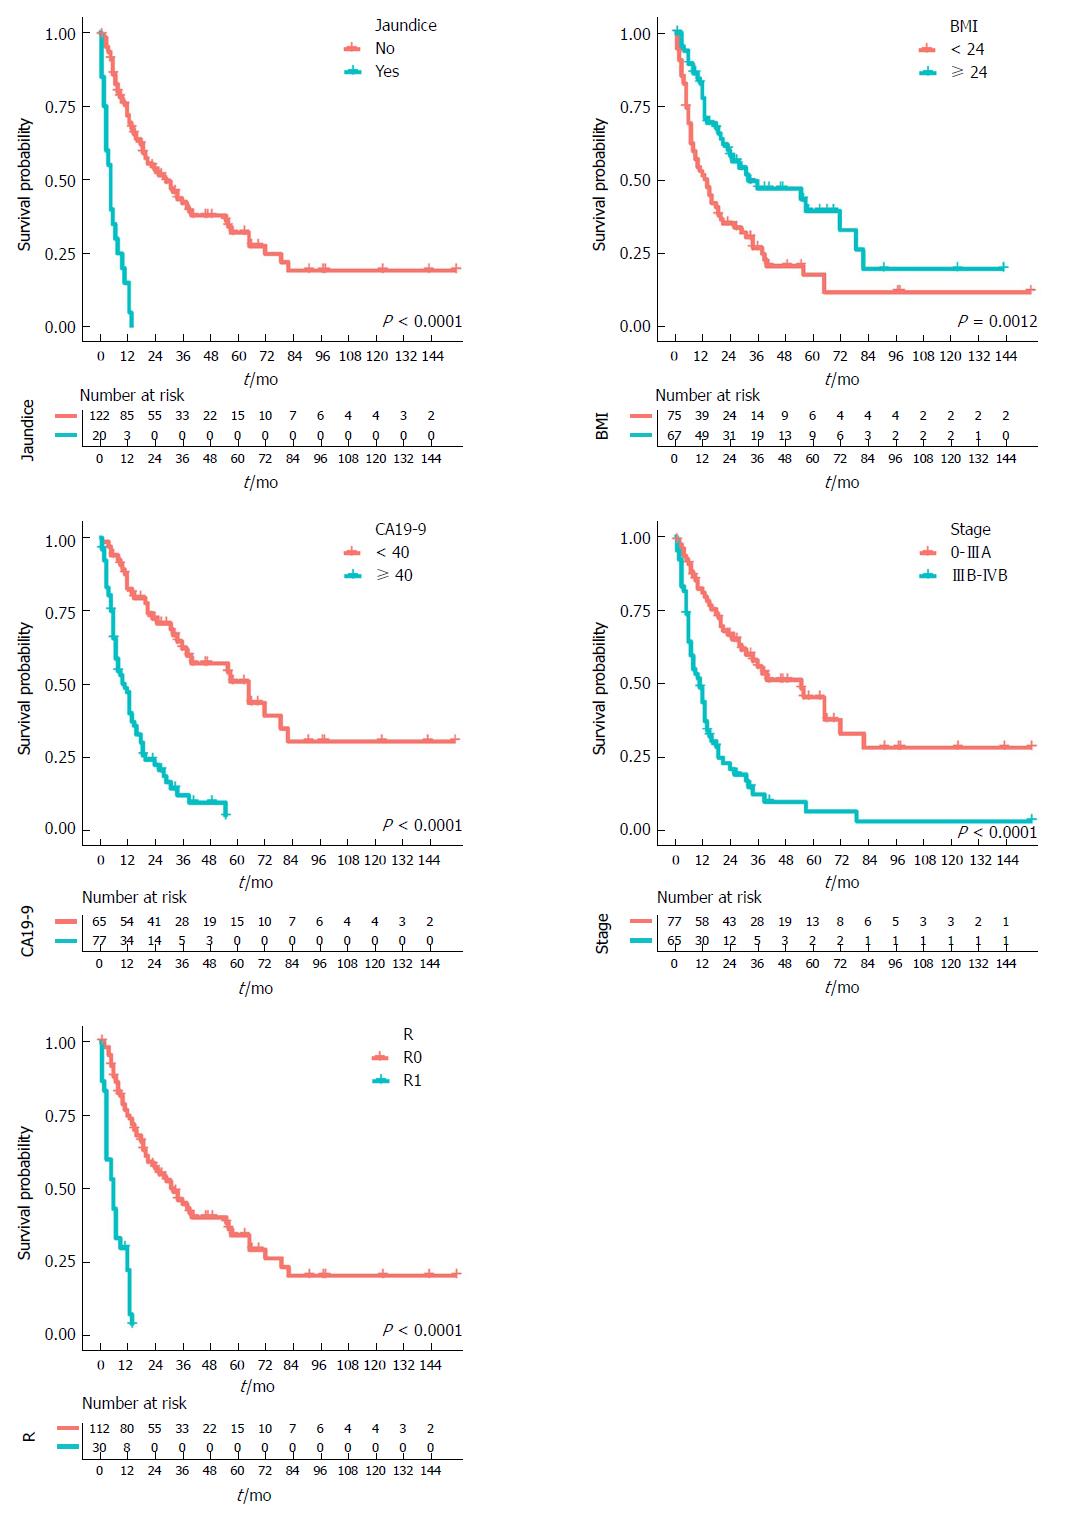
Figure 2 Kaplan-Meier survival curves for each predictor.
Kaplan-Meier survival curves showing the overall survival rates in gallbladder cancer patients according to different category types. All predictors are statistically significant (P-values are shown in the bottom right corner). Time-dependent numbers at risk are listed at the bottom. BMI: Body mass index; CA19-9: Carbohydrate antigen 19-9; R: Resection.
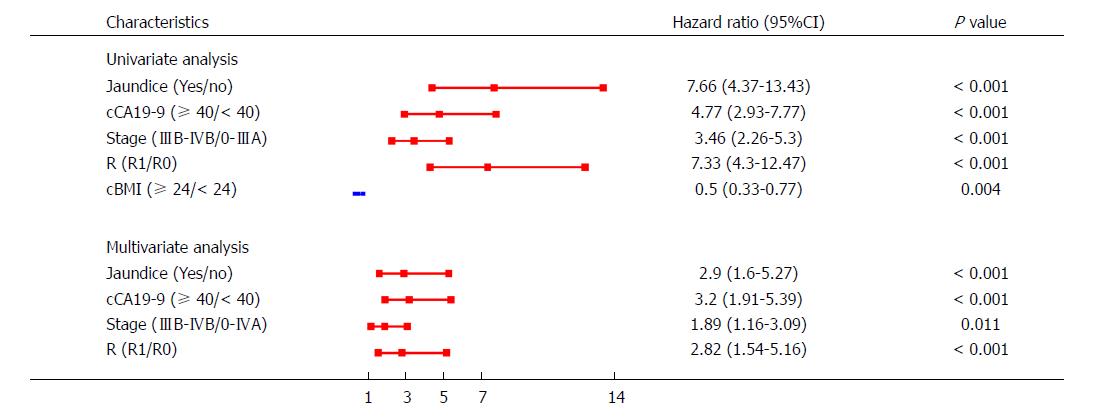
Figure 3 Cox proportional hazards model.
Absence of jaundice and lower groups of categorical carbohydrate antigen 19-9, stage, resection, and categorical body mass index were used as the baseline. Red represents statistically significant factors incorporated to the model after both univariate and multivariate analysis, while blue represents factors that were excluded after multivariate analysis. cCA19-9: Categorical carbohydrate antigen 19-9; R: Resection; cBMI: Categorical body mass index.
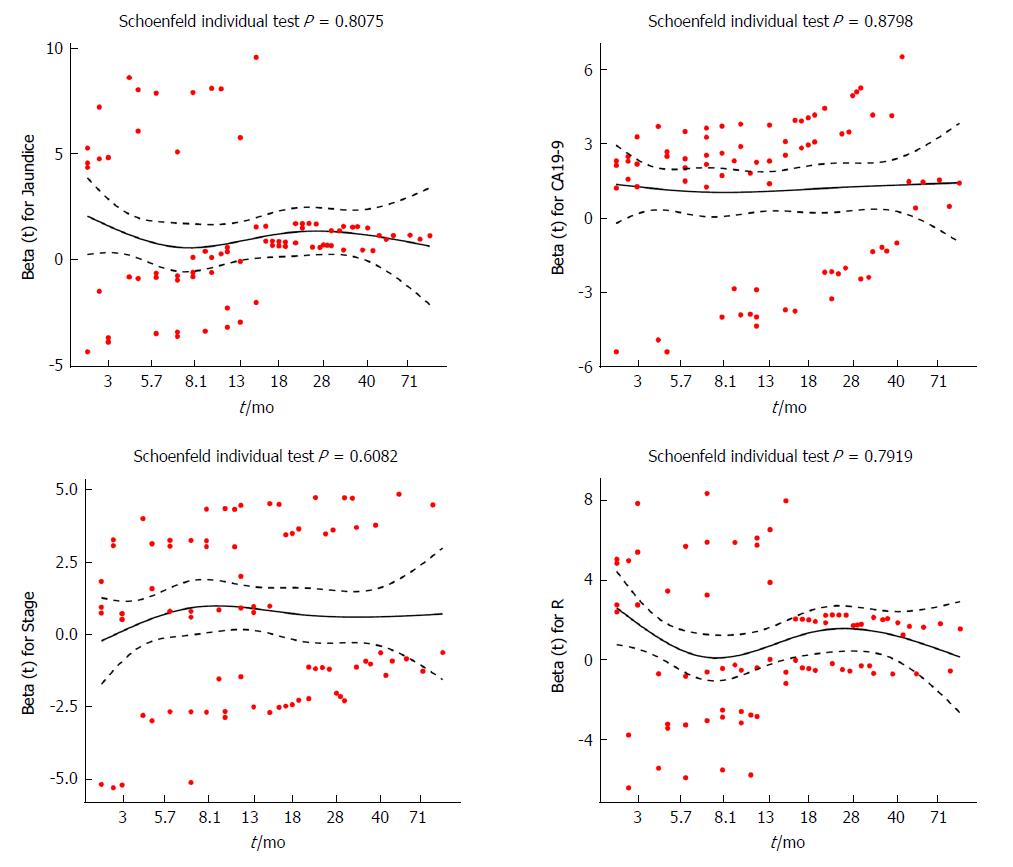
Figure 4 Schoenfeld residuals vs ranked survival time for selected predictors.
The X-axis represents the survival time, while the Beta values referring to jaundice, carbohydrate antigen 19-9, stage, and resection are shown on the Y-axis. CA19-9: Carbohydrate antigen 19-9; R: Resection.
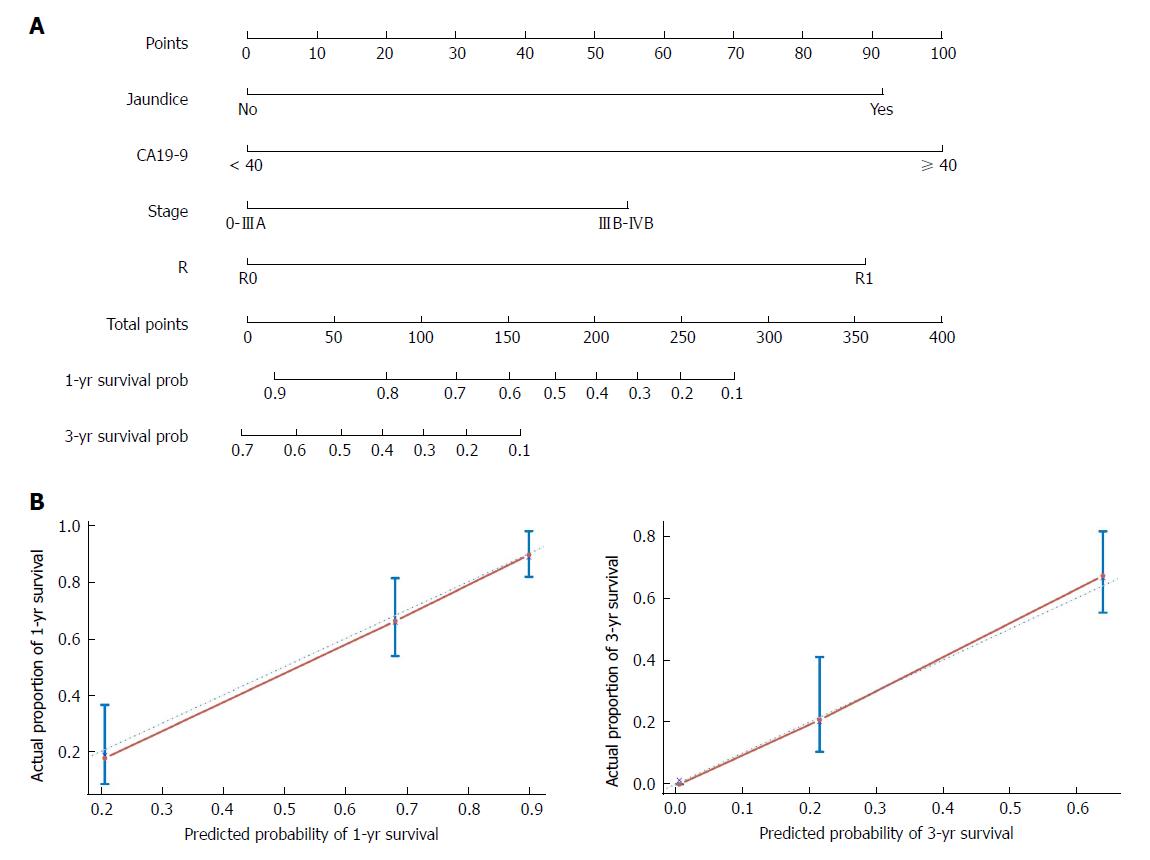
Figure 5 Nomogram and calibration plot.
A: A nomogram to predict the survival time of postsurgery gallbladder cancer (GBC) patients. Patient’s jaundice condition is located in the row labeled “Jaundice”, and a straight line is drawn up to the row labeled “Points” to determine the corresponding points. This process is then repeated for each of the remaining factors. After the total points are summed, a straight line is drawn from the appropriate total point number location to the rows labeled “1-yr survival prob” and “3-yr survival prob” to predict patient survival probability; B: Calibration curves for predicting 1- and 5-yr overall survival for GBC patients after radical resection. Actual survival measured via Kaplan-Meier analysis is shown on the Y-axis, and the nomogram-predicted survival is shown on the X-axis. CA19-9: Carbohydrate antigen 19-9.
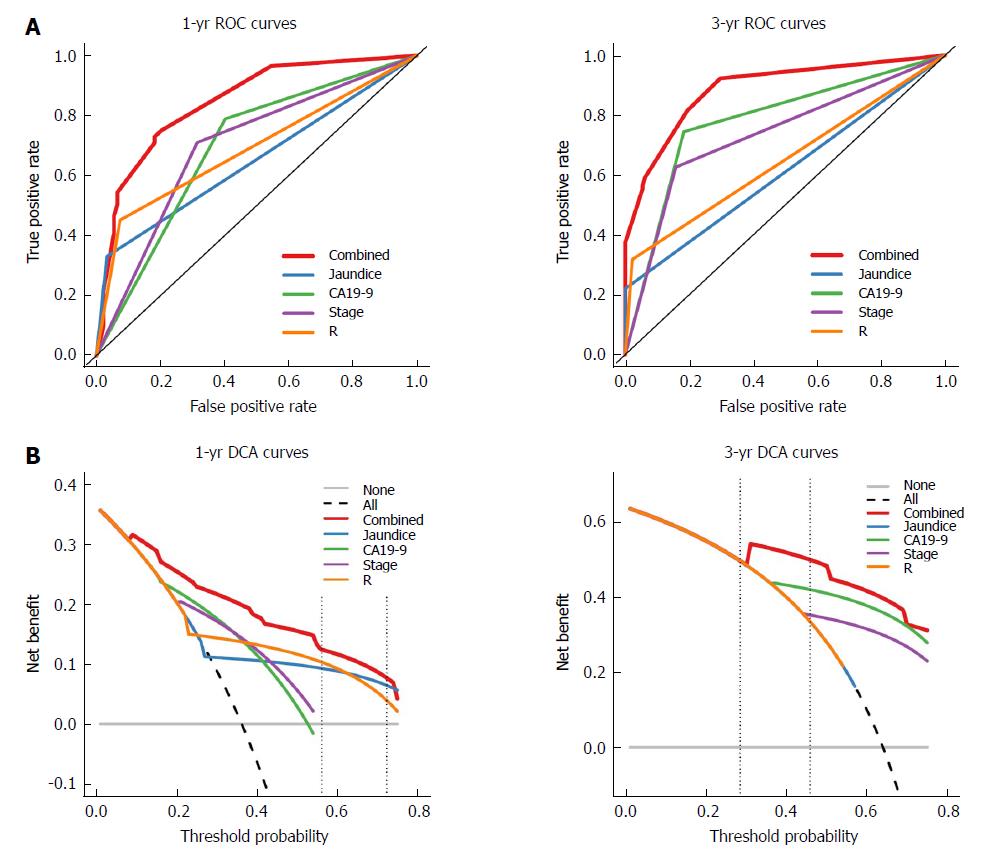
Figure 6 Receiver operating characteristic and decision curve analysis of the nomogram for 1- and 3-yr survival.
A: Time-dependent receiver operating characteristic curve analysis for the sensitivity and specificity of the nomograms. The combined nomogram (red solid line) had higher accuracy compared with the individual indicators; B: Time-dependent decision curve analysis for the clinical benefit of the nomograms and the corresponding scope of application. The black dotted line represents the assumption that all patients survive in the first and third year. The gray solid line represents the assumption that no patients survive in the first or third year. The red solid line represents the combined nomogram. The threshold probability between two vertical dashed lines represents the 95%CI of 1- and 3-yr survival probability in the null model. ROC: Receiver operating characteristic; DCA: Decision curve analysis.
- Citation: Bai Y, Liu ZS, Xiong JP, Xu WY, Lin JZ, Long JY, Miao F, Huang HC, Wan XS, Zhao HT. Nomogram to predict overall survival after gallbladder cancer resection in China. World J Gastroenterol 2018; 24(45): 5167-5178
- URL: https://www.wjgnet.com/1007-9327/full/v24/i45/5167.htm
- DOI: https://dx.doi.org/10.3748/wjg.v24.i45.5167


