Copyright
©The Author(s) 2018.
World J Gastroenterol. Dec 7, 2018; 24(45): 5095-5108
Published online Dec 7, 2018. doi: 10.3748/wjg.v24.i45.5095
Published online Dec 7, 2018. doi: 10.3748/wjg.v24.i45.5095
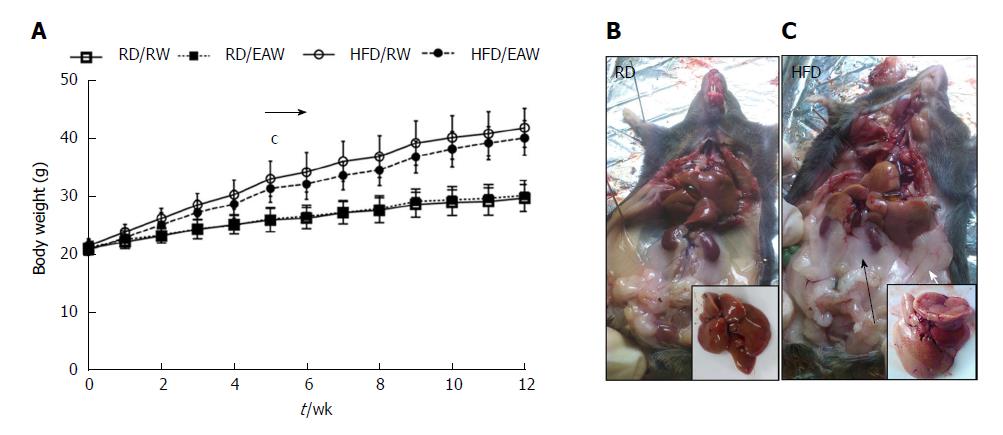
Figure 1 Effect of electrolyzed-alkaline water on body weight and composition.
A: Body weight (n = 12, mean ± SD) cshows significant diference between high-fat and regular diets. Mann Whitney and Kruskal-Wallis cP < 0.001); B and C: Ventral view of dissected mice after 12 wk of the experiment. Black arrow: Retroperitoneal fat pads; white arrow epididymal fat pad. Insert: Fresh dissected liver. RW: Regular water; EAW: Electrolysed alkaline water; RD: Regular diet; HFD: High fat diet.
Figure 2 Body mass composition fat, free fatty mass and fluids of mice at different groups (n = 12) before the beginning of the experiment (up) and after 12 wk (down).
Data are expressed as mean ± SD. Different letters show significant difference in fat content (Mann Whitney and Kruskal-Wallis aP < 0.05). RD/RW: Regular diet/regular water; RD/EAW: Regular diet/electrolysed alkaline water; HFD/RW: High fat diet/regular water; HFD/EAW: High fat diet/electrolysed alkaline water.
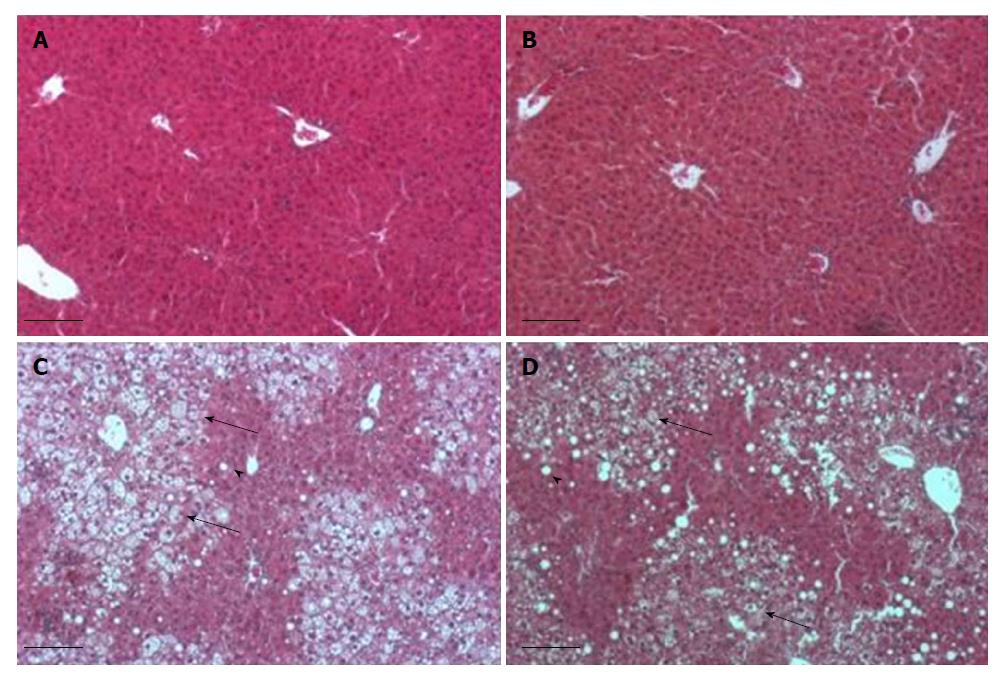
Figure 3 Histological sections stained by hematoxylin eosin of livers from mice fed regular diet and regular water (A), regular diet and electrolyzed alkaline water (B), high fat diet and regular water (C), high fat diet and electrolyzed alkaline water (D).
Note the prominent steatosis in mice fed on high-fat diet. Microvesicular inclusions (big arrow), macrovesicular inclusion (small arrow).
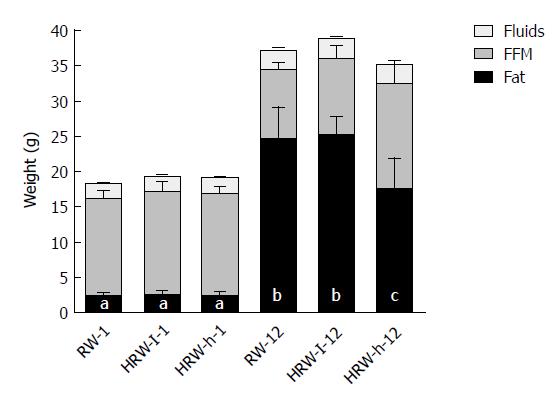
Figure 4 Body mass composition: Fat, fluids and free fatty mass at weeks 1 (first three columns) and 12 (last three columns), (n = 8).
Data are expressed as mean ± SD. Different letters show a significant difference in fat content (Mann Whitney and Kruskal-Wallis P < 0.05). RW: Regular water; HRW-I: Hydrogen-rich water low concentration; HRW-h: Hydrogen-rich water high concentration).
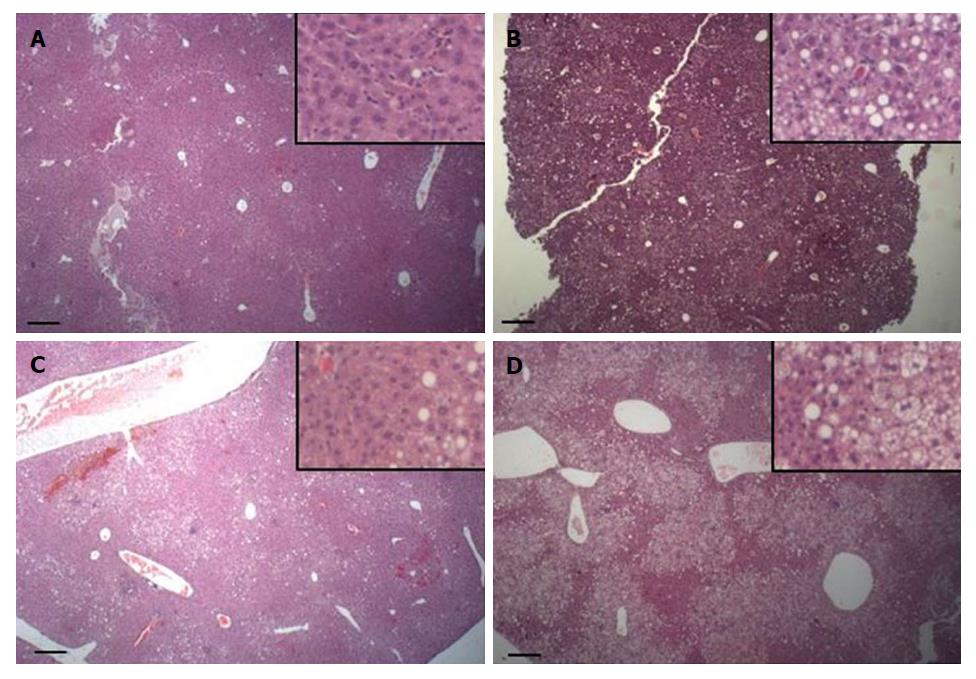
Figure 5 Histological sections of livers (HE) of mice fed a high-fat diet for 12 wk.
A and C: Hydrogen-rich water (HRW) group; B and D: Regular water (RW) group. Each row shows sections of different mice that reached a similar weight at the end of the experiment. Note the pronounced steatosis in mice that drank RW in compare to mice of the same weight that drank HRW. Insert detail of each section. Bar = 200 μm HWR: Hydrogen-rich water; RW: Regular water.
- Citation: Jackson K, Dressler N, Ben-Shushan RS, Meerson A, LeBaron TW, Tamir S. Effects of alkaline-electrolyzed and hydrogen-rich water, in a high-fat-diet nonalcoholic fatty liver disease mouse model. World J Gastroenterol 2018; 24(45): 5095-5108
- URL: https://www.wjgnet.com/1007-9327/full/v24/i45/5095.htm
- DOI: https://dx.doi.org/10.3748/wjg.v24.i45.5095


