Copyright
©The Author(s) 2018.
World J Gastroenterol. Nov 28, 2018; 24(44): 5013-5024
Published online Nov 28, 2018. doi: 10.3748/wjg.v24.i44.5013
Published online Nov 28, 2018. doi: 10.3748/wjg.v24.i44.5013
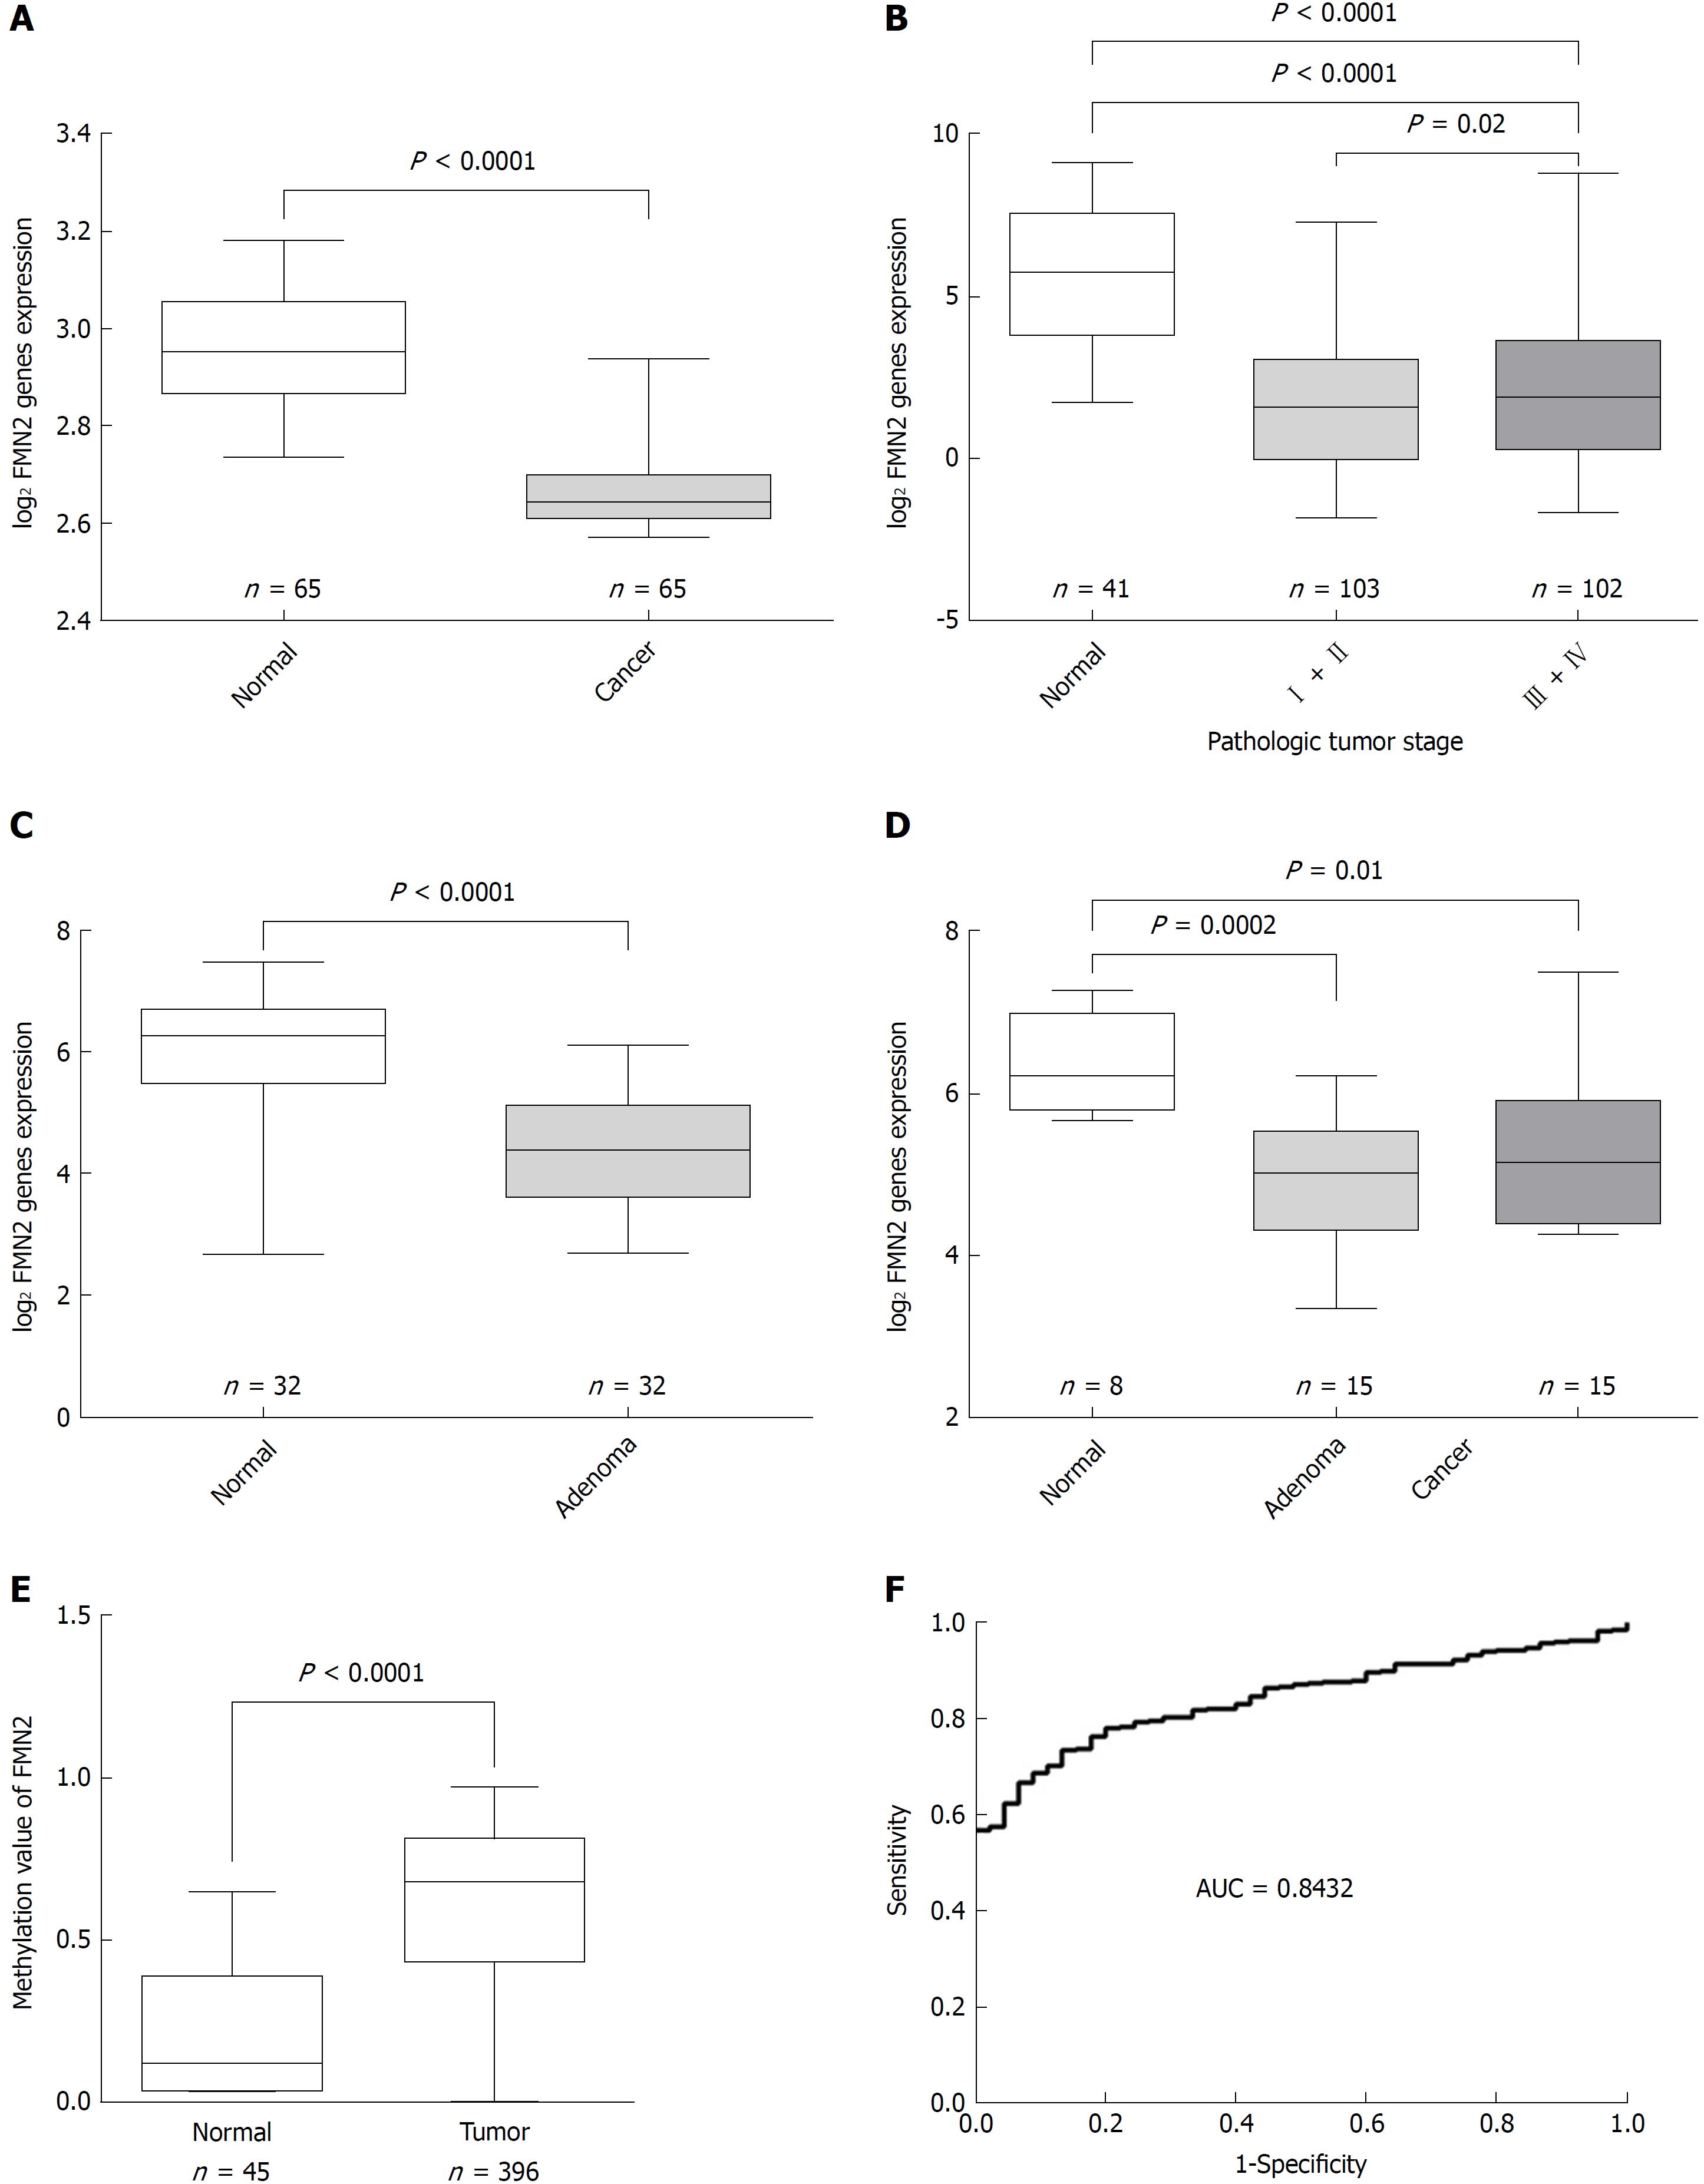
Figure 1 Colorectal tissues show decreased formin 2 expression and a high frequency of hypermethylation in the formin 2 promoter.
A: Normalized expression of formin 2 (FMN2) mRNA in carcinoma and adjacent normal tissues, presented as box-whisker plots (unpaired t-test, GEO: GSE20842); B: Normalized expression of FMN2 mRNA in tissue from different stages of carcinoma (according to the AJCC Cancer Staging Manual) and in normal tissue, presented as box-whisker plots (unpaired t-test, colorectal cancer samples from TCGA); C: Normalized expression of FMN2 mRNA in adenoma and corresponding normal colonic mucosal tissues, presented as box-whisker plots (unpaired t-test, GEO: GSE8671); D: Normalized expression of FMN2 mRNA in normal, adenoma, and carcinoma tissues, presented as box-whisker plots (unpaired t-test, GEO: GSE4183); E: The FMN2 gene shows an increased methylation level in colorectal cancer tissues compared with normal tissues (unpaired t-test, colorectal cancer samples from TCGA); F: Receiver operating characteristic curve analysis was used to assess the clinical diagnostic utility of FMN2 DNA methylation for the prediction of colorectal cancer.
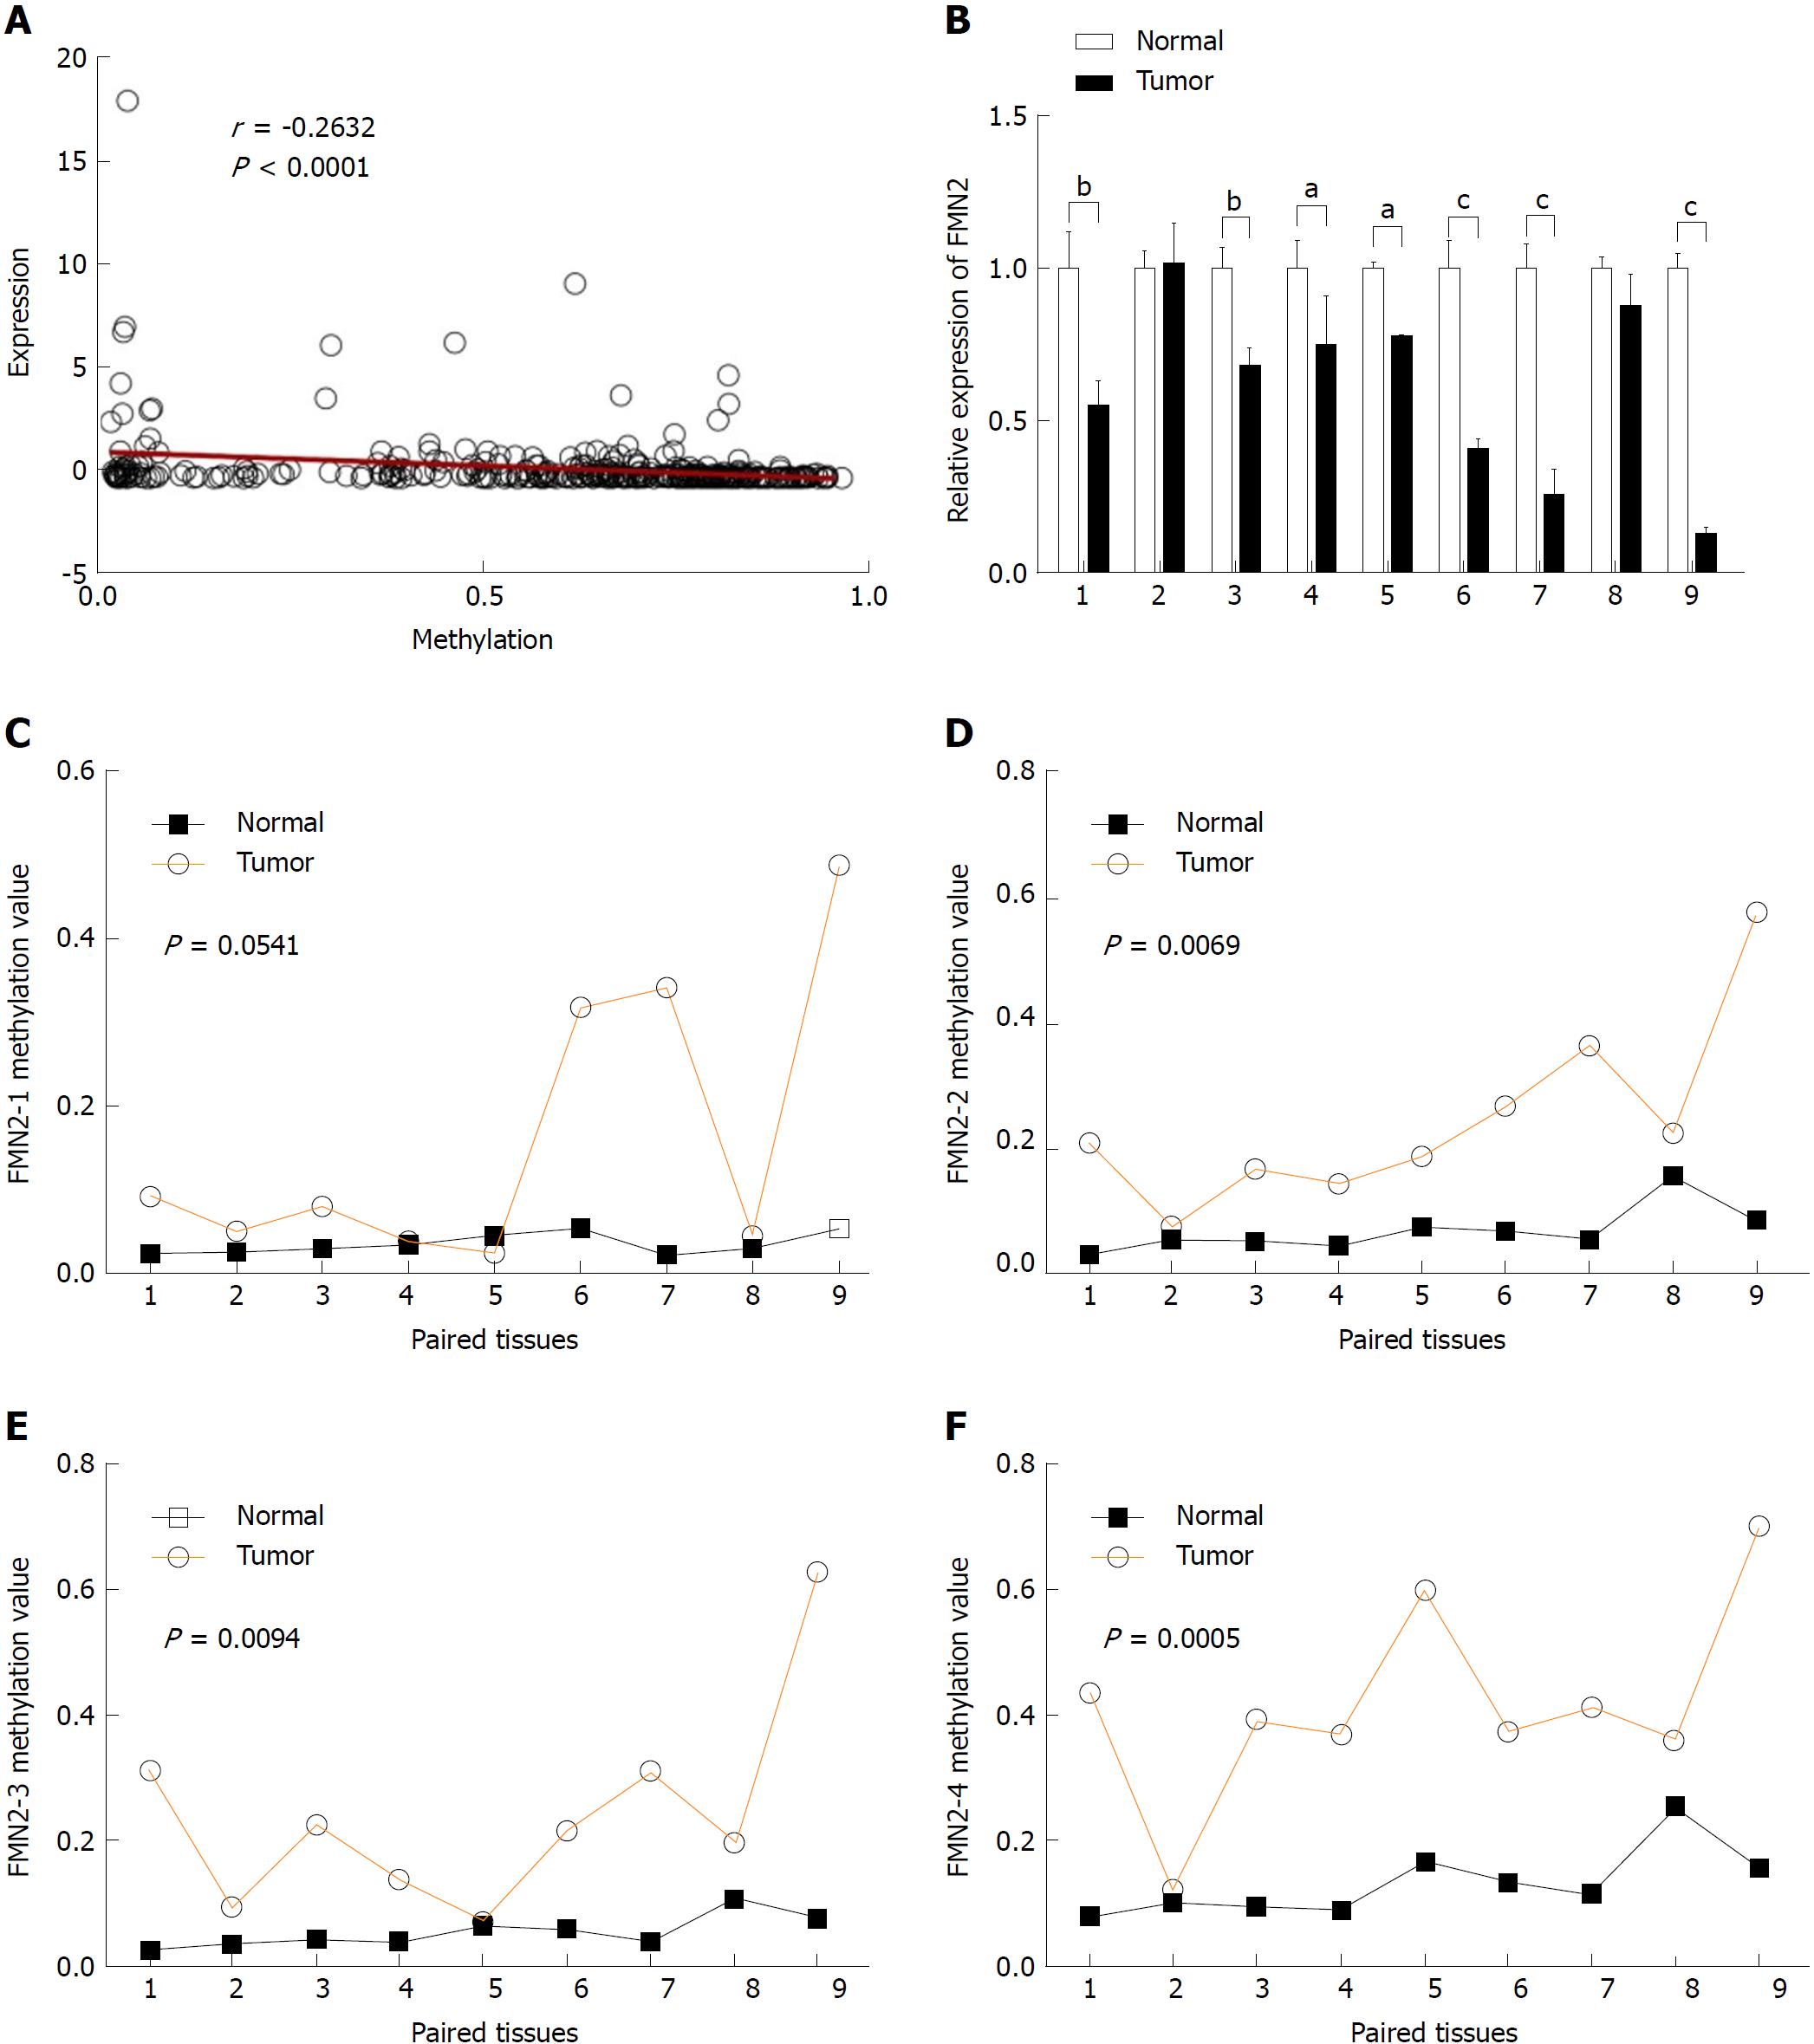
Figure 2 Hypermethylation of formin 2 correlates with decreased expression of formin 2 during colorectal cancer.
A: The expression of the formin 2 (FMN2) gene is significantly inversely correlated with the methylation level (Pearson correlation analysis); B: Quantitative real-time RT-PCR for FMN2 was carried out on nine colorectal cancer surgical specimens (filled bars) and paired noncancerous tissues (unfilled bars). The expression levels in the tumor samples were independently calculated relative to those in the nontumor samples, which are normalized to 1. Vertical bar, SD; aP < 0.05, bP < 0.03, cP < 0.01 (unpaired t-test); C-F: Results of MethylTarget™ assays on nine paired noncancerous tissues and colorectal cancer tissues. Four CpG regions (FMN2-1, FMN2-2, FMN2-3, and FMN2-4) from CpG islands adjacent to the FMN2 promoter were sequenced (unpaired t-test. More details about the four CpG regions can be found in Table 2).
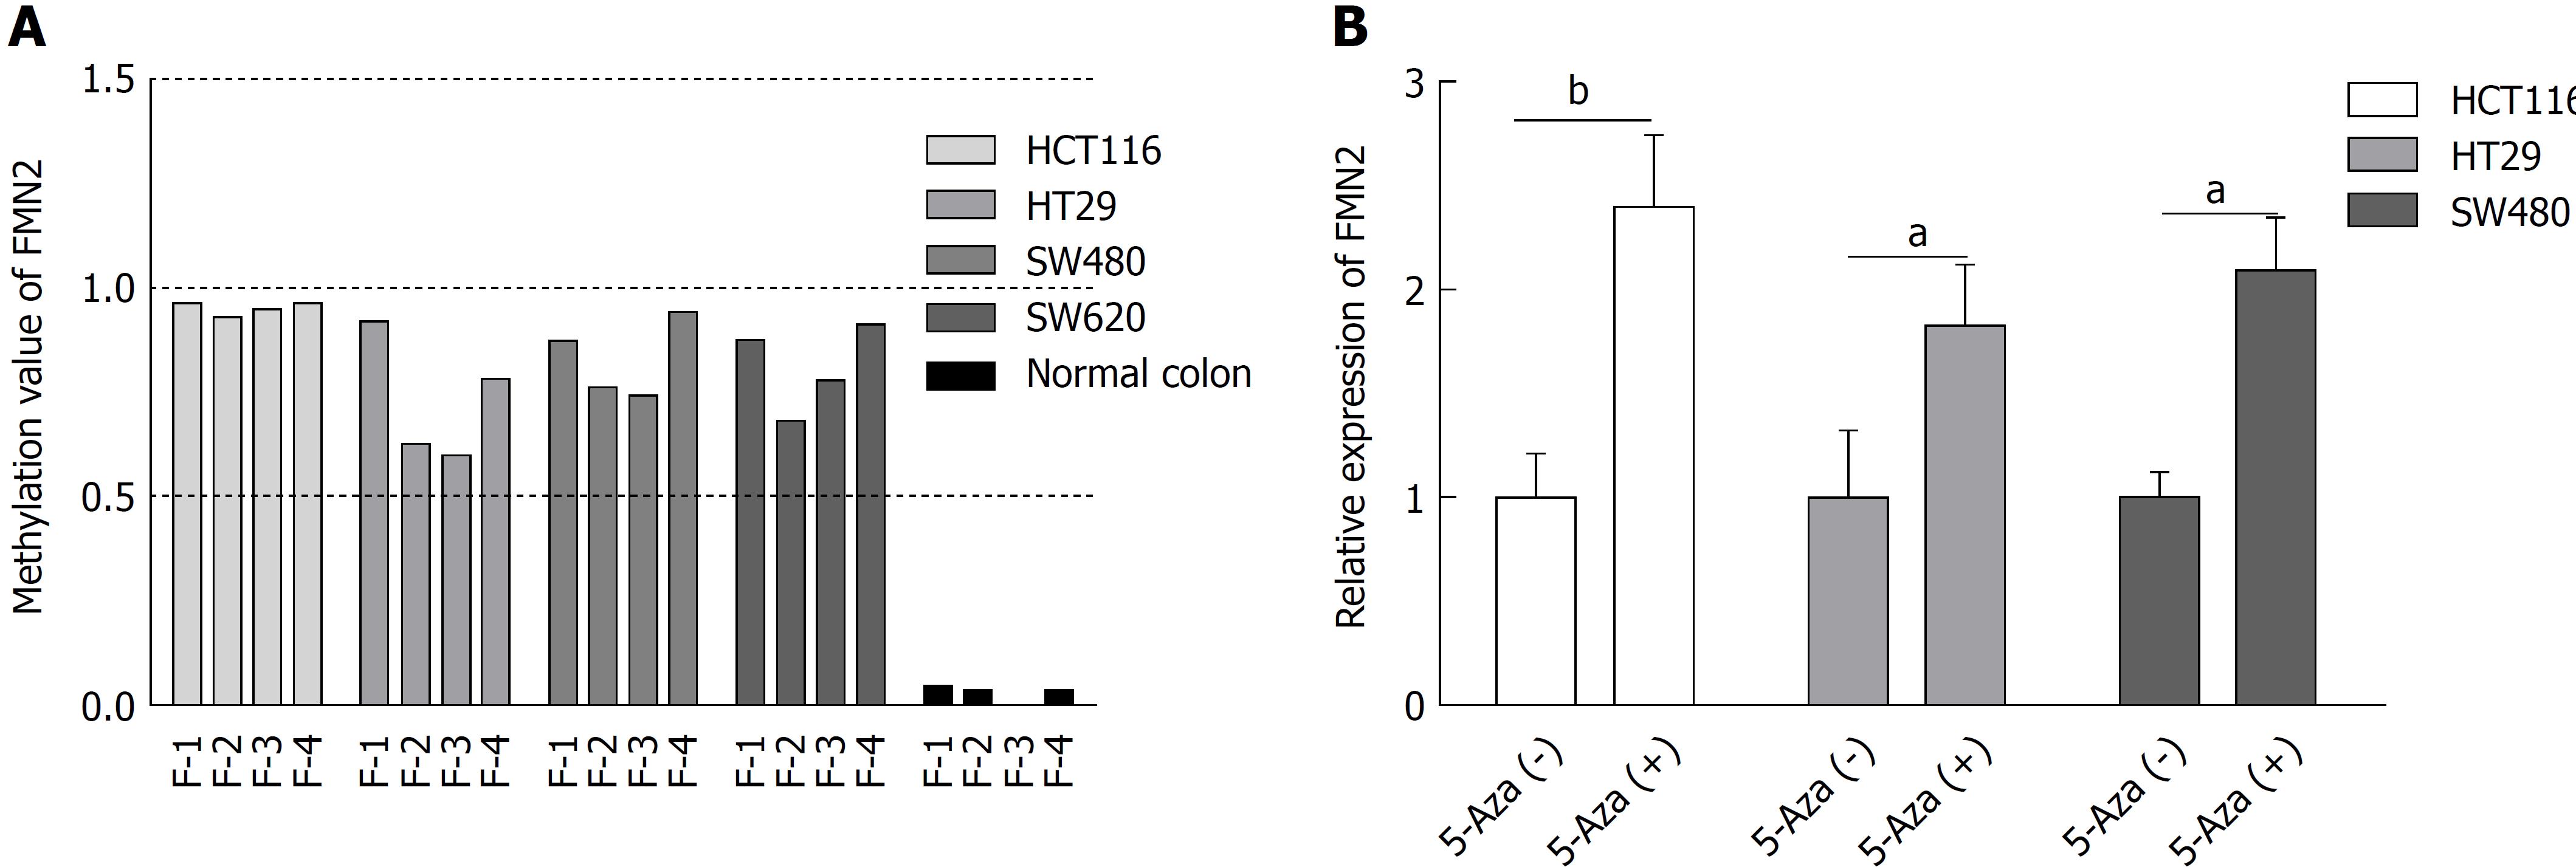
Figure 3 Promoter hypermethylation and formin 2 expression are causally related.
A: Results of MethylTarget™ assays on four colorectal cancer cell lines and normal colon cells from a healthy individual; B: The inhibition of DNA methylation with 5-Aza significantly increased the endogenous FMN2 expression (unpaired t-test).
Figure 4 Formin 2 promoter hypermethylation mainly occurs in early-stage colon cancer patients.
A: Formin 2 (FMN2) promoter methylation level in colorectal cancer (CRC) tissues with (yes) and without (no) lymphovascular invasion, presented as column means with 95%CI, mean connected. (unpaired t-test; normal: n = 45, CRC tissues with and without lymphovascular invasion: n = 231 and n = 107, respectively); B: FMN2 promoter methylation level in CRC tissues with (N1 + N2) and without (N0) regional lymph node metastasis, presented as column means with 95%CI, mean connected (unpaired t-test, Normal: n = 45, CRC tissues with and without regional lymph node metastasis: n = 212 and n = 173, according to the AJCC Cancer Staging Manual); C: FMN2 promoter methylation level in CRC tissues from different stages, presented as column means with 95%CI, mean connected (unpaired t-test; Normal: n = 45, Stages I + II: n = 197, Stages III + IV: n = 172, according to the AJCC Cancer Staging Manual); D: FMN2 promoter methylation level in different organ sites, presented as column means with 95%CI, mean connected; E and F: FMN2 hypermethylation has no effect on the overall survival or disease-free survival of CRC patients.
- Citation: Li DJ, Feng ZC, Li XR, Hu G. Involvement of methylation-associated silencing of formin 2 in colorectal carcinogenesis. World J Gastroenterol 2018; 24(44): 5013-5024
- URL: https://www.wjgnet.com/1007-9327/full/v24/i44/5013.htm
- DOI: https://dx.doi.org/10.3748/wjg.v24.i44.5013


