Copyright
©The Author(s) 2018.
World J Gastroenterol. Sep 14, 2018; 24(34): 3884-3897
Published online Sep 14, 2018. doi: 10.3748/wjg.v24.i34.3884
Published online Sep 14, 2018. doi: 10.3748/wjg.v24.i34.3884
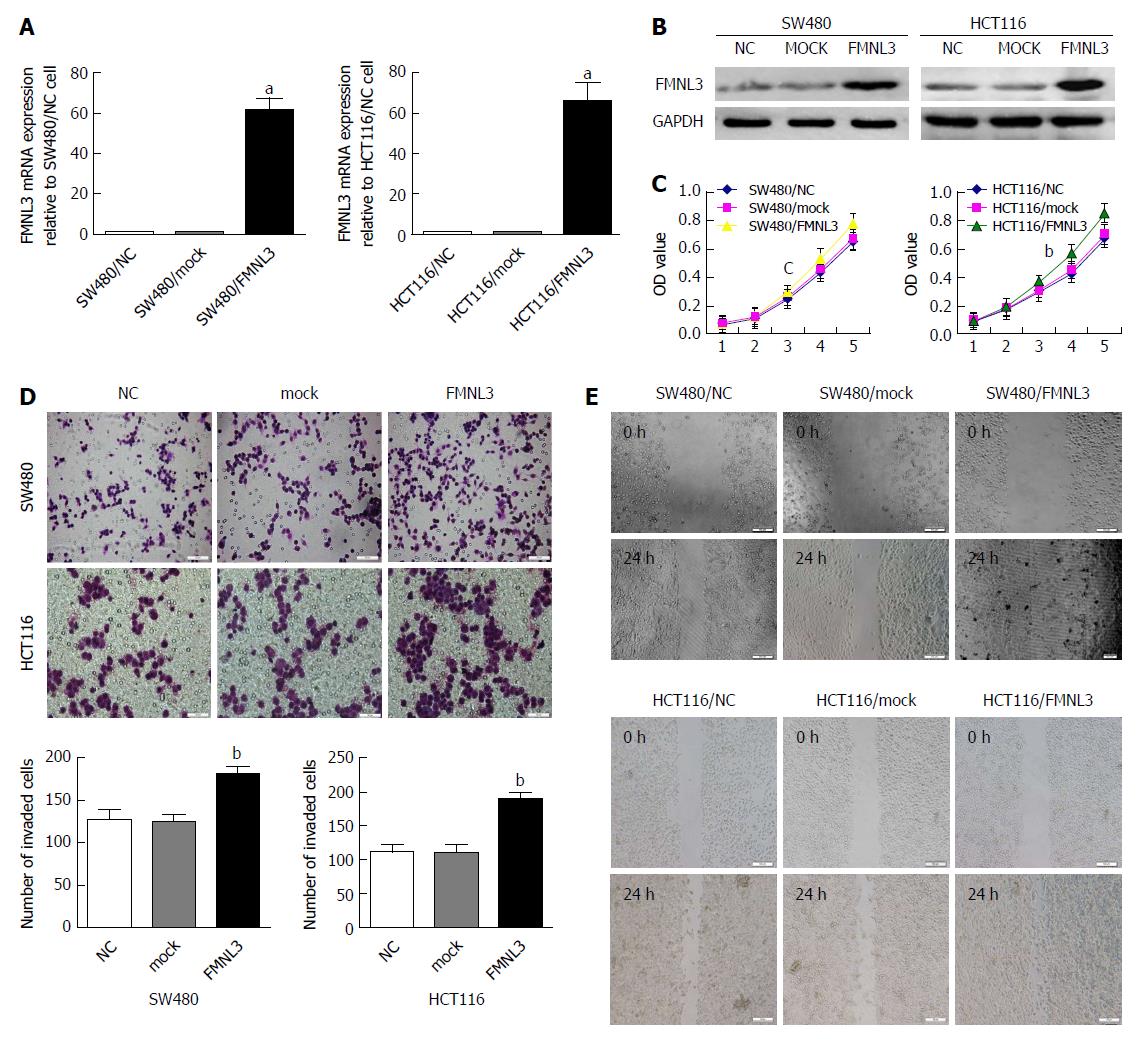
Figure 1 Forced expression of FMNL3 promotes colorectal carcinoma cell proliferation, invasion, and migration in vitro.
A and B: Identification of FMNL3 expression in FMNL3-overexpressing cells by real-time quantitative PCR and western blot. C: Effects of FMNL3 overexpression on cell proliferation by MTT assay. D: Effects of FMNL3 overexpression on invasive abilities by Boyden chamber assay. Morphological comparison of cell penetration into the artificial basement membrane is shown. E: Effects of FMNL3 overexpression on migratory abilities by scratch assay in vitro. Scale bars represent 50 μm (cell invasion assay) or 100 μm (cell migration assay), respectively. aP < 0.001, bP < 0.01 and cP < 0.05 vs NC or mock group. Error bars indicate mean ± SD.
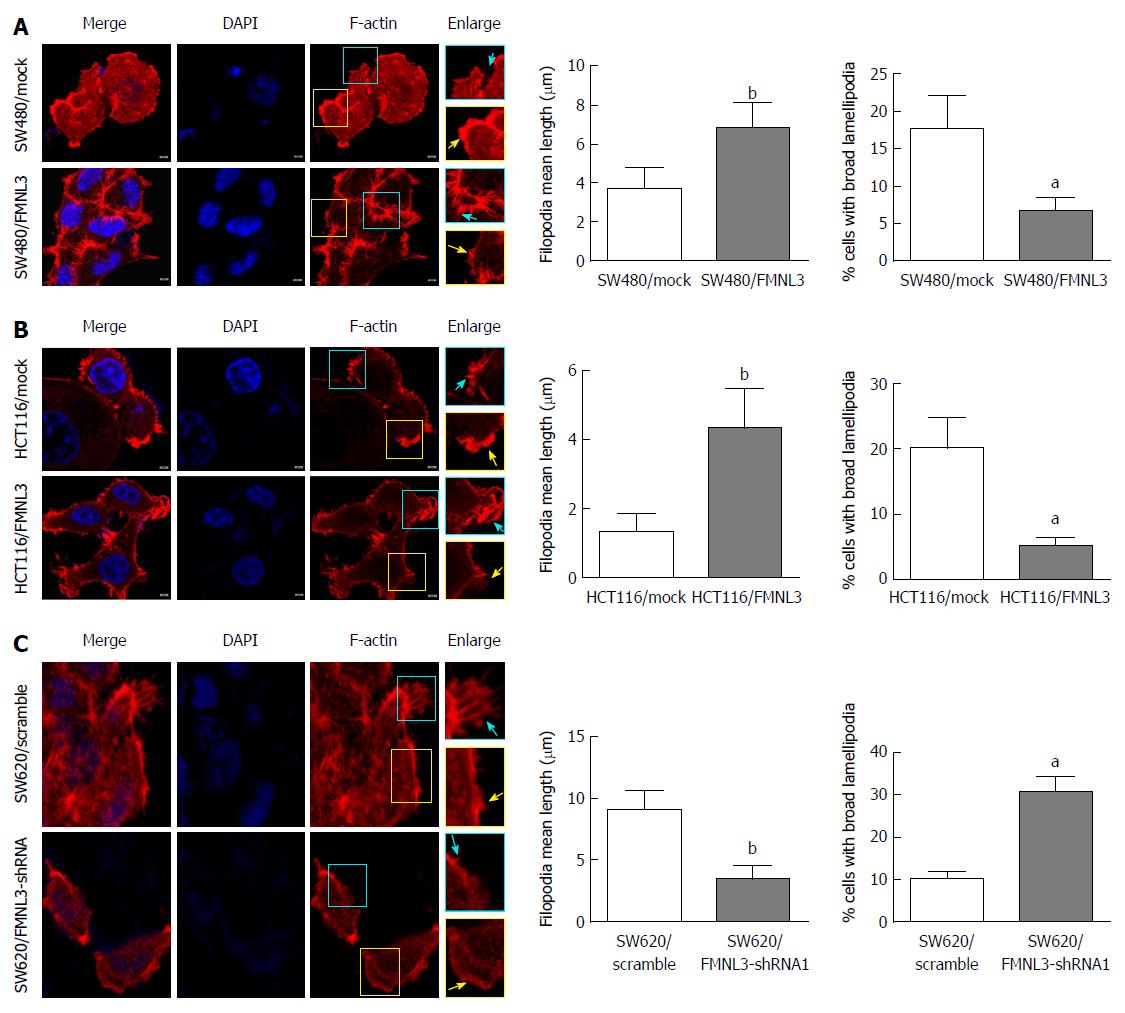
Figure 2 Effects of formin-like 3 overexpression (A and B) and depletion (C) on filopodia and lamellipodia in colorectal carcinoma cells.
Cells are displayed using tritc-phalloidine (F-actin, Red) and DAPI (nuclear, blue) staining, and laser scanning confocal microscopy detection. Enlarged views of the boxed regions are shown on the right side of the figures. Blue arrows indicate filopodia, yellow arrows indicate lamellipodia. Scale bars represent 5 μm. aP < 0.001, and bP < 0.01 vs mock or scramble group. Error bars indicate mean ± SD. FMNL3: Formin-like 3.
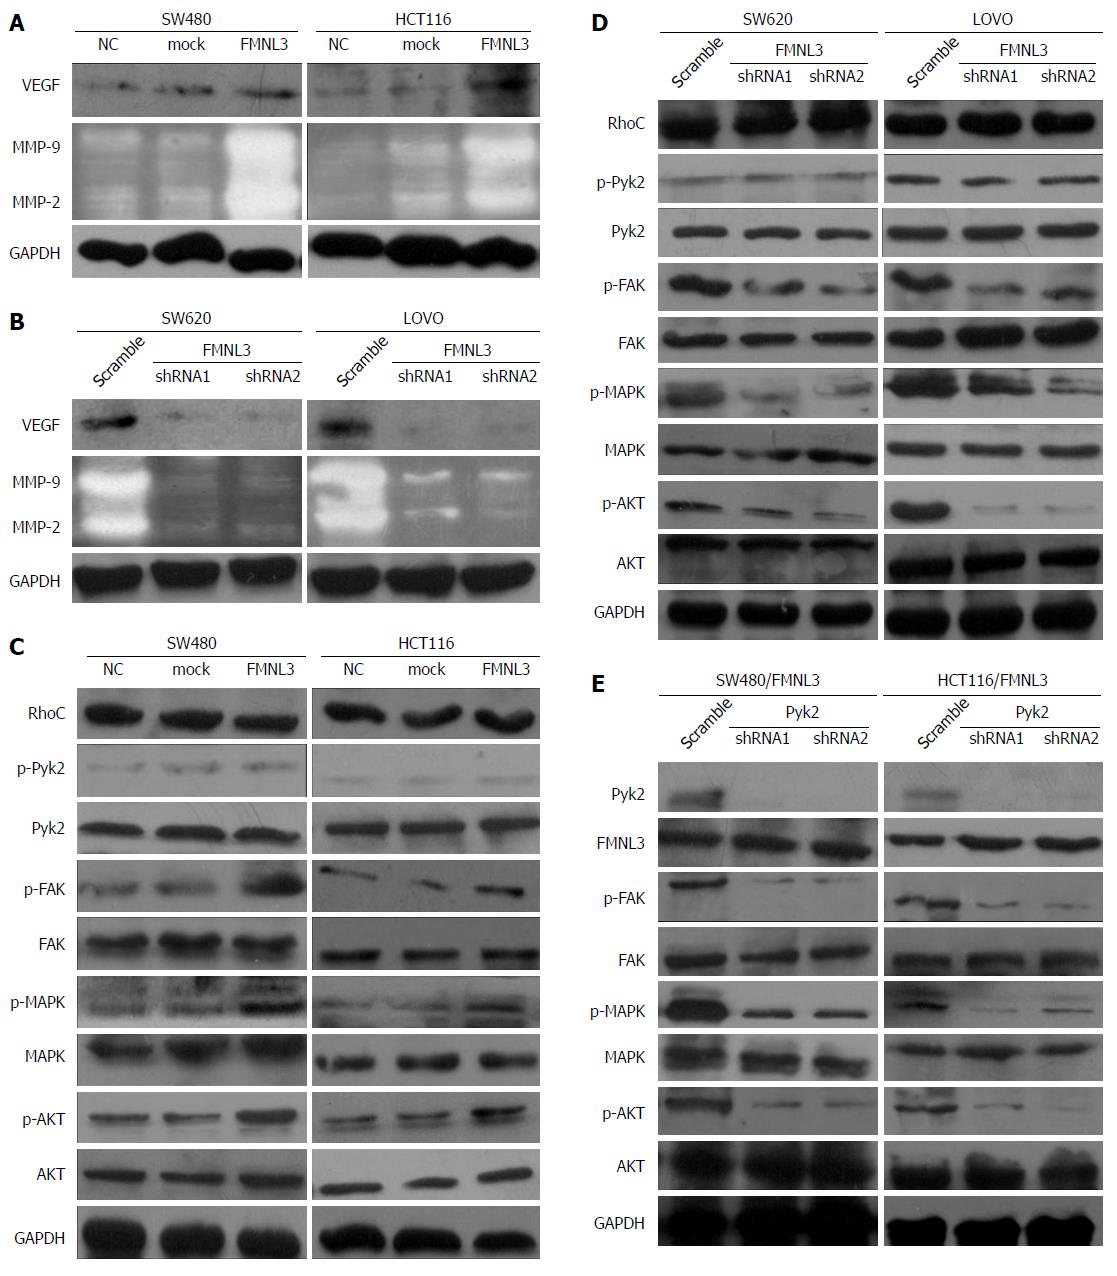
Figure 3 Formin-like 3 regulates the RhoC/FAK signaling pathway to promote colorectal carcinoma invasion.
A and B: Analysis of VEGF, MMP-2 and MMP-9 expression in FMNL3-overexpressing or -depleted colorectal carcinoma cells by western blot and gelatin zymography experiments, respectively. C and D: Analysis of the effects of FMNL3 overexpression or depletion on the expression of RhoC, (p-)Pyk2, (p-)FAK, (p-)MAPK and (p-)AKT by western blot. E: Effects of Pyk2 silencing on the expression of FMNL3, (p-)FAK, (p-)MAPK and (p-)AKT in FMNL3-expressing cells by western blot. FMNL3: Formin-like 3; VEGF: vascular endothelial growth factor; MMP: matrix metalloprotein; Pyk2: Proline rich tyrosine kinase 2; FAK: Focal adhesion kinase; MAPK: Mitogen activated protein kinases; AKT: Protein kinase B.
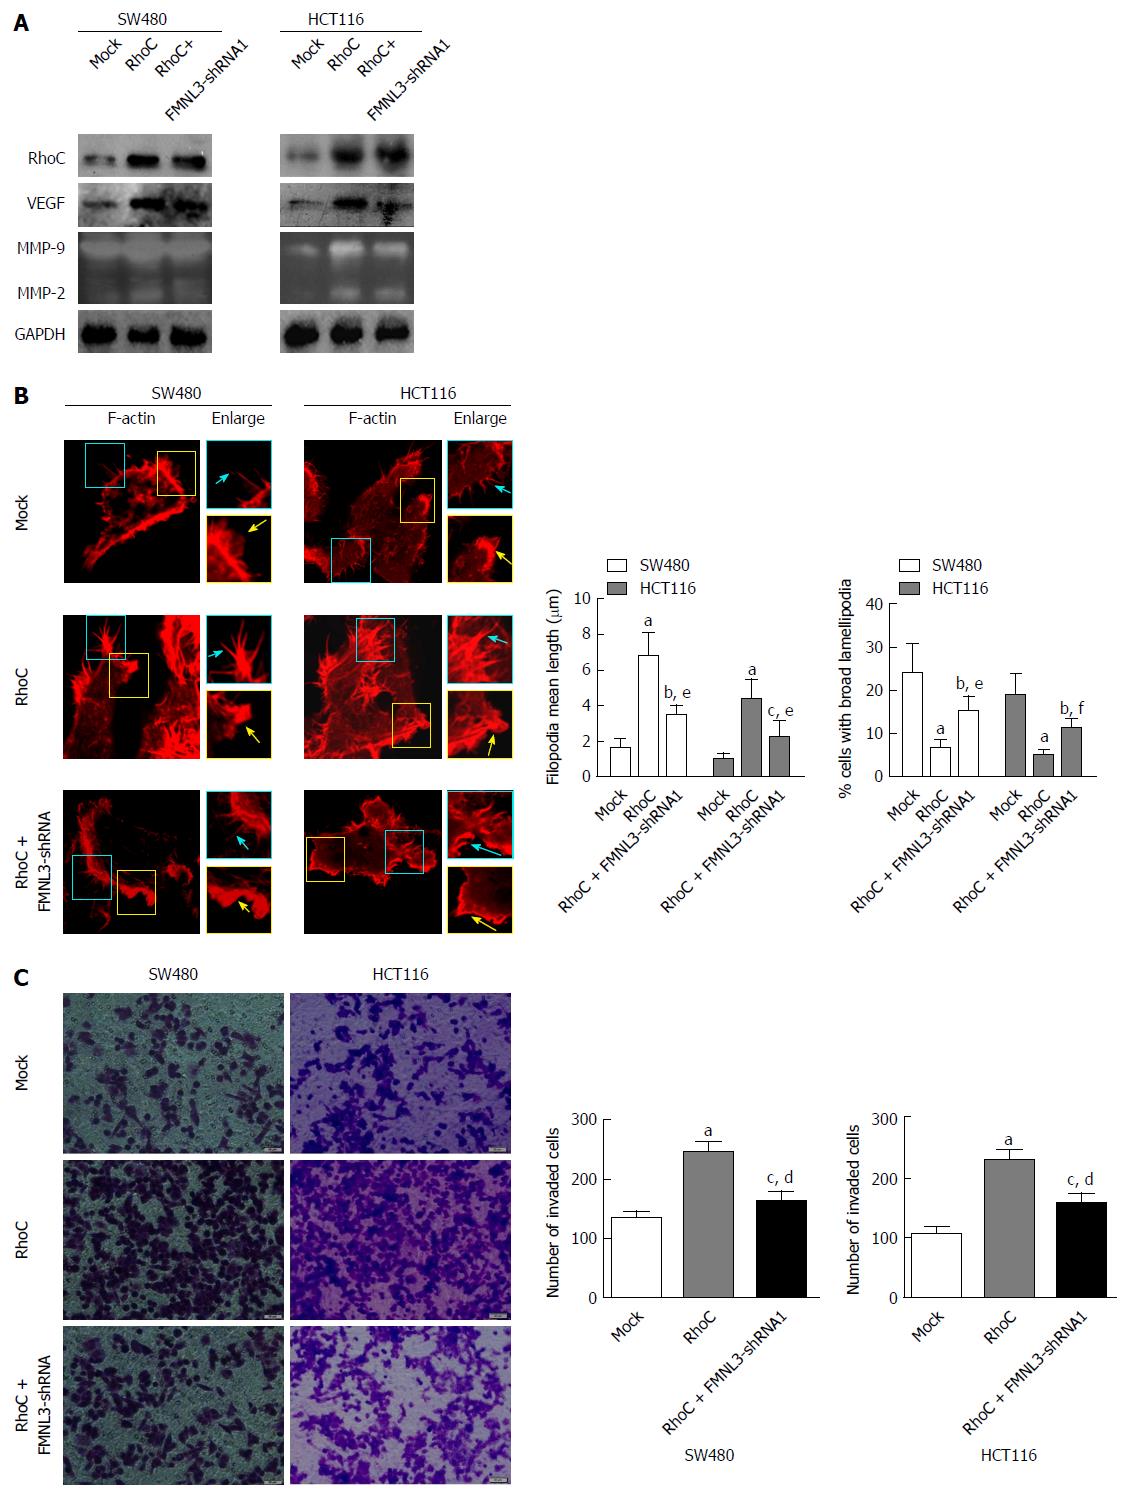
Figure 4 Formin-like 3 depletion blocks RhoC-dependent increases of matrix metalloproteins and vascular endothelial growth factor (A), assembly of actin-based protrusions (B), and invasion (C) in colorectal carcinoma cells.
MMPs and VEGF were detected by gelatin zymography experiments and western blot. F-actin is displayed using tritc-phalloidine (Red) staining and laser scanning confocal microscopy detection. Enlarged views of the boxed regions are shown on the right side of the figures. Blue arrows indicate filopodia, yellow arrows indicate lamellipodia. Cell invasion was compared using the Boyden chamber assay. Scale bars represent 5 μm (F-actin) or 50 μm (cell invasion assay), respectively. aP < 0.001, bP < 0.01 and cP < 0.05 vs Mock group, dP < 0.001, eP < 0.01 and fP < 0.05 vs RhoC-overexpressing group. Error bars indicate mean ± SD. FMNL3: Formin-like 3; MMP: Matrix metalloprotein; VEGF: Vascular endothelial growth factor.
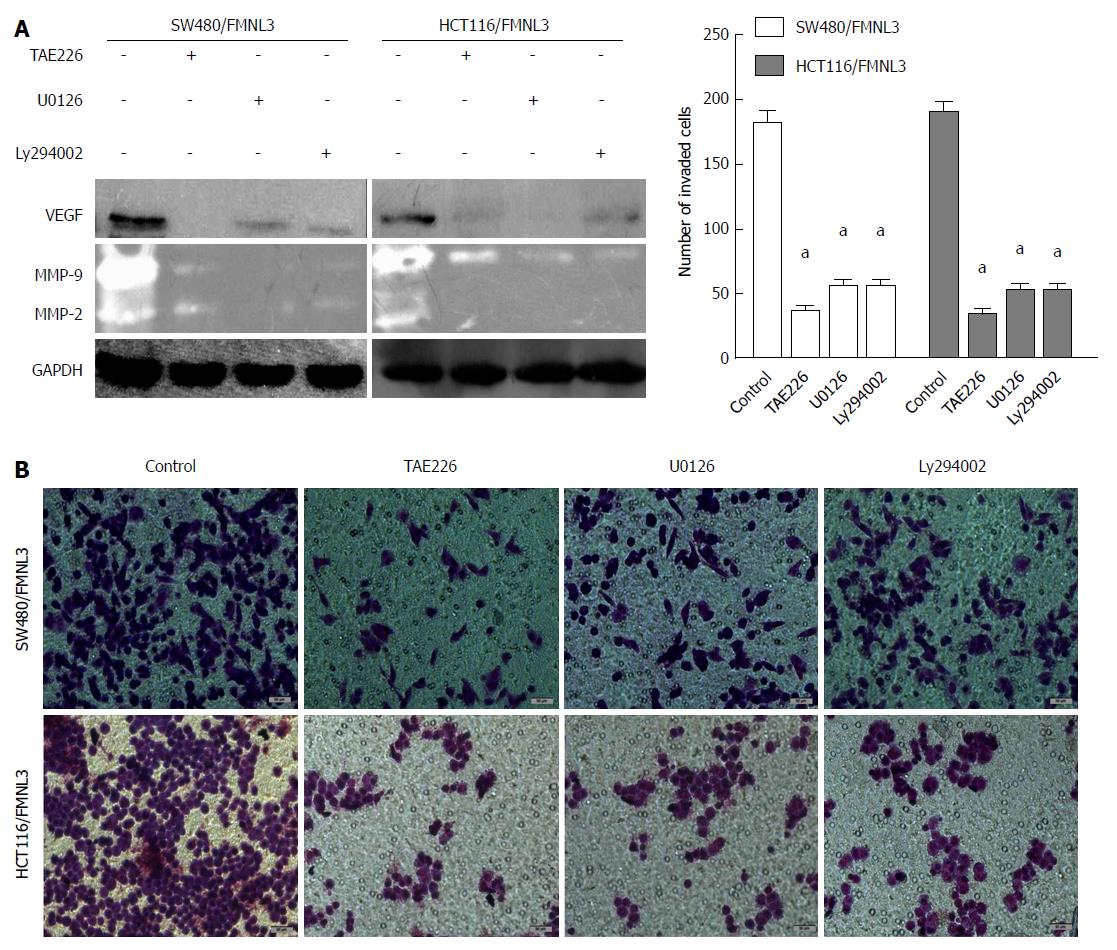
Figure 5 Effects of TAE226, U0126 and Ly294002 treatments, respectively, on the expression of matrix metalloproteins and vascular endothelial growth factor by gelatin zymography experiments and western blot (A), as well as cell invasion by Boyden chamber assay (B and C).
Morphological comparison of cells penetrating into the artificial basement membrane is also shown. Scale bars represent 50 μm. aP < 0.001 vs control group. Error bars indicate mean ± SD. MMP: Matrix metalloprotein; VEGF: Vascular endothelial growth factor.
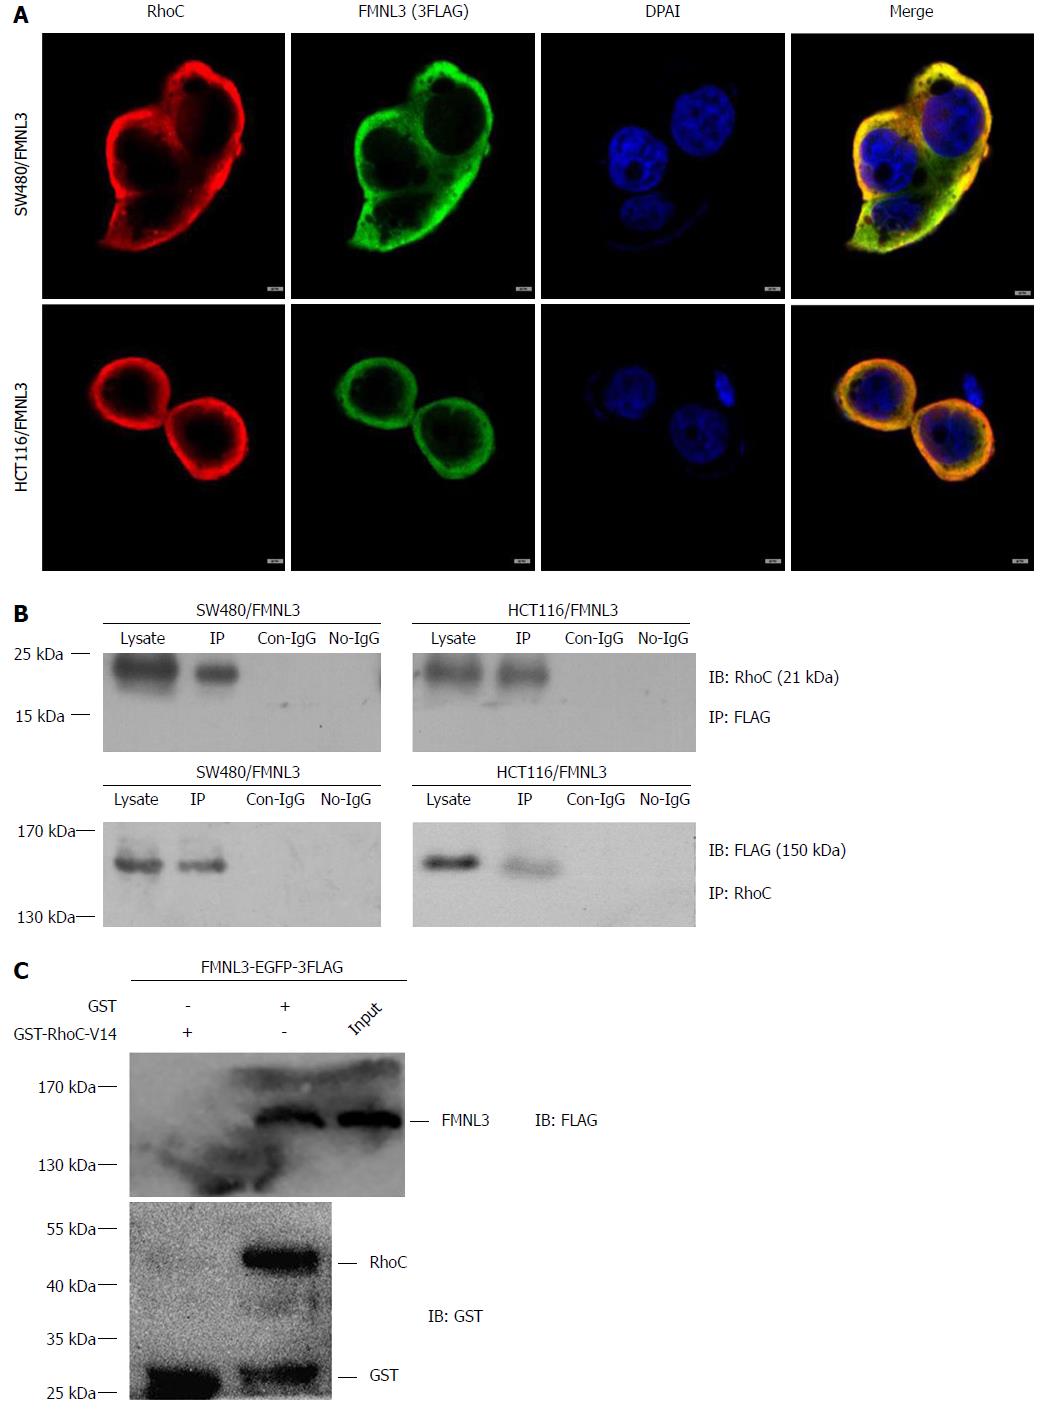
Figure 6 Interaction of formin-like 3 with RhoC.
A: FMNL3 co-localizes with RhoC in the cytoplasm, detected by immunofluorescence staining and laser confocal microscope. B and C: FMNL3 interacts directly with RhoC in co-immunoprecipitation experiments and GST-pull down assays in vitro. Scale bars represent 5 μm. IP: Immunoprecipitation; GST: Glutathionine-S-transferase; FMNL3: Formin-like 3.
- Citation: Zeng YF, Xiao YS, Liu Y, Luo XJ, Wen LD, Liu Q, Chen M. Formin-like 3 regulates RhoC/FAK pathway and actin assembly to promote cell invasion in colorectal carcinoma. World J Gastroenterol 2018; 24(34): 3884-3897
- URL: https://www.wjgnet.com/1007-9327/full/v24/i34/3884.htm
- DOI: https://dx.doi.org/10.3748/wjg.v24.i34.3884


