Copyright
©The Author(s) 2018.
World J Gastroenterol. Sep 14, 2018; 24(34): 3884-3897
Published online Sep 14, 2018. doi: 10.3748/wjg.v24.i34.3884
Published online Sep 14, 2018. doi: 10.3748/wjg.v24.i34.3884
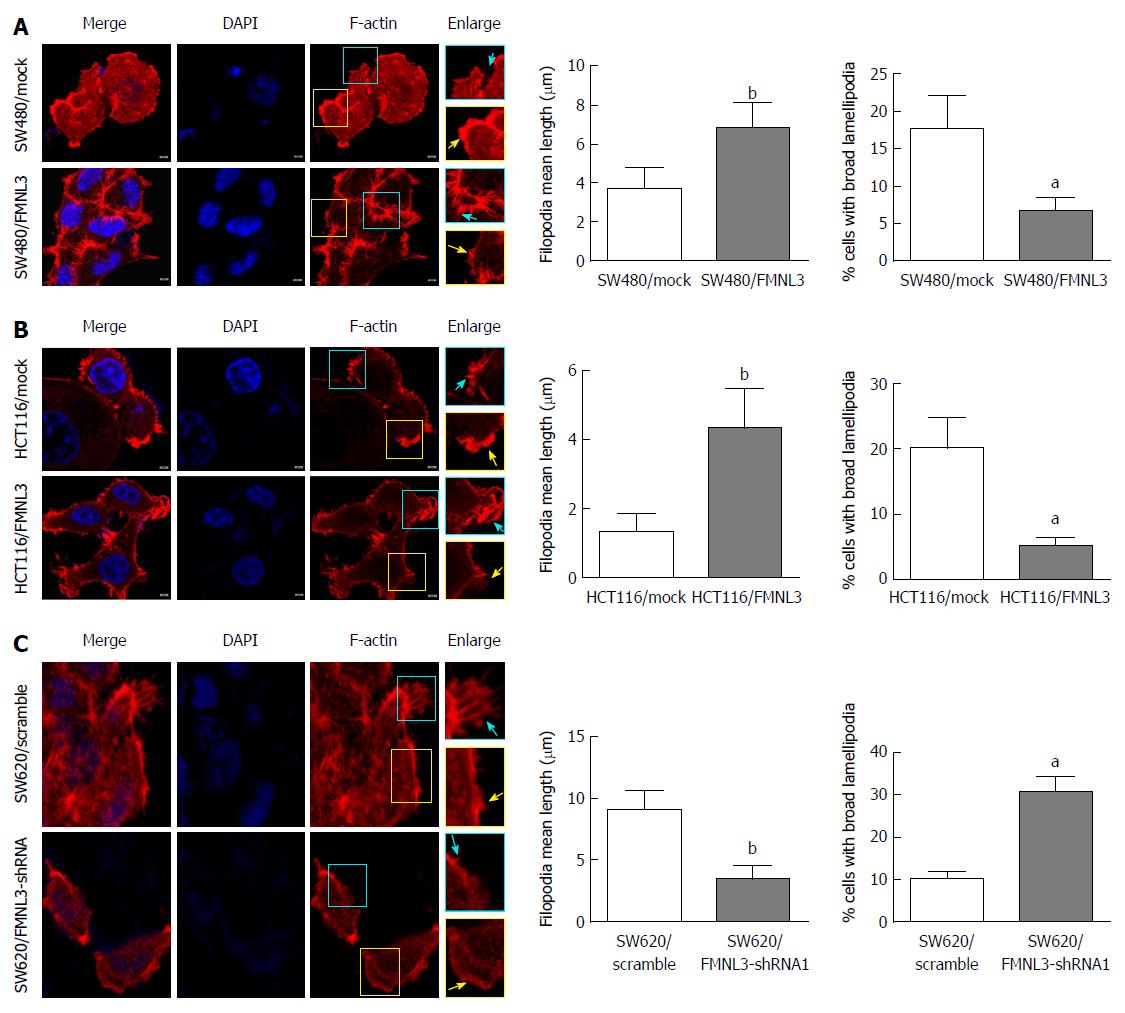
Figure 2 Effects of formin-like 3 overexpression (A and B) and depletion (C) on filopodia and lamellipodia in colorectal carcinoma cells.
Cells are displayed using tritc-phalloidine (F-actin, Red) and DAPI (nuclear, blue) staining, and laser scanning confocal microscopy detection. Enlarged views of the boxed regions are shown on the right side of the figures. Blue arrows indicate filopodia, yellow arrows indicate lamellipodia. Scale bars represent 5 μm. aP < 0.001, and bP < 0.01 vs mock or scramble group. Error bars indicate mean ± SD. FMNL3: Formin-like 3.
- Citation: Zeng YF, Xiao YS, Liu Y, Luo XJ, Wen LD, Liu Q, Chen M. Formin-like 3 regulates RhoC/FAK pathway and actin assembly to promote cell invasion in colorectal carcinoma. World J Gastroenterol 2018; 24(34): 3884-3897
- URL: https://www.wjgnet.com/1007-9327/full/v24/i34/3884.htm
- DOI: https://dx.doi.org/10.3748/wjg.v24.i34.3884


