Copyright
©The Author(s) 2018.
World J Gastroenterol. Aug 21, 2018; 24(31): 3531-3537
Published online Aug 21, 2018. doi: 10.3748/wjg.v24.i31.3531
Published online Aug 21, 2018. doi: 10.3748/wjg.v24.i31.3531
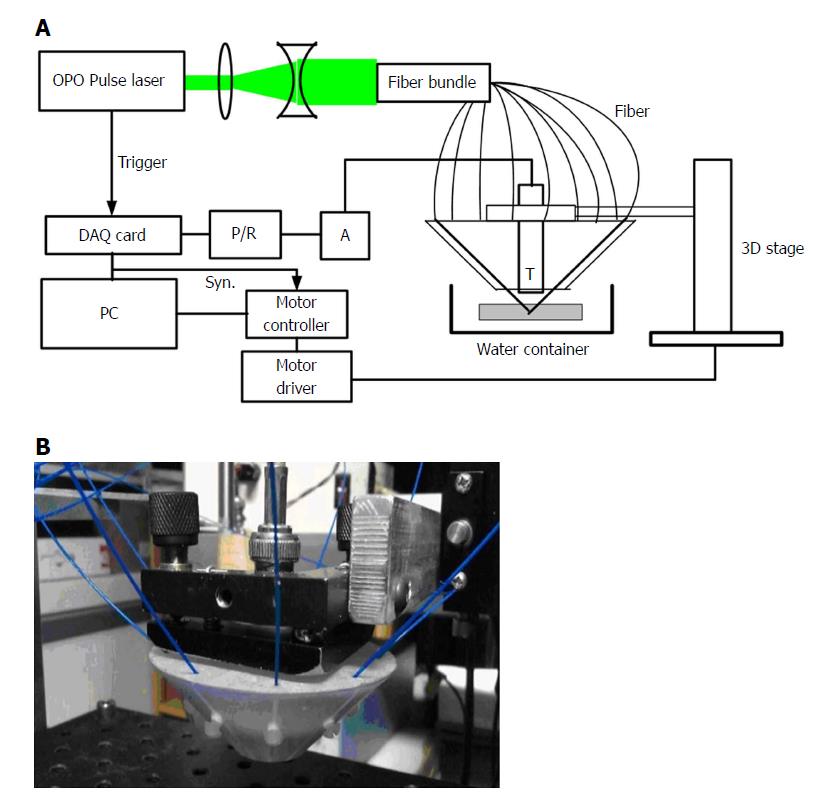
Figure 1 Schematic of the acoustic resolution photoacoustic microscopy system (A) and photograph of the photoacoustic probe (B).
P/R: Pulser/receiver; A: Preamplifier; T: Transducer, PC: Personal computer.
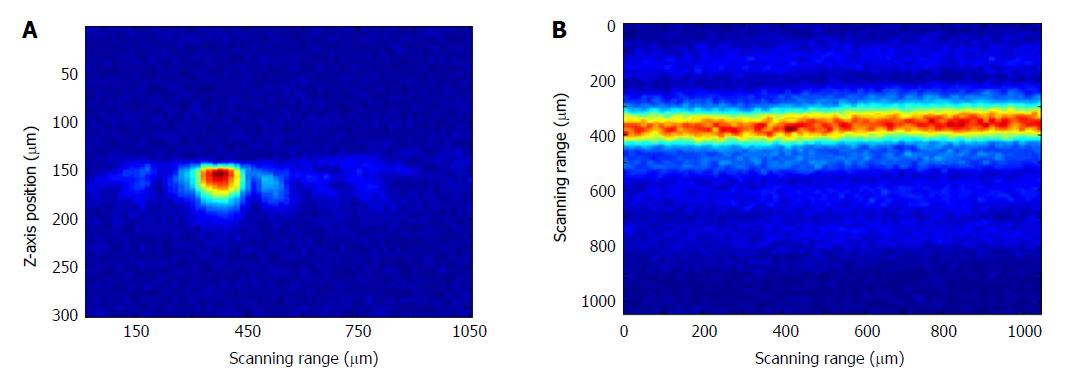
Figure 2 Photoacoustic image of a hair with a diameter of 80 μm.
A: B-scan imaging. B: C-scan imaging.
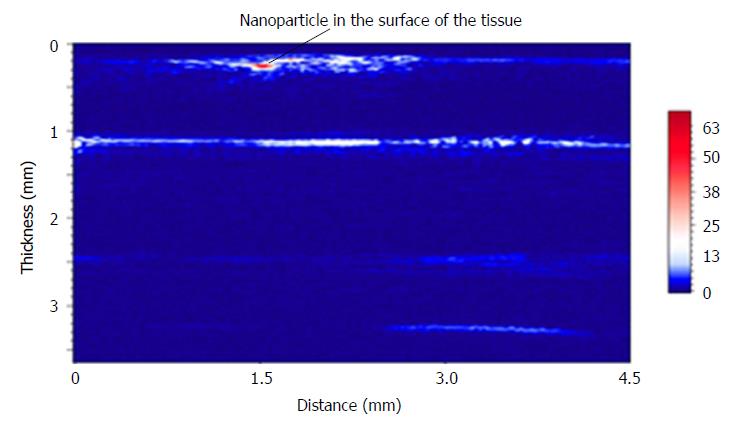
Figure 3 Imaging of layer-by-layer structure of stomach wall.
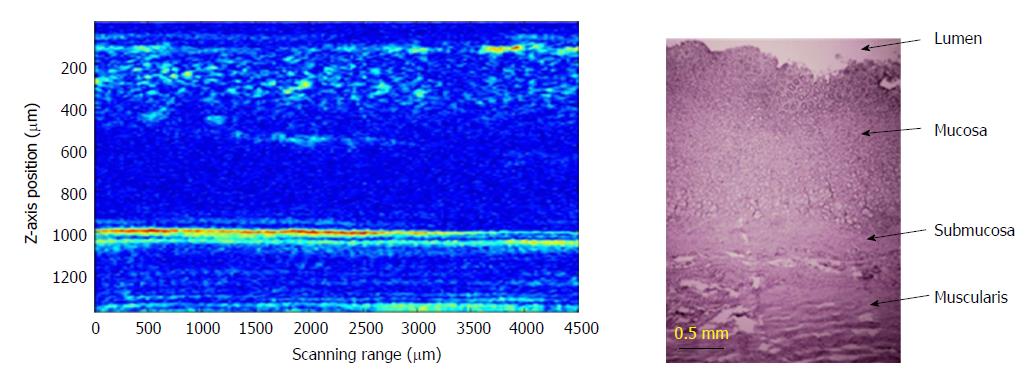
Figure 4 Compared photoacoustic image with pathological photograph stained by hematoxylin-eosin staining for mucosa and submucosa of the tissue.
Figure 5 Photograph of the dissected stomach wall after imaging by photoacoustic microscopy (A) and photoacoustic imaging under surface of the tissue of 500 μm (red arrow indicate vessels) (B).
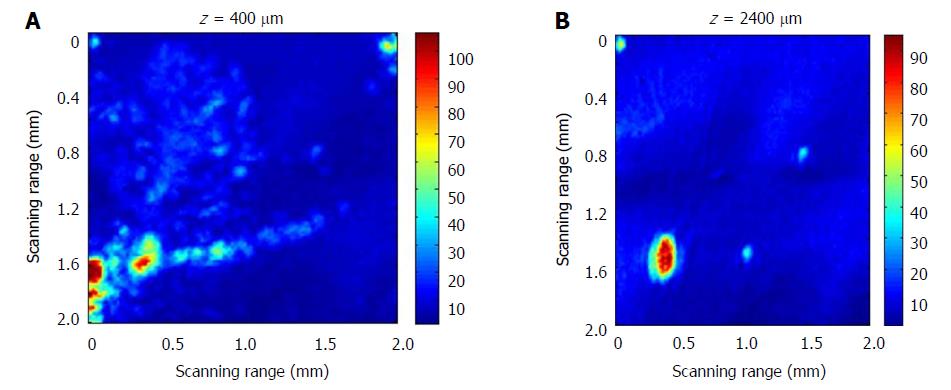
Figure 6 Photoacoustic imaging with laser wavelength of 700 nm for contrast agent with concentration of 12.
9 μM/mL in depth of 400 μm (A) and 2400 μm (B).
- Citation: Wang C, Lu YF, Cai CM, Xiang HZ, Zheng G. Stomach wall structure and vessels imaging by acoustic resolution photoacoustic microscopy. World J Gastroenterol 2018; 24(31): 3531-3537
- URL: https://www.wjgnet.com/1007-9327/full/v24/i31/3531.htm
- DOI: https://dx.doi.org/10.3748/wjg.v24.i31.3531


