Copyright
©The Author(s) 2018.
World J Gastroenterol. Aug 14, 2018; 24(30): 3384-3397
Published online Aug 14, 2018. doi: 10.3748/wjg.v24.i30.3384
Published online Aug 14, 2018. doi: 10.3748/wjg.v24.i30.3384
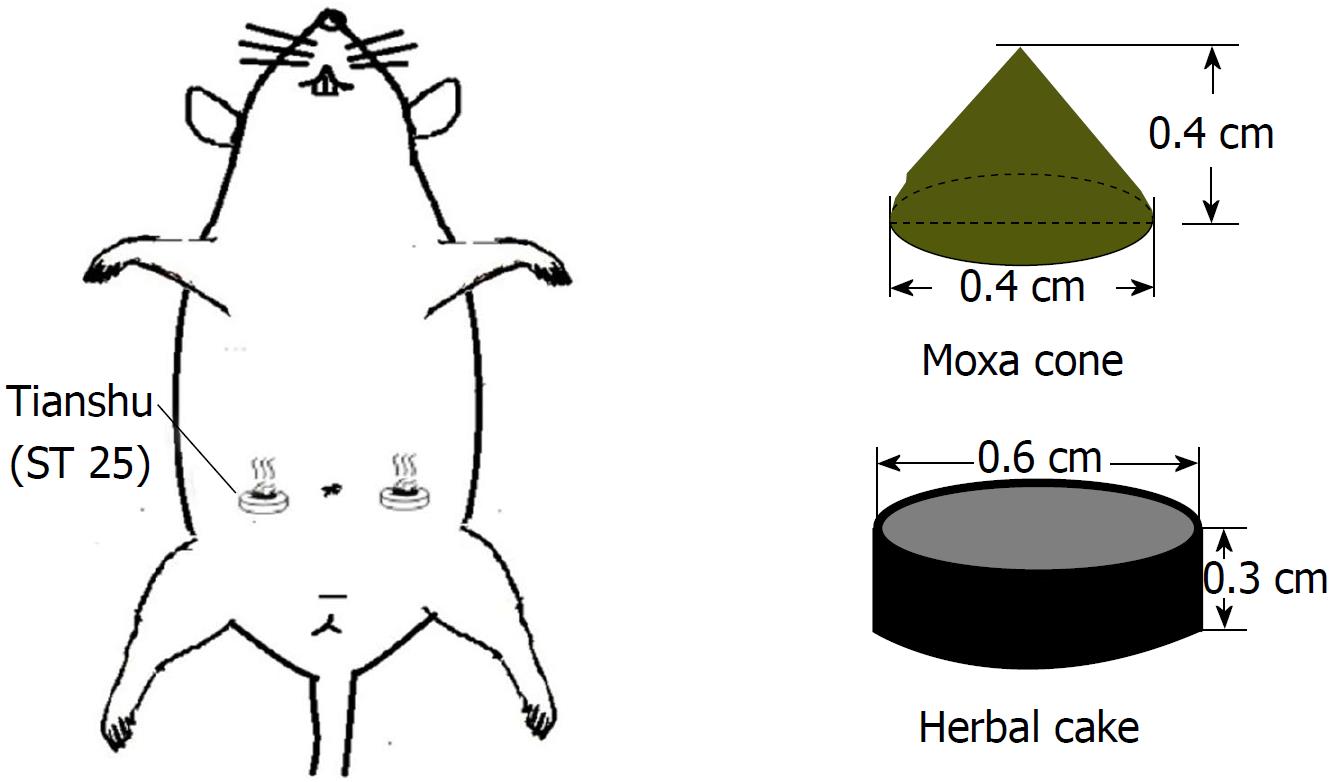
Figure 1 Illustration of herb-partitioned moxibustion.
An herbal cake was placed on Tianshu (ST25) point with a moxa cone on the top to ignite. This point is located at the lower 1/3 between the xiphoid process and the midpoint of the pubic symphysis, 0.5 cm away.
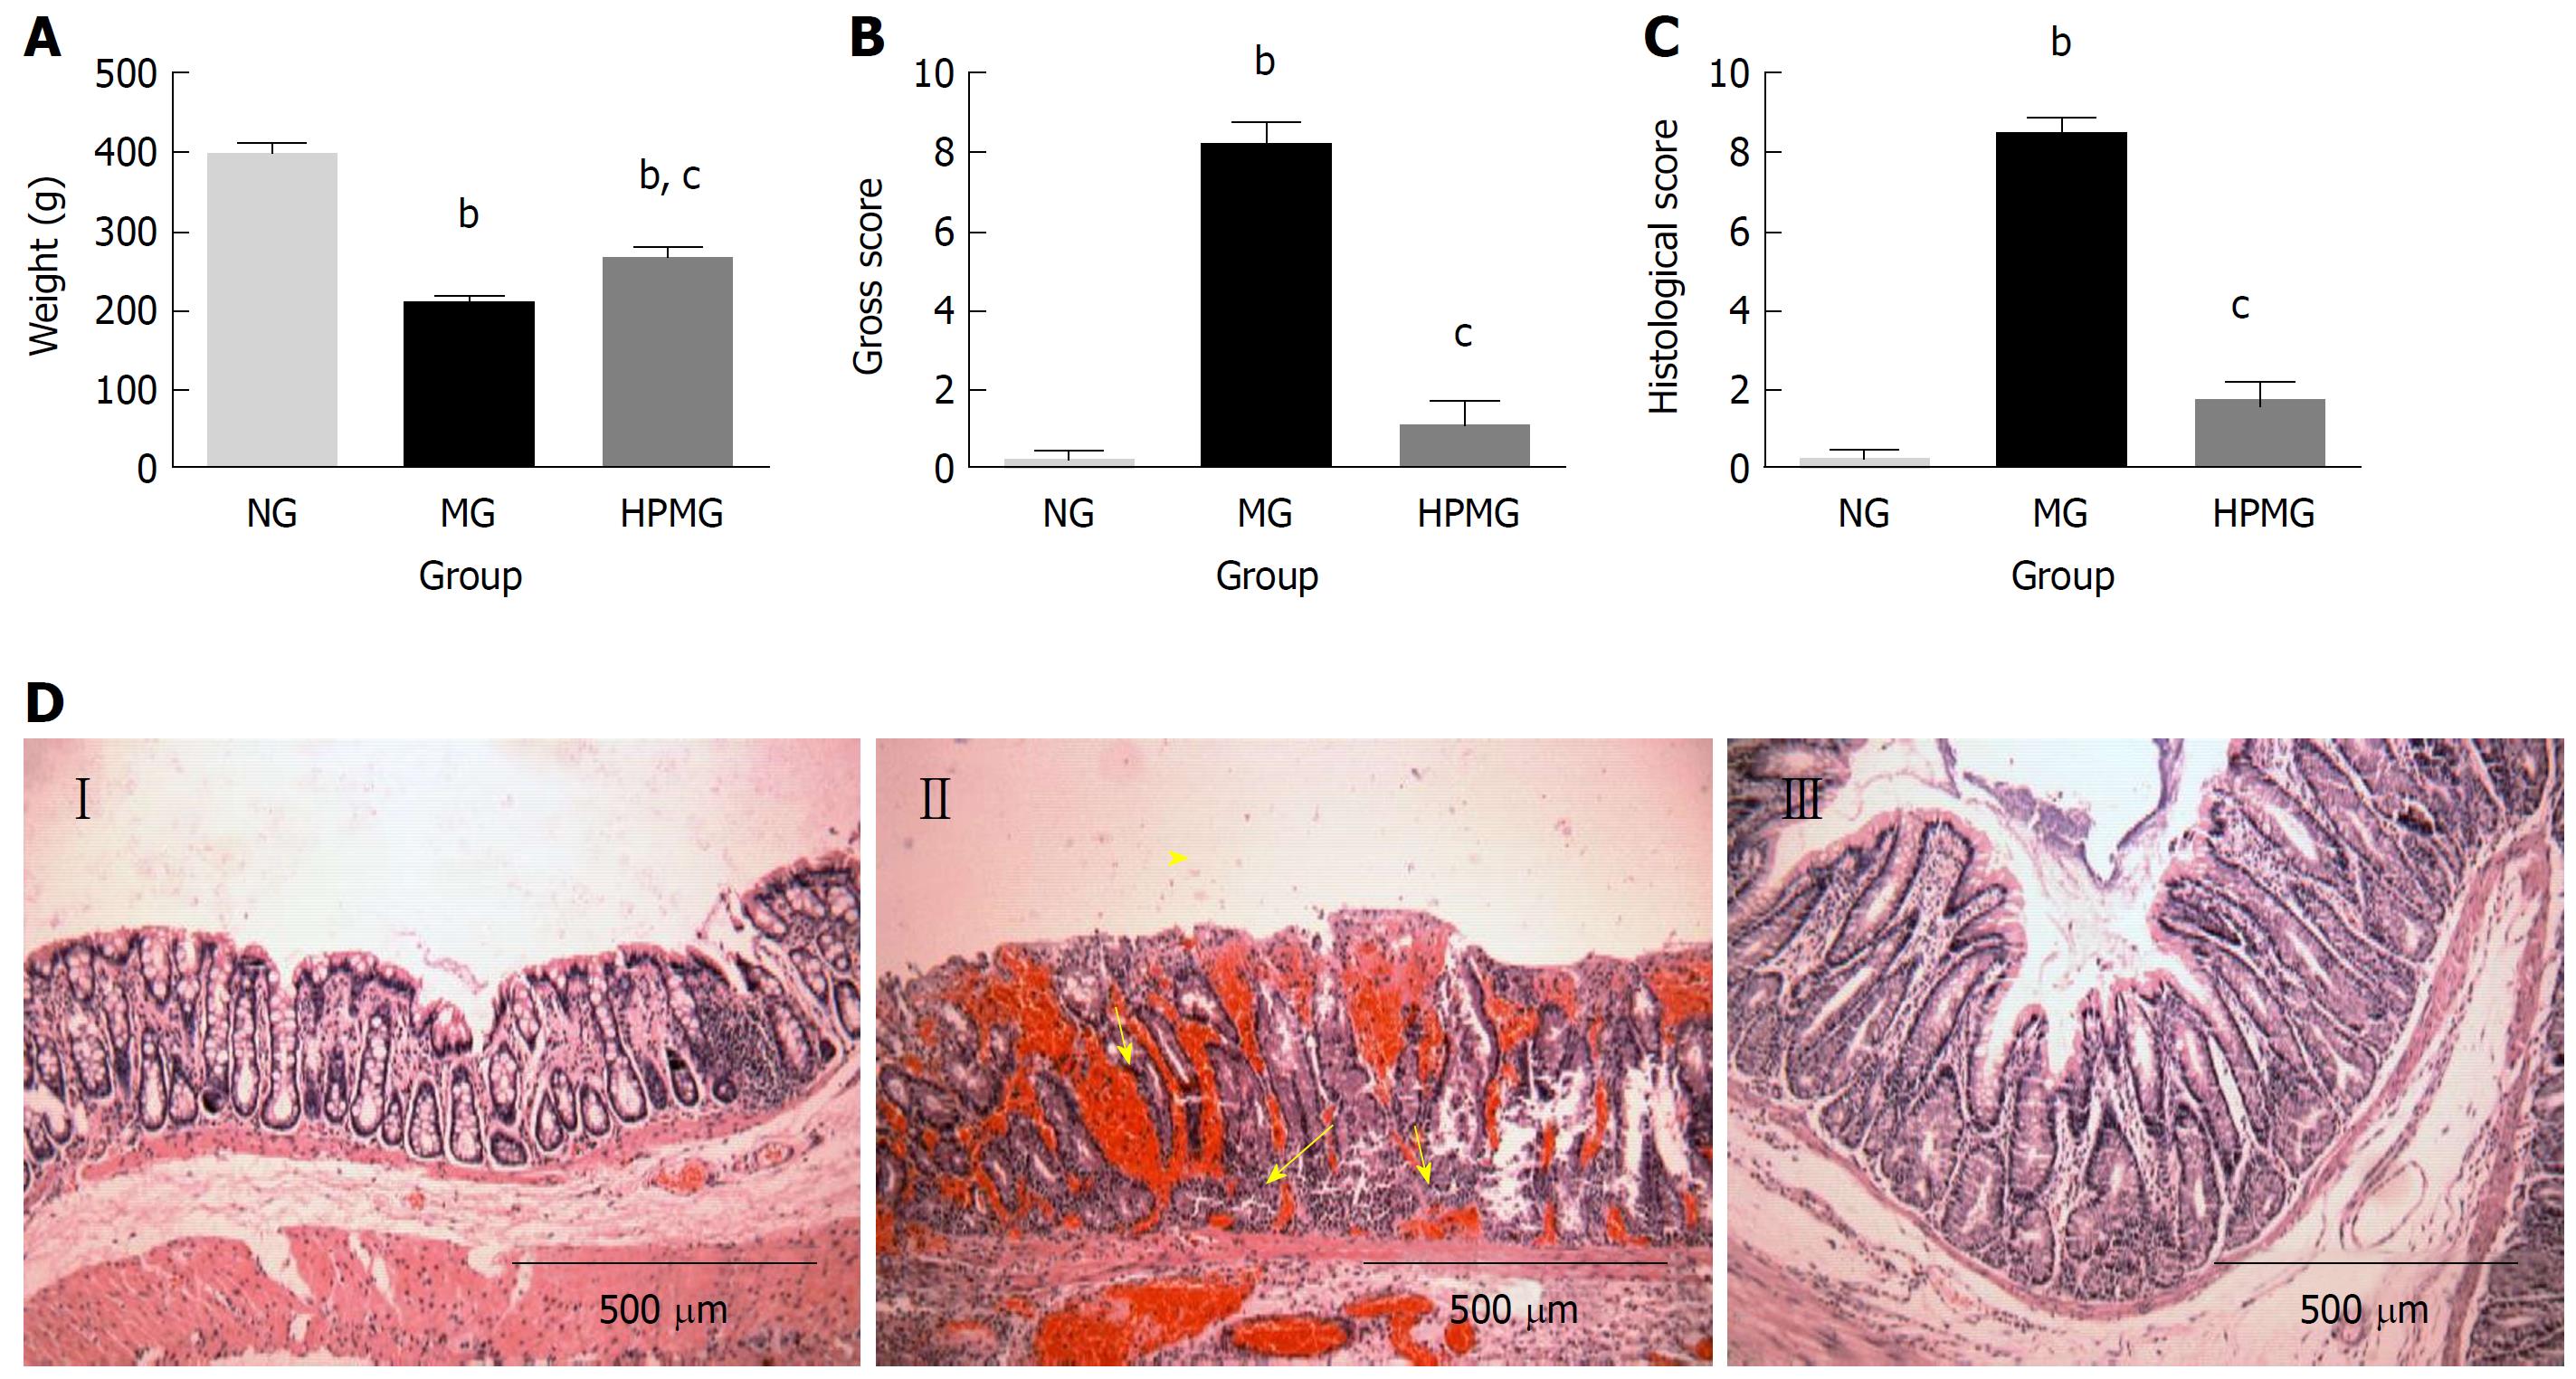
Figure 2 General condition, morphological observation and injury score of colon tissues in each group.
A: Weight change of rats in each group; B: Gross injury score of rat colon in each group; C: Histological score of rat colon in each group; D: Histological and morphological structure under microscope by hematoxylin-eosin staining (Amplification × 100). NG (I): Normal group, MG (II): Model group; HPMG (III): Herb-partitioned moxibustion group. Data are presented as the mean ± SD, n = 8 per group. bP < 0.01 (vs normal group); cP < 0.01 (vs model group).
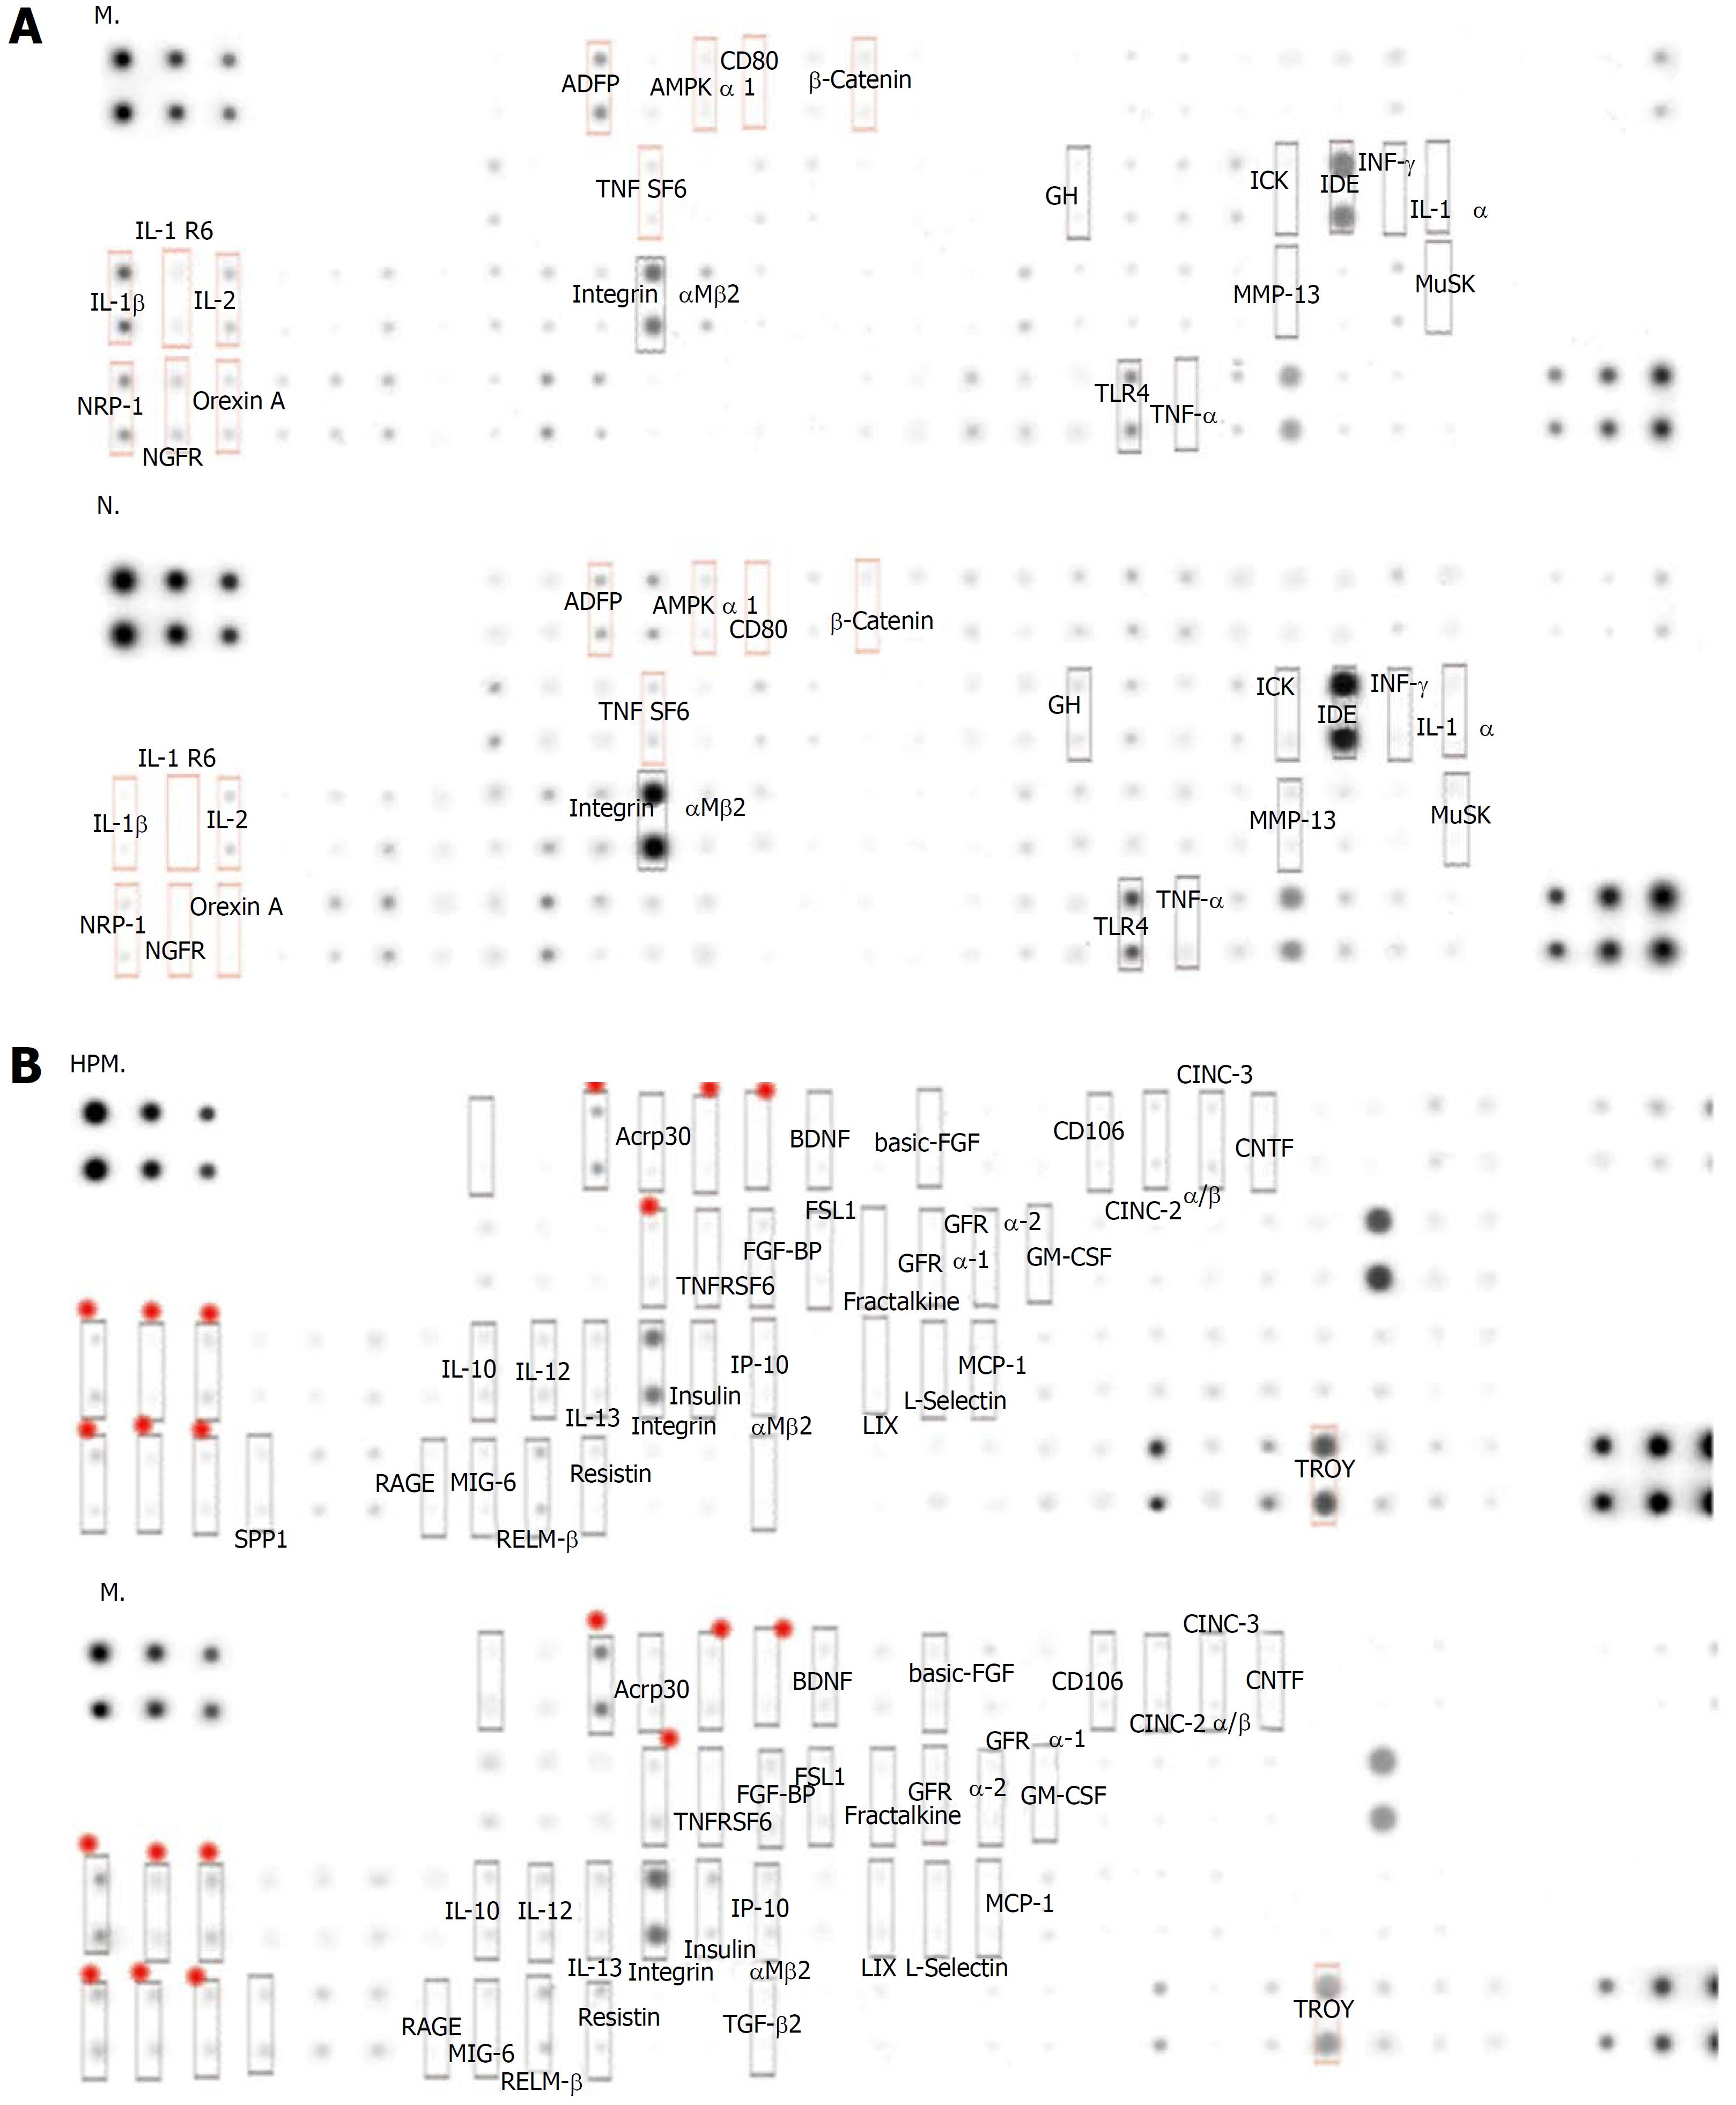
Figure 3 Protein abundances of colonic cytokines in each group.
A: MG vs NG in comparing the change in mean protein abundance, and the cytokines with an obvious change are shown in the figure; B: HPMG vs MG in comparing the change in mean protein abundance, and the cytokines with an obvious change are shown in the figure. The significantly down-regulated proteins are marked in red (the focus of this study). NG: Normal group; MG: Model group; HPMG: Herb-partitioned moxibustion group.
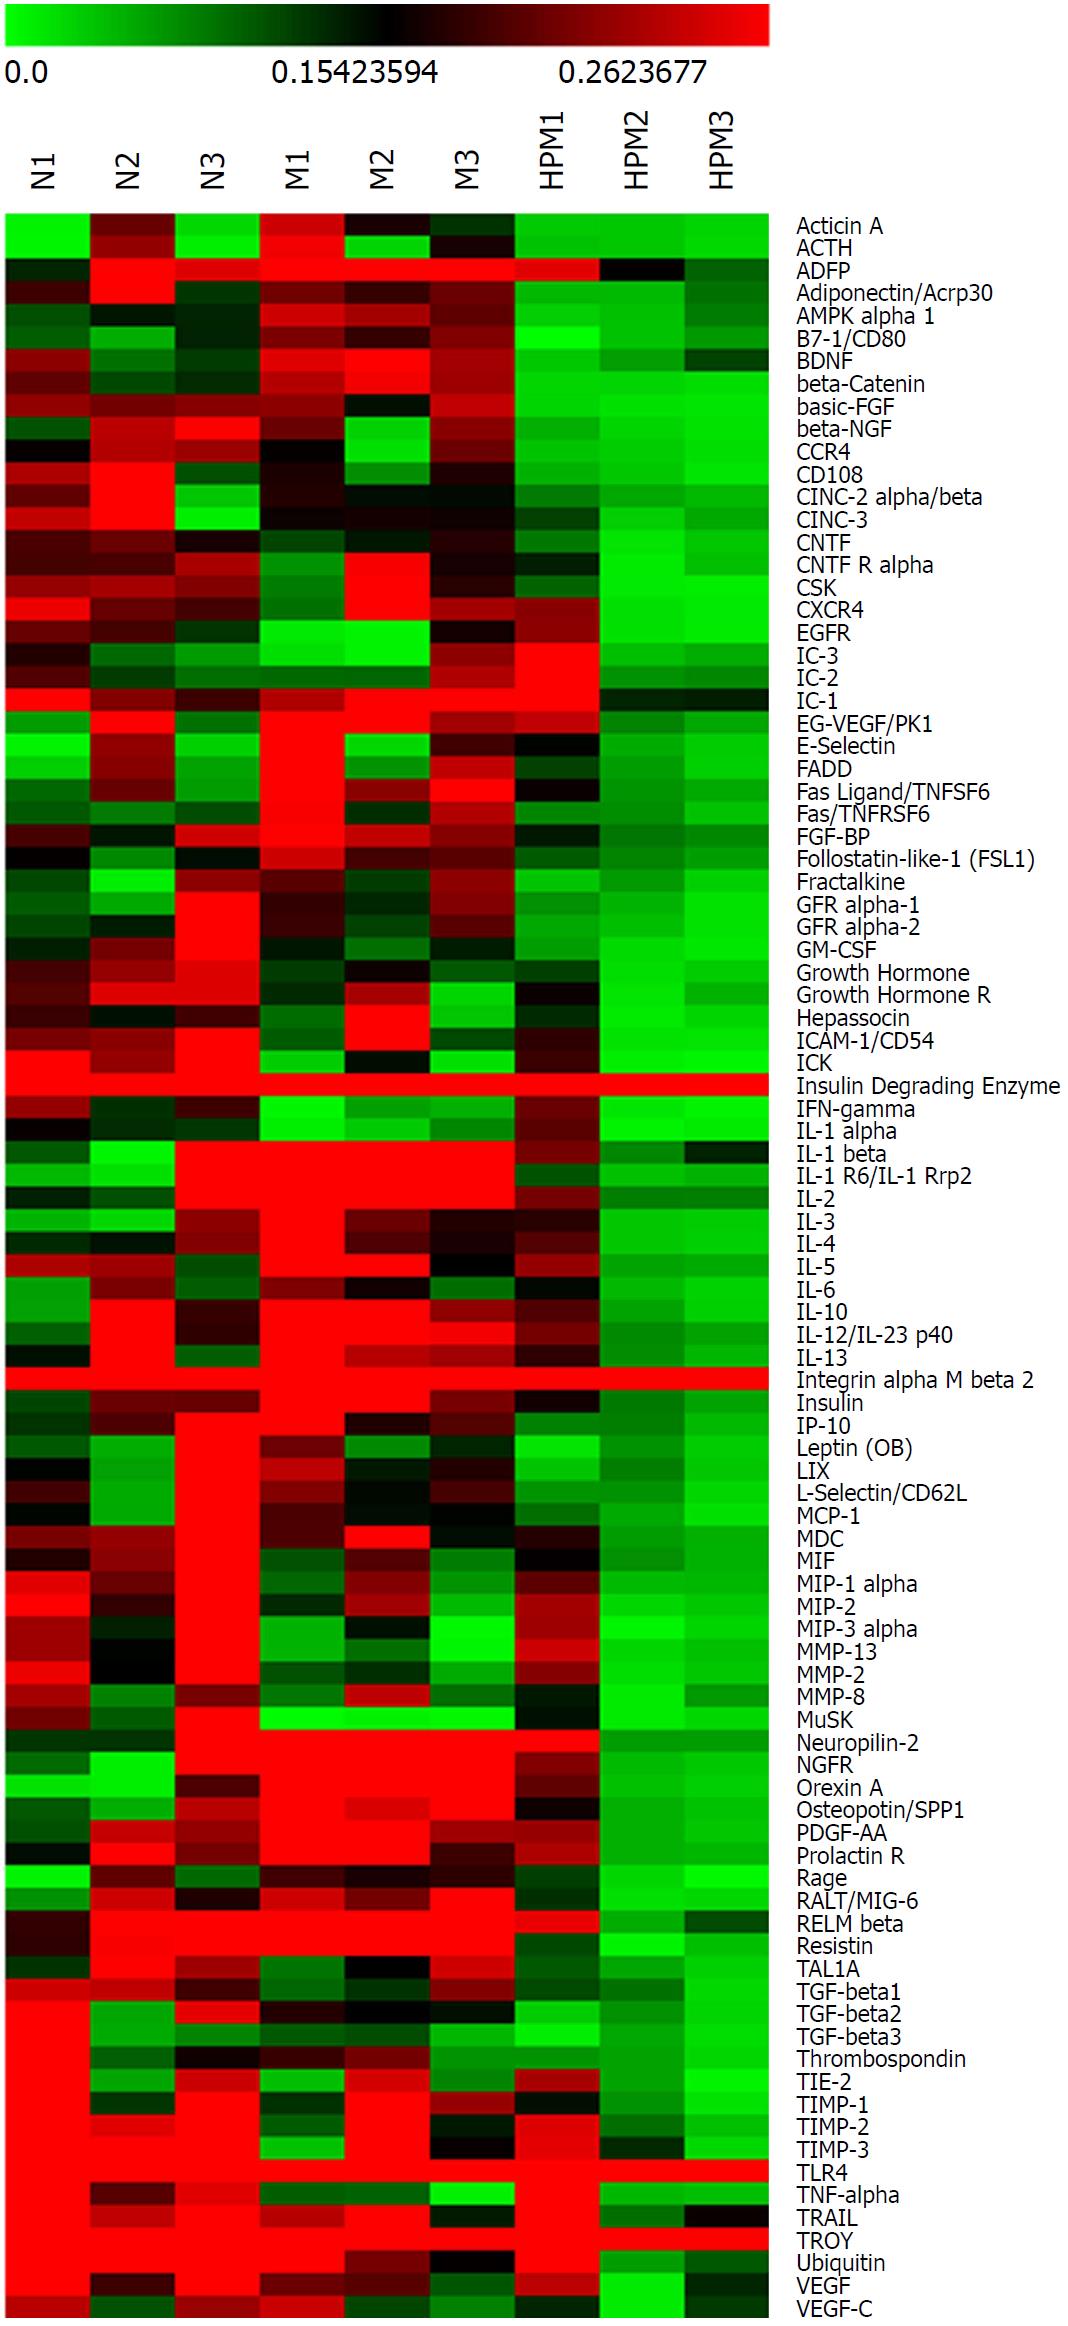
Figure 4 Clustering heatmap of colonic cytokines in each group.
Red stands for those higher than the average density (marked in dark); green for those lower than the average density. n = 3 rats per group. N: Normal group; M: Model group; HPM: Herb-partitioned moxibustion group.
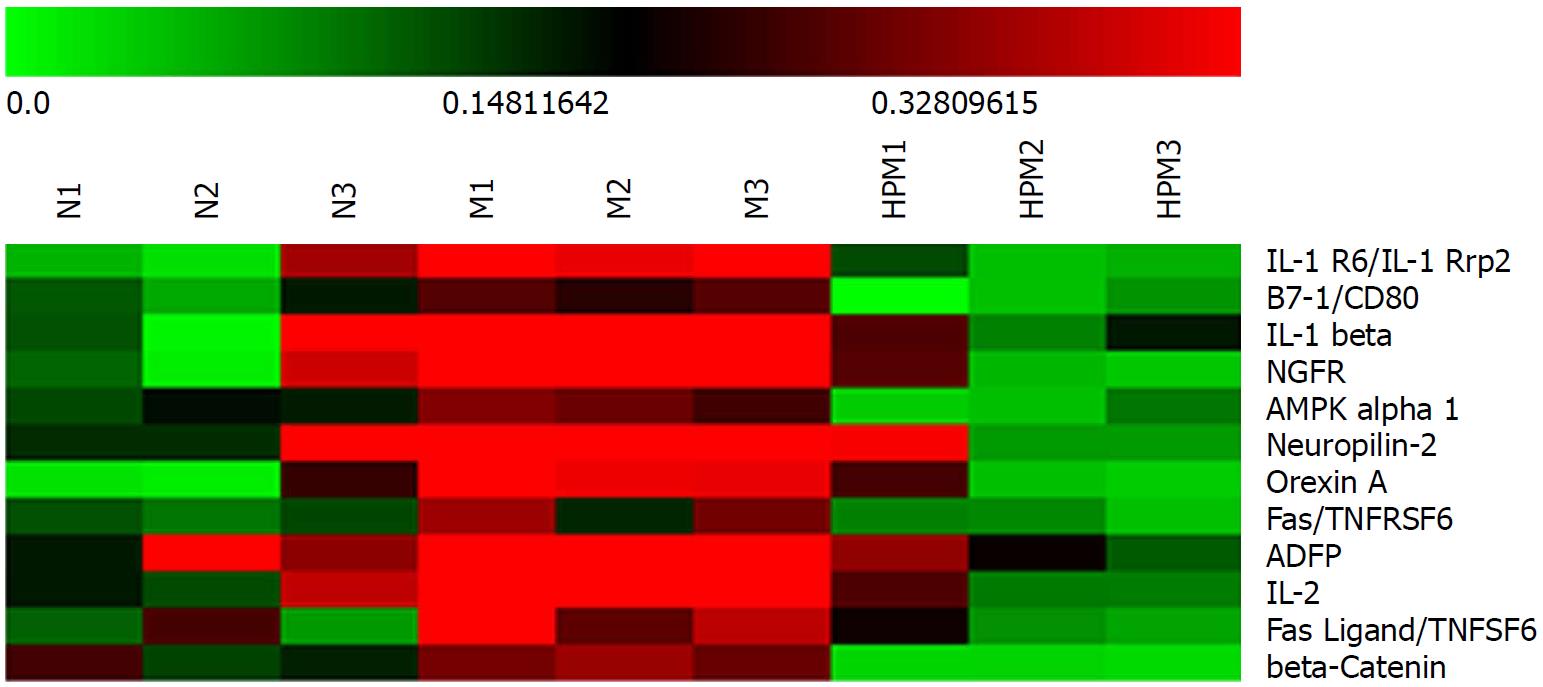
Figure 5 Clustering heatmap of the specific differential cytokines in each group.
Red stands for those higher than the average density (marked in dark); green for those lower than the average density. n = 3 rats per group. N: Normal group; M: Model group; HPM: Herb-partitioned moxibustion group.
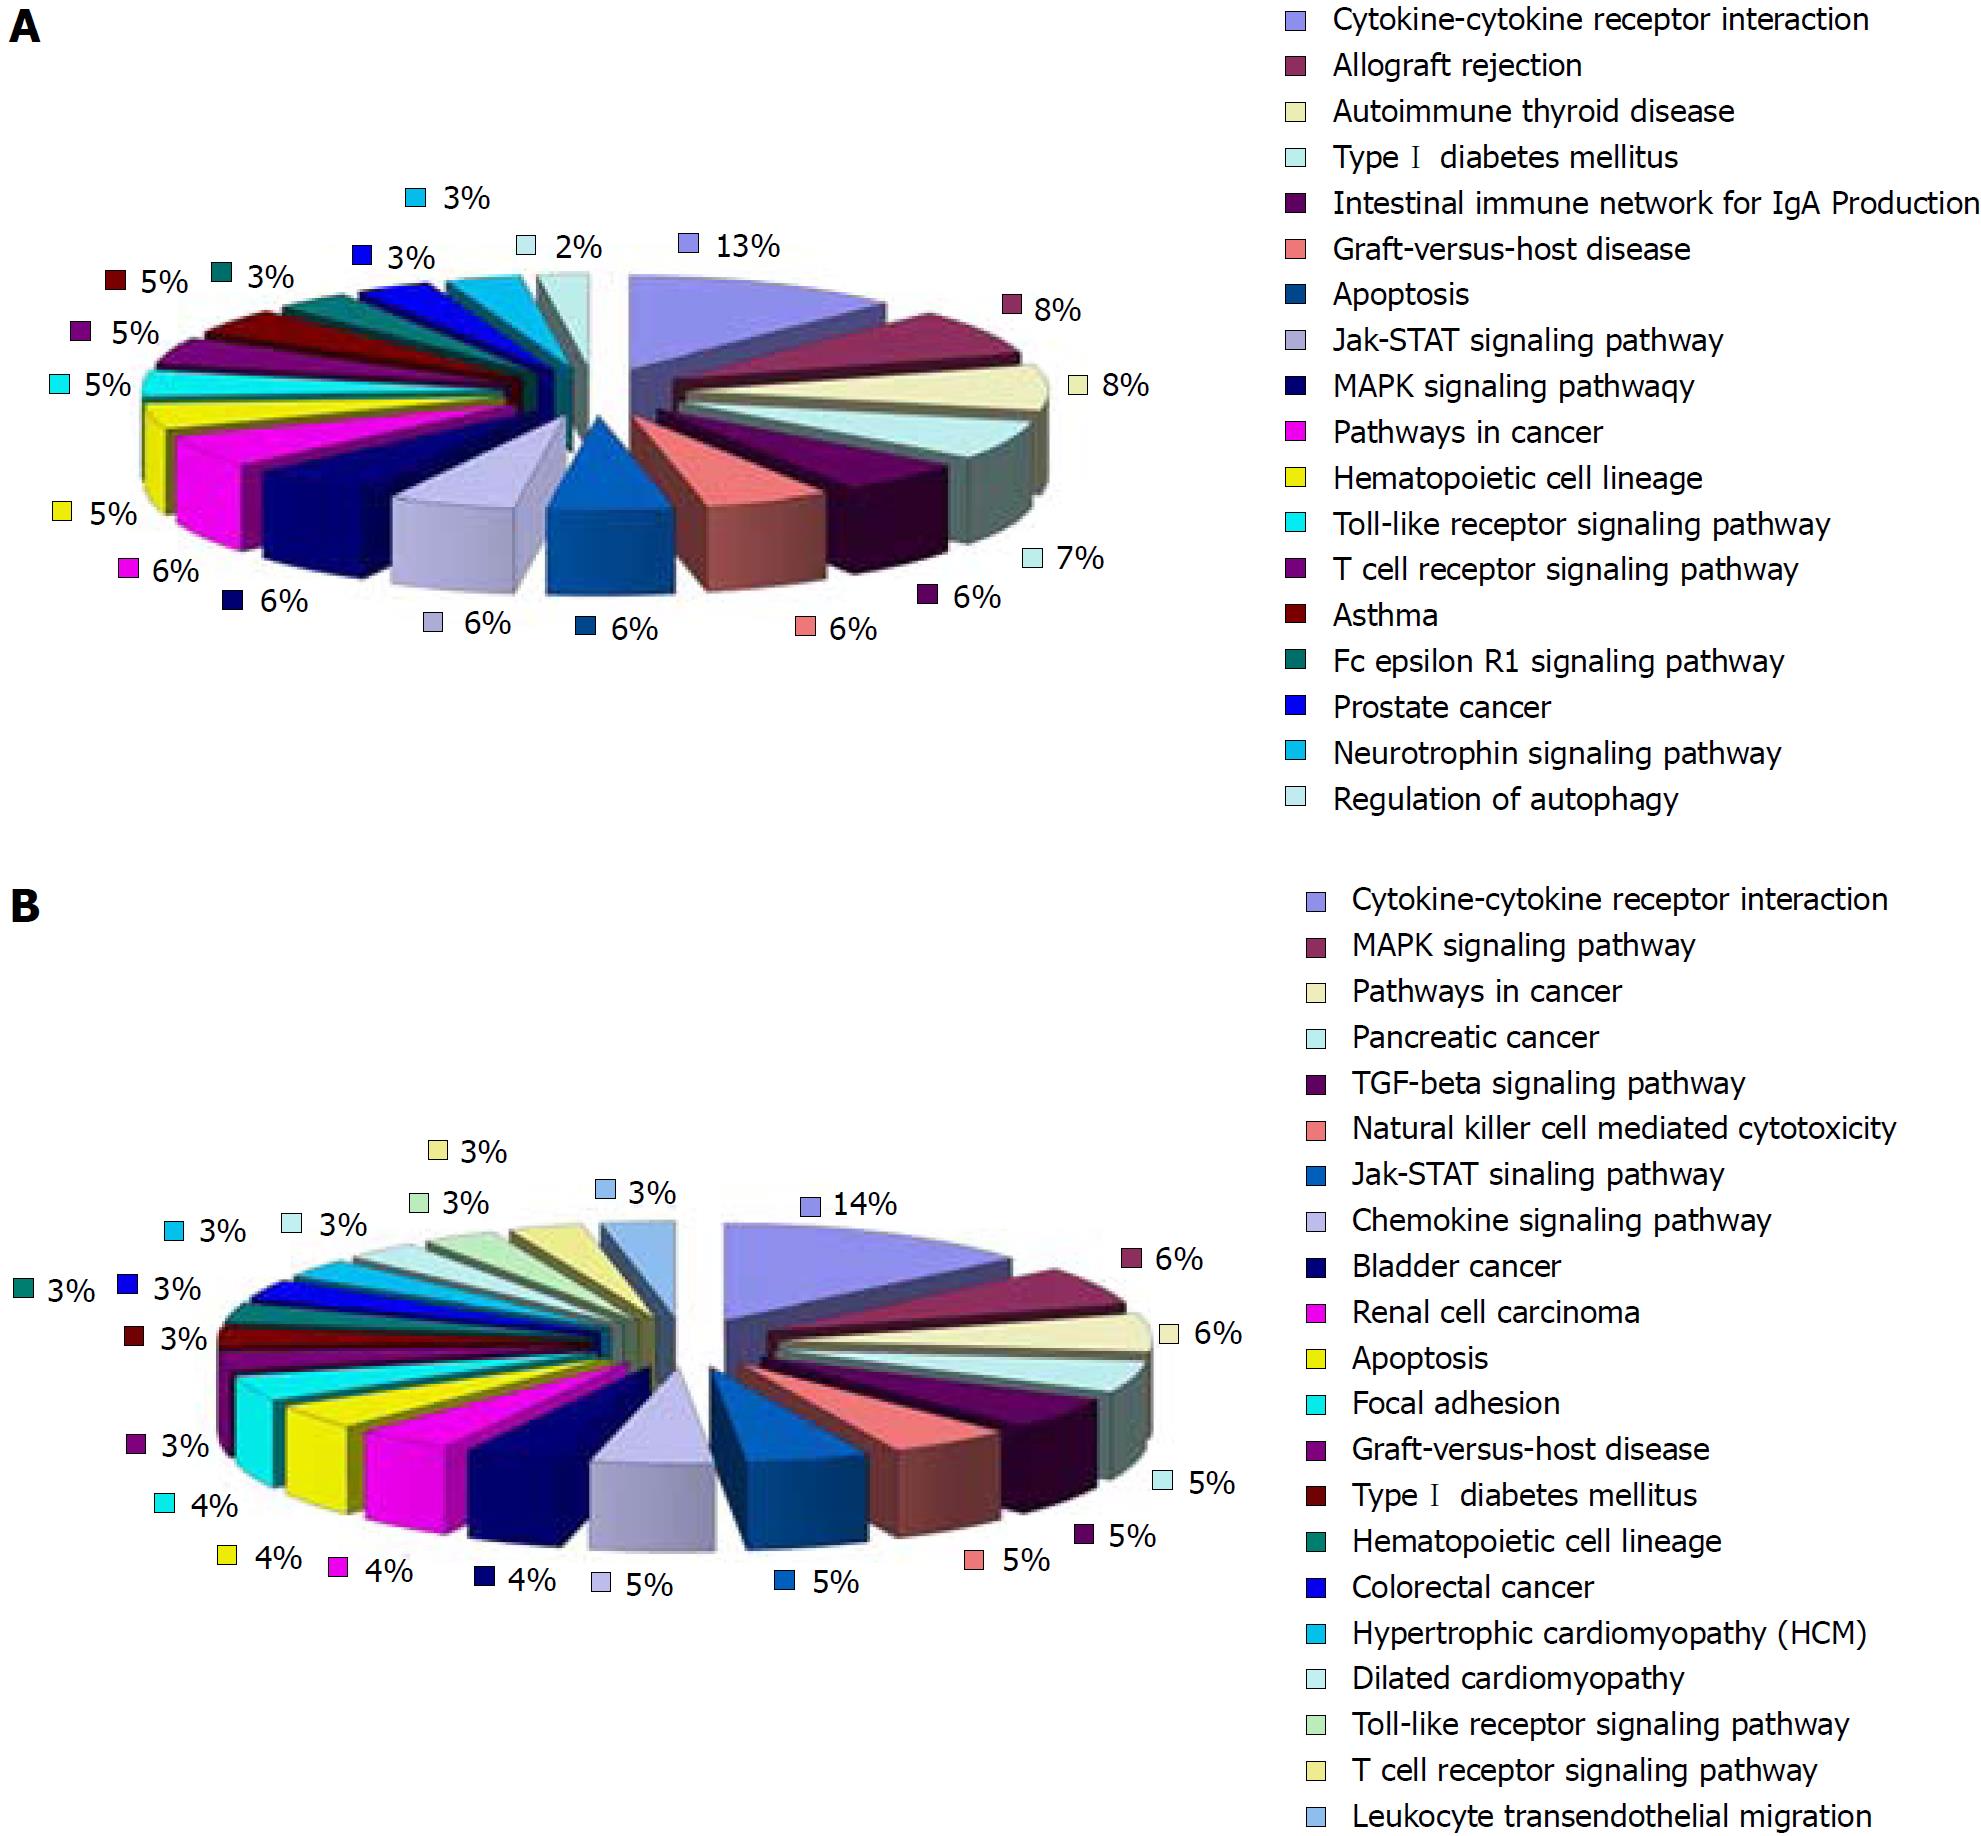
Figure 6 KEGG pathway analysis of the cytokines related to the development of ulcerative colitis.
A: Eleven of all the major signaling pathways of the up-regulated cytokines in the model group (compared with the normal group) are involved in the interaction between cytokines and their receptors (36.7%); B: Of the major signaling pathways of the down-regulated cytokines in the model group (compared with the normal group), 13 pathways regulate the interaction between cytokines and their receptors (39.4%) (Supplementary Tables 4 and 5).
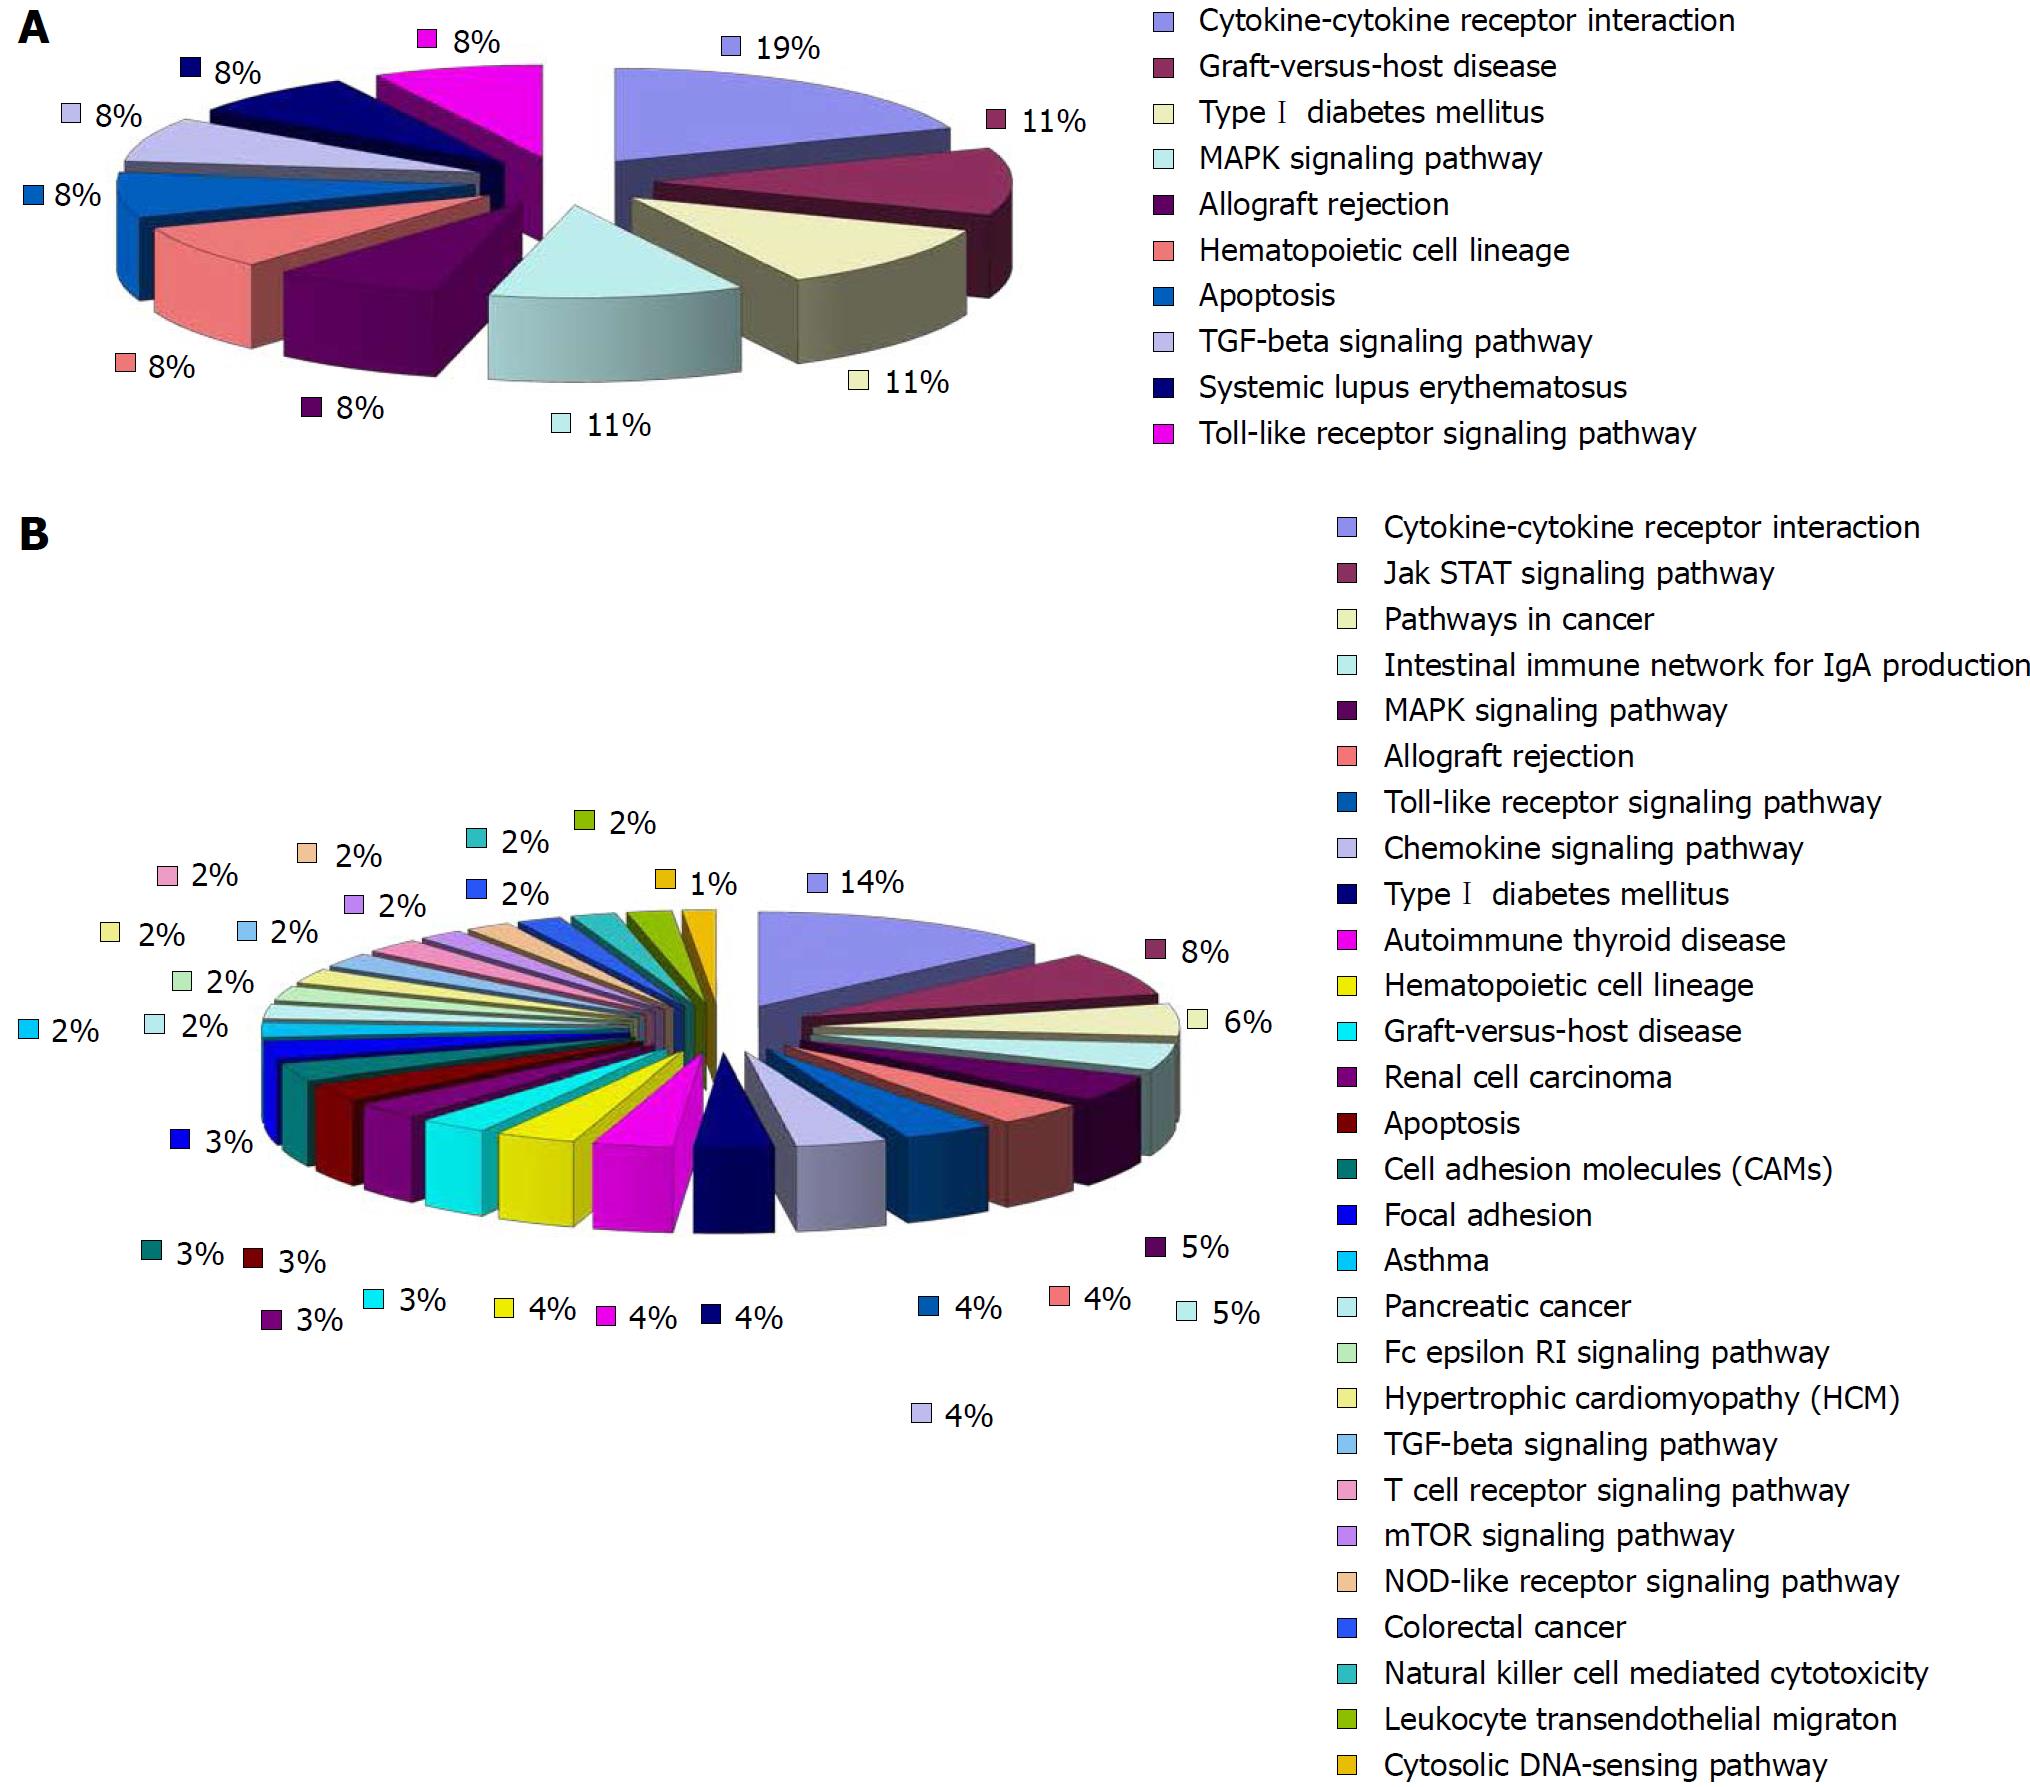
Figure 7 KEGG pathway analysis of the cytokines related to the action of herb-partitioned moxibustion.
A: Among the major signaling pathways related to the up-regulated cytokines in the herb-partitioned moxibustion group (compared with the model group), five pathways were involved in the interaction between cytokines and their receptors (55.6%); B: Of the major signaling pathways related to the down-regulated cytokines in the herb-partitioned moxibustion group (compared with the model group), 27 pathways were involved in the interaction between cytokines and their receptors (38%) (Supplementary Tables 6 and 7).
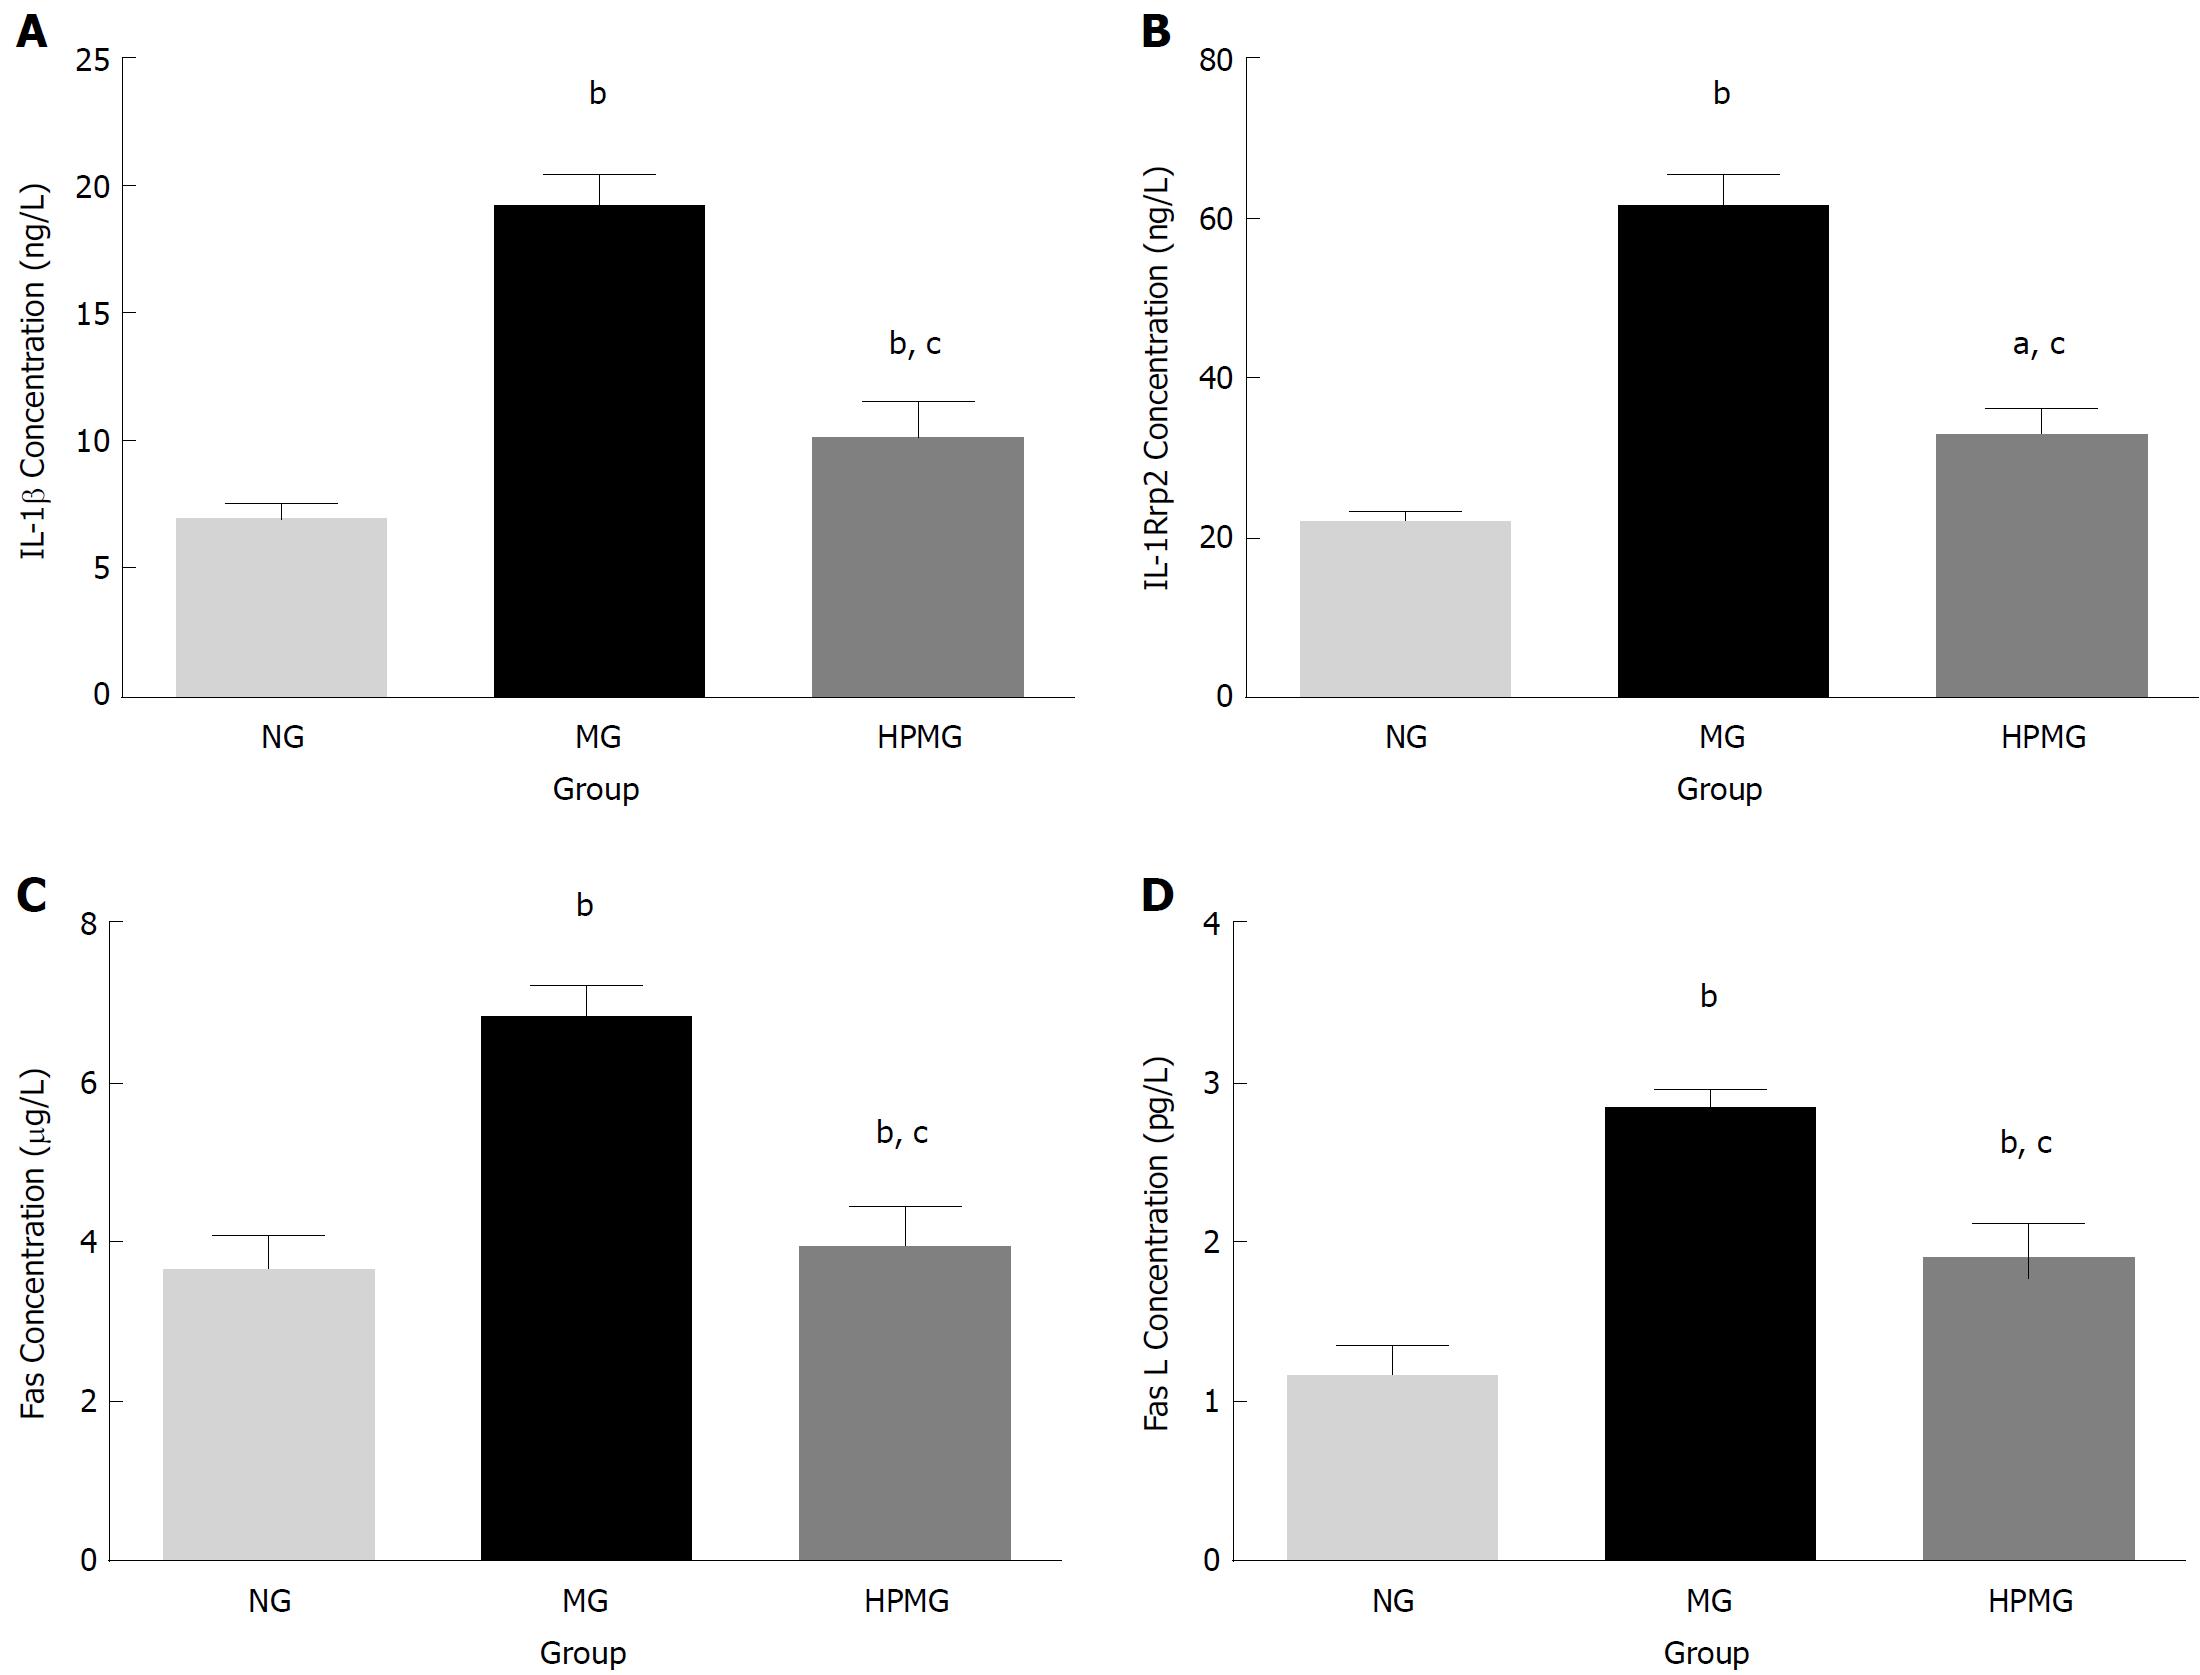
Figure 8 Validation of the specific differential cytokines.
A: Expression of IL-1β protein in colon; B: Expression of IL-1Rrp2/IL-1R6 protein in colon; C: Expression of Fas protein in colon; D: Expression of FasL protein in colon. Data are presented as the mean ± SD, n = 8 rats per group. bP < 0.01, aP < 0.05, (vs normal group); cP < 0.01 (vs model group). NG: Normal group; MG: Model group; HPMG: Herb-partitioned moxibustion group.
- Citation: Zhang D, Ren YB, Wei K, Hong J, Yang YT, Wu LJ, Zhang J, Shi Z, Wu HG, Ma XP. Herb-partitioned moxibustion alleviates colon injuries in ulcerative colitis rats. World J Gastroenterol 2018; 24(30): 3384-3397
- URL: https://www.wjgnet.com/1007-9327/full/v24/i30/3384.htm
- DOI: https://dx.doi.org/10.3748/wjg.v24.i30.3384


