Copyright
©The Author(s) 2018.
World J Gastroenterol. Aug 14, 2018; 24(30): 3384-3397
Published online Aug 14, 2018. doi: 10.3748/wjg.v24.i30.3384
Published online Aug 14, 2018. doi: 10.3748/wjg.v24.i30.3384
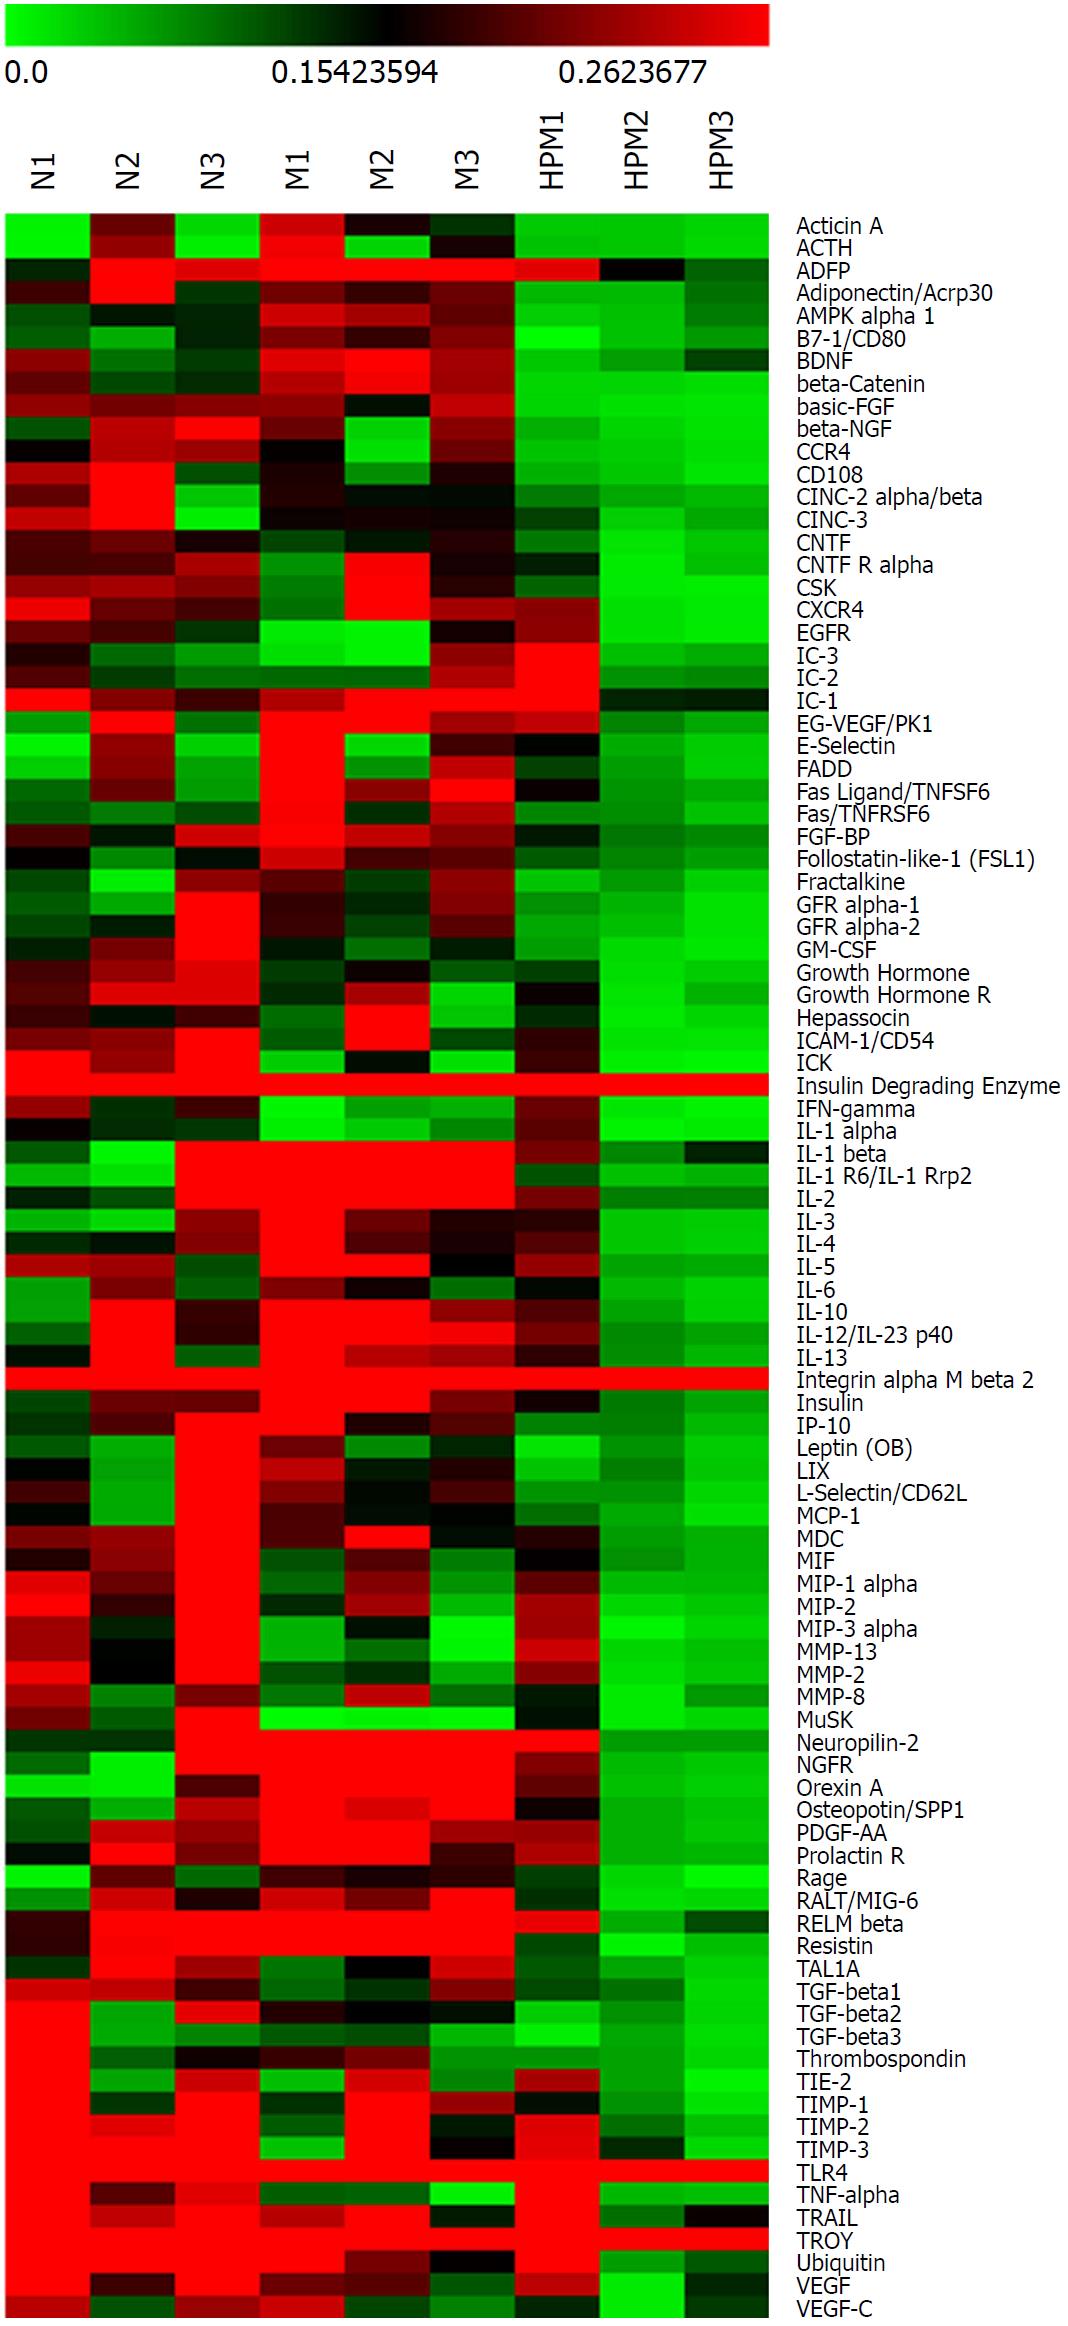
Figure 4 Clustering heatmap of colonic cytokines in each group.
Red stands for those higher than the average density (marked in dark); green for those lower than the average density. n = 3 rats per group. N: Normal group; M: Model group; HPM: Herb-partitioned moxibustion group.
- Citation: Zhang D, Ren YB, Wei K, Hong J, Yang YT, Wu LJ, Zhang J, Shi Z, Wu HG, Ma XP. Herb-partitioned moxibustion alleviates colon injuries in ulcerative colitis rats. World J Gastroenterol 2018; 24(30): 3384-3397
- URL: https://www.wjgnet.com/1007-9327/full/v24/i30/3384.htm
- DOI: https://dx.doi.org/10.3748/wjg.v24.i30.3384


