Copyright
©The Author(s) 2018.
World J Gastroenterol. May 28, 2018; 24(20): 2181-2190
Published online May 28, 2018. doi: 10.3748/wjg.v24.i20.2181
Published online May 28, 2018. doi: 10.3748/wjg.v24.i20.2181
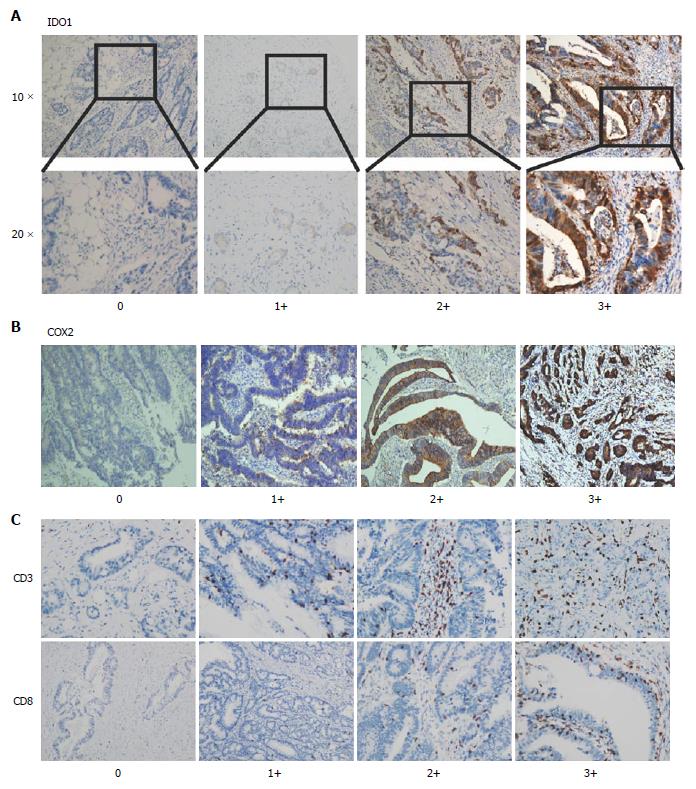
Figure 1 Indoleamine-2,3-dioxygenase 1, cyclooxygenase 2, CD3 and CD8 expression in colorectal cancer.
A: Examples of the tumoral staining intensity (0, 1+, 2+ and 3+) of IDO1 in immunohistochemistry analysis; B: Examples of the tumoral staining intensity (0, 1+, 2+ and 3+) of COX2 in immunohistochemistry analysis; C: Representative examples of tumors with intraepithelial CD3 and CD8 scores (1+, 2+, 3+ and 4+). CRC: Colorectal cancer; COX2: Cyclooxygenase 2; IDO1: Indoleamine-2,3-dioxygenase 1.
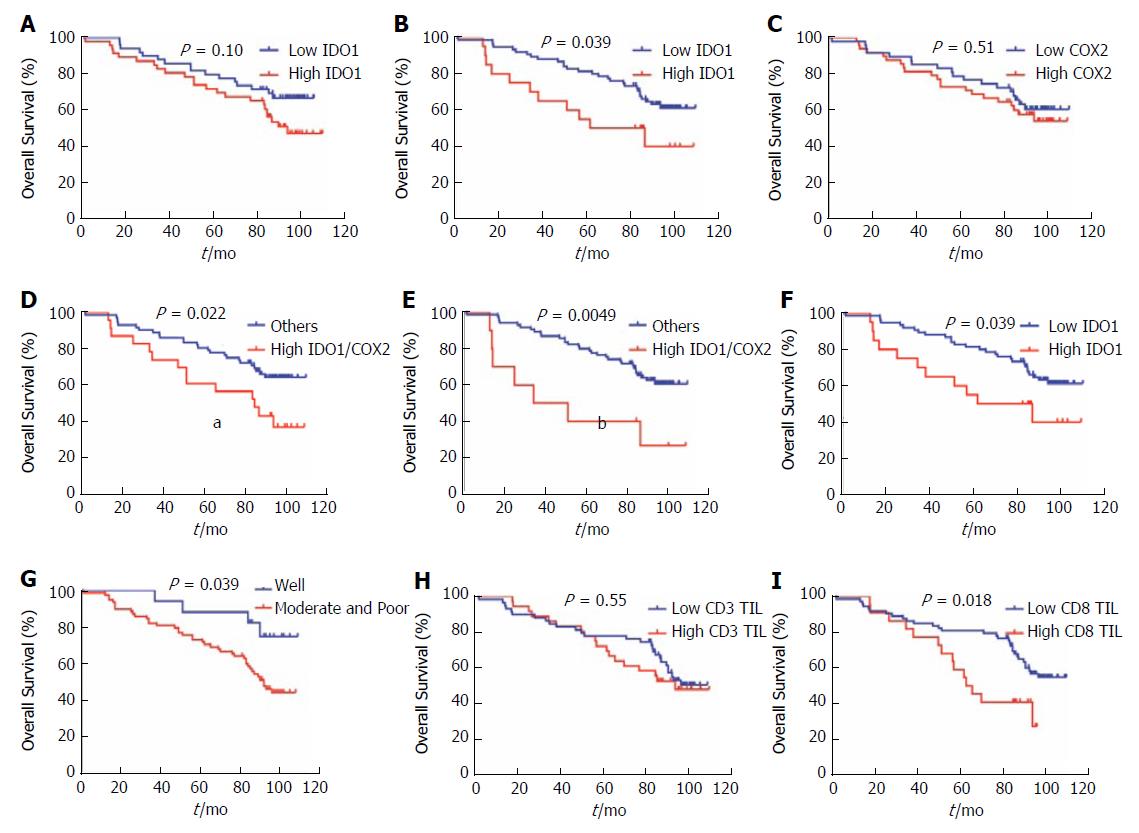
Figure 2 Correlation of Indoleamine-2,3-dioxygenase 1/cyclooxygenase 2 protein expression with a poor prognosis in colorectal cancer.
A-C: Correlation between nuclear or cytoplasmic IDO1 and COX2 expression with CRC patient OS. Survival curves were generated using the Kaplan-Meier method, and differences between survival curves were estimated by the log-rank test. Nuclear IDO1 showed a statistically significant correlation with OS; D-E: Correlation between the different expression levels of nuclear and cytoplasmic IDO1/COX2 and OS in CRC patients. Group I: IDO1LowCOX2Low; Group II: IDO1HighCOX2Low; Group III: IDO1LowCOX2High; Group IV: IDO1HighCOX2High. The association of the four groups (IV vs I/II/III) with OS was significant (P < 0.05); F: Combined analysis of nuclear and cytoplasmic IDO1 and its correlation with OS in CRC. The association of nuclear and cytoplasmic IDO1 expression with OS was significant (P < 0.05); G: Correlation between tumor differentiation and OS in CRC. The association of tumor differentiation (moderate and poor vs well) with OS was significant (P < 0.05); H-I: Correlation between CD3 TILs and CD8 TILs and OS in CRC; H: CD3 TILs (P > 0.05); I: CD8 TILs (P < 0.05). CRC: Colorectal cancer; COX2: Cyclooxygenase 2; IDO1: Indoleamine-2,3-dioxygenase 1; OS: Overall survival; TILs: Tumor-infiltrating lymphocytes.
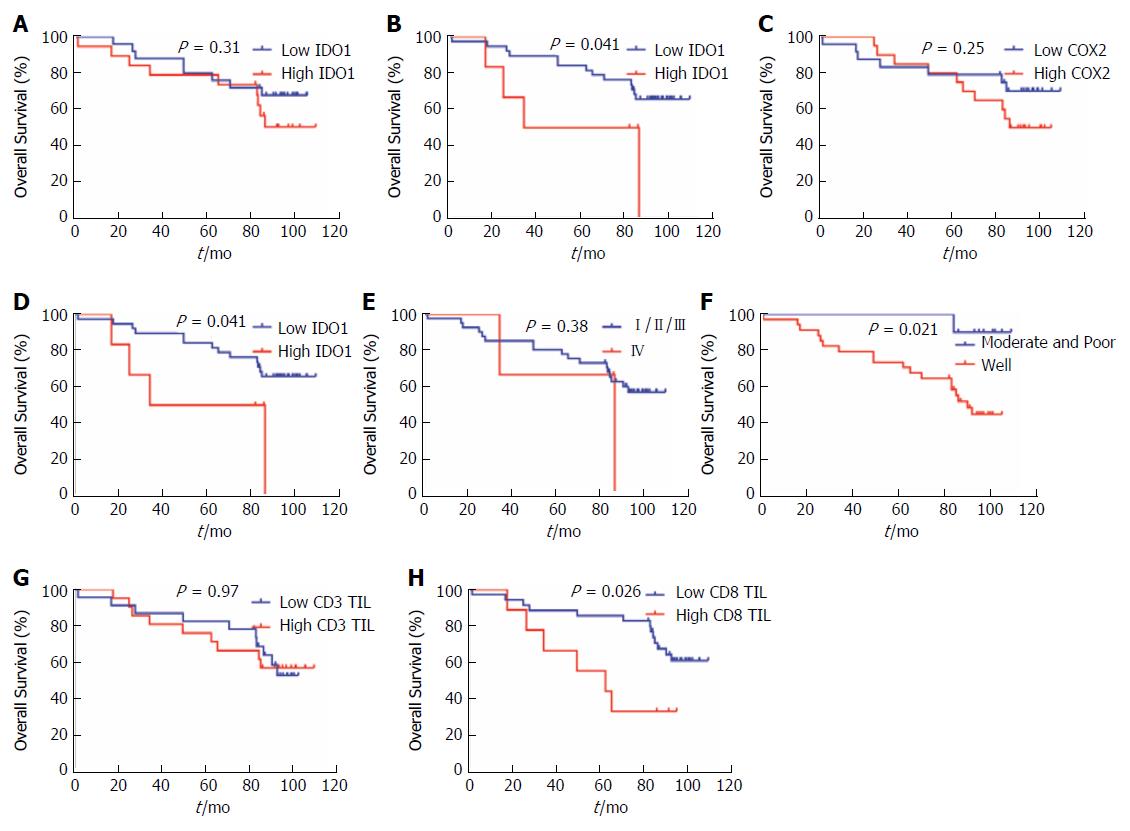
Figure 3 Correlation of indoleamine-2,3-dioxygenase 1/cyclooxygenase 2 protein expression with a poor prognosis in the colorectal cancer celecoxib subgroup.
A-D: Correlation between nuclear or cytoplasmic IDO1 and COX2 expression with OS in the CRC celecoxib subgroup. Survival curves were generated using the Kaplan-Meier method, and differences between survival curves were estimated by the log-rank test. Nuclear IDO1 and nuclear and cytoplasmic IDO1 showed a statistically significant correlation with OS; E: Correlation between different expression levels of nuclear and cytoplasmic IDO1/COX2 with the OS of the CRC celecoxib subgroup. Group I: IDO1LowCOX2Low; Group II: IDO1HighCOX2Low; Group III: IDO1LowCOX2High; Group IV: IDO1HighCOX2High. The association of four groups (IV vs I/II/III) with OS is not significant (P > 0.05); F: Correlation between tumor differentiation and OS in CRC. The association of tumor differentiation (moderate and poor vs well) with OS is significant (P < 0.05); G-H: Correlation between CD3 TILs and CD8 TILs with CRC OS; G: CD3 TILs (P > 0.05); H: CD8 TILs (P < 0.05). CRC: Colorectal cancer; COX2: Cyclooxygenase 2; IDO1: Indoleamine-2,3-dioxygenase 1; OS: Overall survival; TILs: Tumor-infiltrating lymphocytes.
- Citation: Ma WJ, Wang X, Yan WT, Zhou ZG, Pan ZZ, Chen G, Zhang RX. Indoleamine-2,3-dioxygenase 1/cyclooxygenase 2 expression prediction for adverse prognosis in colorectal cancer. World J Gastroenterol 2018; 24(20): 2181-2190
- URL: https://www.wjgnet.com/1007-9327/full/v24/i20/2181.htm
- DOI: https://dx.doi.org/10.3748/wjg.v24.i20.2181


