Copyright
©The Author(s) 2018.
World J Gastroenterol. Jan 14, 2018; 24(2): 237-247
Published online Jan 14, 2018. doi: 10.3748/wjg.v24.i2.237
Published online Jan 14, 2018. doi: 10.3748/wjg.v24.i2.237
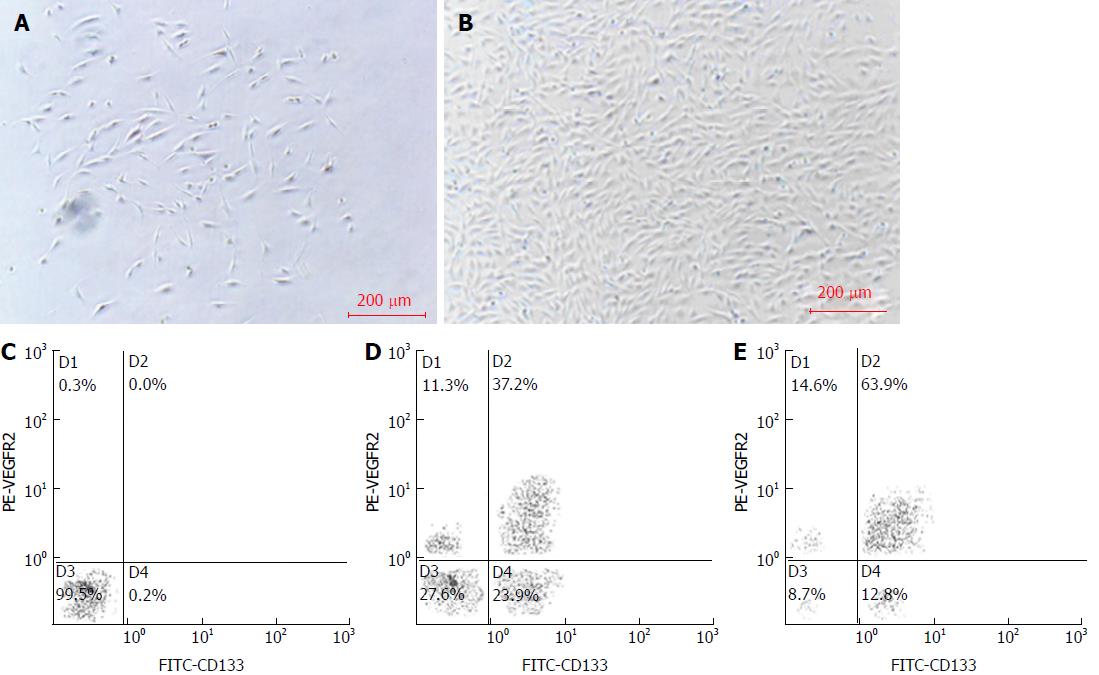
Figure 1 Morphology and phenotypes of BM-EPCs of rats with liver fibrosis, as shown by flow cytometry.
A: Adherent cells cultured with induction for 4 d; B: Cell colonies cultured with induction for 10 d; C: Negative control without fluorescence-labeled BM-EPCs; D: Cells cultured without induction for 10 d; E: BM-EPCs cultured with induction for 10 d. Bars: 200 μm.
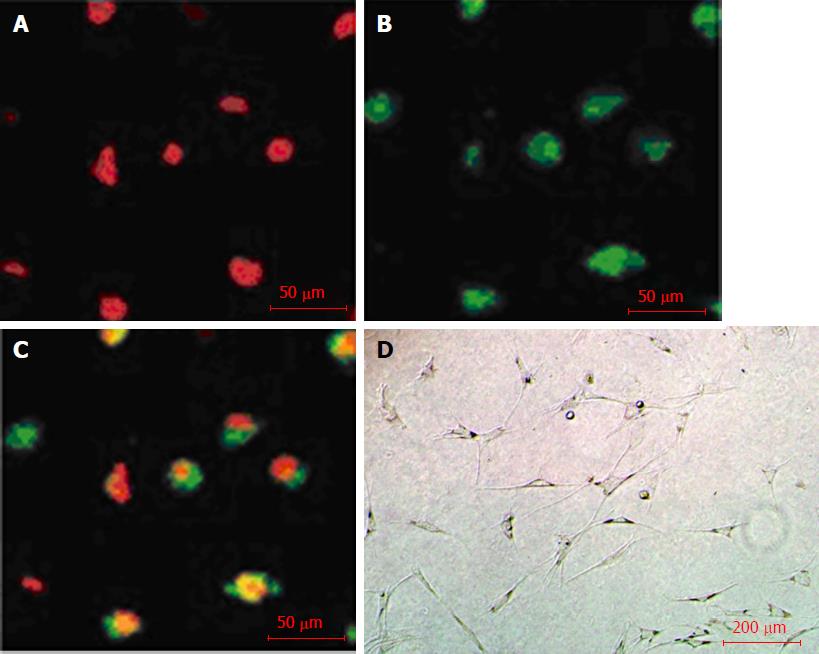
Figure 2 Phagocytosis and vasculogenesis functions of BM-EPCs of liver fibrosis rats.
A: Bone marrow-derived endothelial progenitor cells uptake of Dil-ac-LDL (red); B: BM-EPCs binding with FITC-UEA-1 (green); C: Merge of A and B (yellow); D: Vascular network-like structures of BM-EPCs on Matrigel. Bars: 50 μm (A-C); 200 μm (D); BM-EPCs: Bone marrow-derived endothelial progenitor cells.
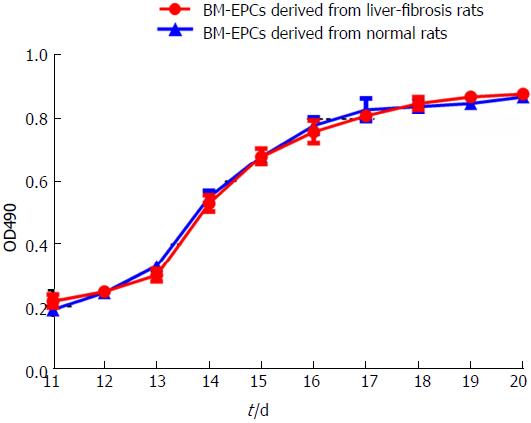
Figure 3 Growth curves of BM-EPCs.
Between days 11 and 20 of culture induction, the growth curve (OD490 values) of BM-EPCs of liver fibrosis rats (red) was similar to that of BM-EPCs of normal rats (blue); BM-EPCs: Bone marrow-derived endothelial progenitor cells.
Figure 4 Location of BM-EPCs of liver fibrosis rats in the fibrotic liver.
A: Autofluorescence of the fibrotic liver tissue; B: BM-EPCs labeled with PKH26 (red) implanted in the fibrotic liver tissue (yellow arrow); C: BM-EPCs (red) located in/near hepatic sinusoids (yellow arrow) on the background of DAPI staining (blue). Bars: 200 μm; BM-EPCs: Bone marrow-derived endothelial progenitor cells.
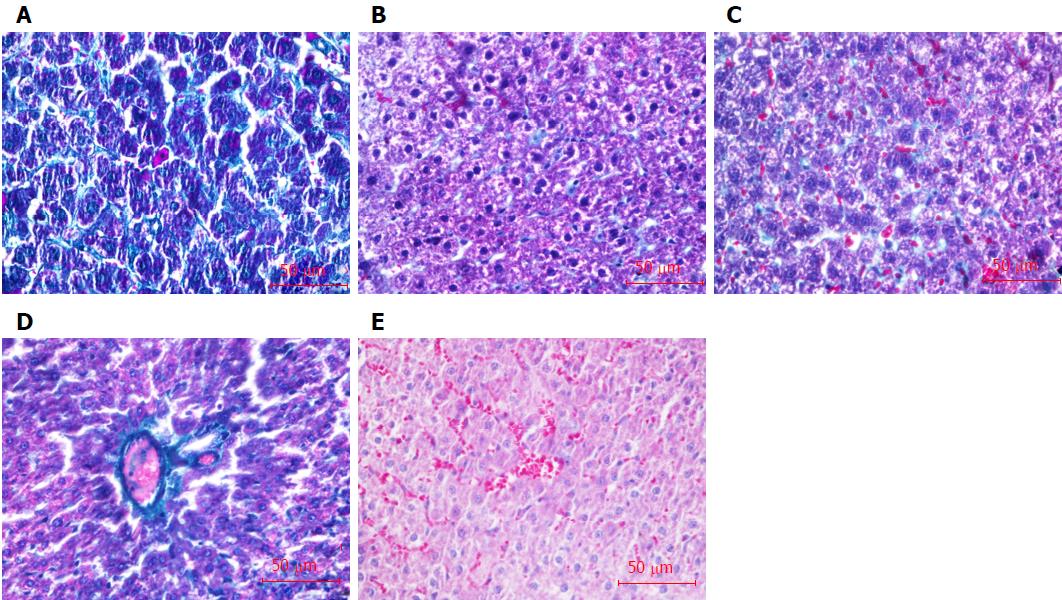
Figure 5 Collagen formation in the liver shown by masson staining (green).
A: Normal group; B: Model group; C: Bone marrow-derived hepatocyte stem cells group; D: Bone marrow-derived endothelial progenitor cells group (BM-EPCs); E: BM-EPCs/BDHSCs group. Bars: 50 μm.
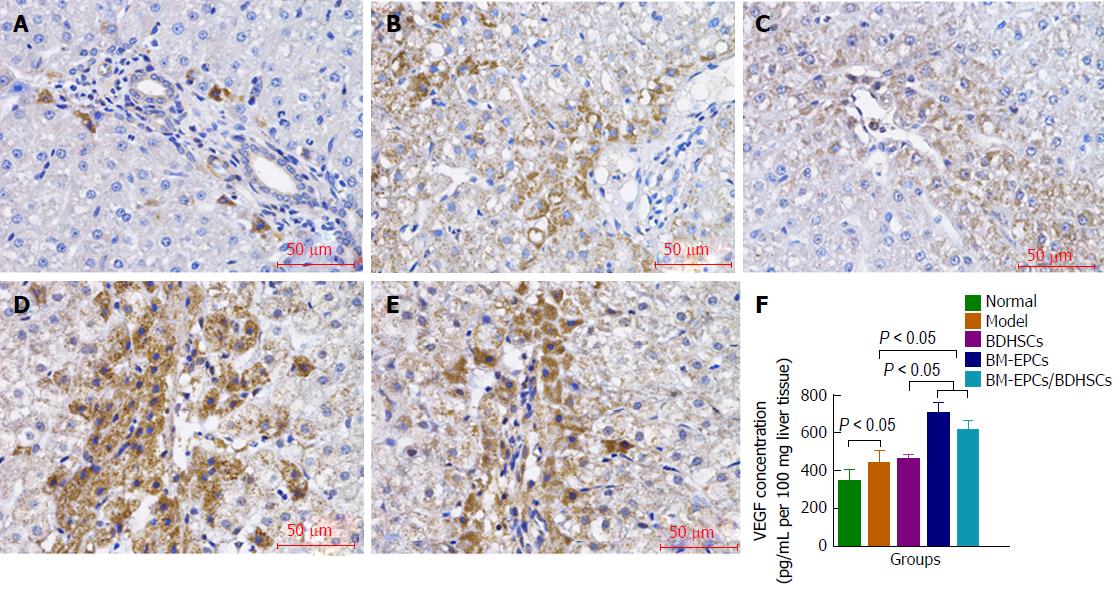
Figure 6 Vascular endothelial growth factor levels in the liver.
A-E: VEGF protein expressions shown by immunohistochemistry (brown). A: Normal group; B: Model group; C: BDHSCs group; D: BM-EPCs group; E: BM-EPCs/BDHSCs group; F: VEGF concentration detected by ELISA. n = 8; VEGF: Vascular endothelial growth factor; BM-EPCs: Bone marrow-derived endothelial progenitor cells; BDHSCs: Bone marrow-derived hepatocyte stem cells.
Figure 7 Proliferating cell nuclear antigen protein expression shown by immunohistochemistry (brown).
A: Normal group; B: Model group; C: BDHSCs group; D: BM-EPCs group; E: BM-EPCs/BDHSCs group; F Quantitative analysis of PCNA expression by IOD. (n = 8); BM-EPCs: Bone marrow-derived endothelial progenitor cells; BDHSCs: Bone marrow-derived hepatocyte stem cells.
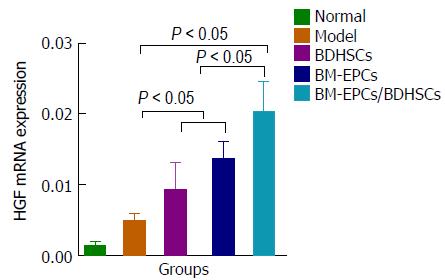
Figure 8 Hepatocyte growth factor mRNA expression detected by real-time quantitative polymerase chain reaction.
n = 8; BM-EPCs: Bone marrow-derived endothelial progenitor cells; BDHSCs: Bone marrow-derived hepatocyte stem cells; HGF: Hepatocyte growth factor.
- Citation: Lan L, Liu R, Qin LY, Cheng P, Liu BW, Zhang BY, Ding SZ, Li XL. Transplantation of bone marrow-derived endothelial progenitor cells and hepatocyte stem cells from liver fibrosis rats ameliorates liver fibrosis. World J Gastroenterol 2018; 24(2): 237-247
- URL: https://www.wjgnet.com/1007-9327/full/v24/i2/237.htm
- DOI: https://dx.doi.org/10.3748/wjg.v24.i2.237


