Copyright
©The Author(s) 2018.
World J Gastroenterol. Jan 14, 2018; 24(2): 226-236
Published online Jan 14, 2018. doi: 10.3748/wjg.v24.i2.226
Published online Jan 14, 2018. doi: 10.3748/wjg.v24.i2.226
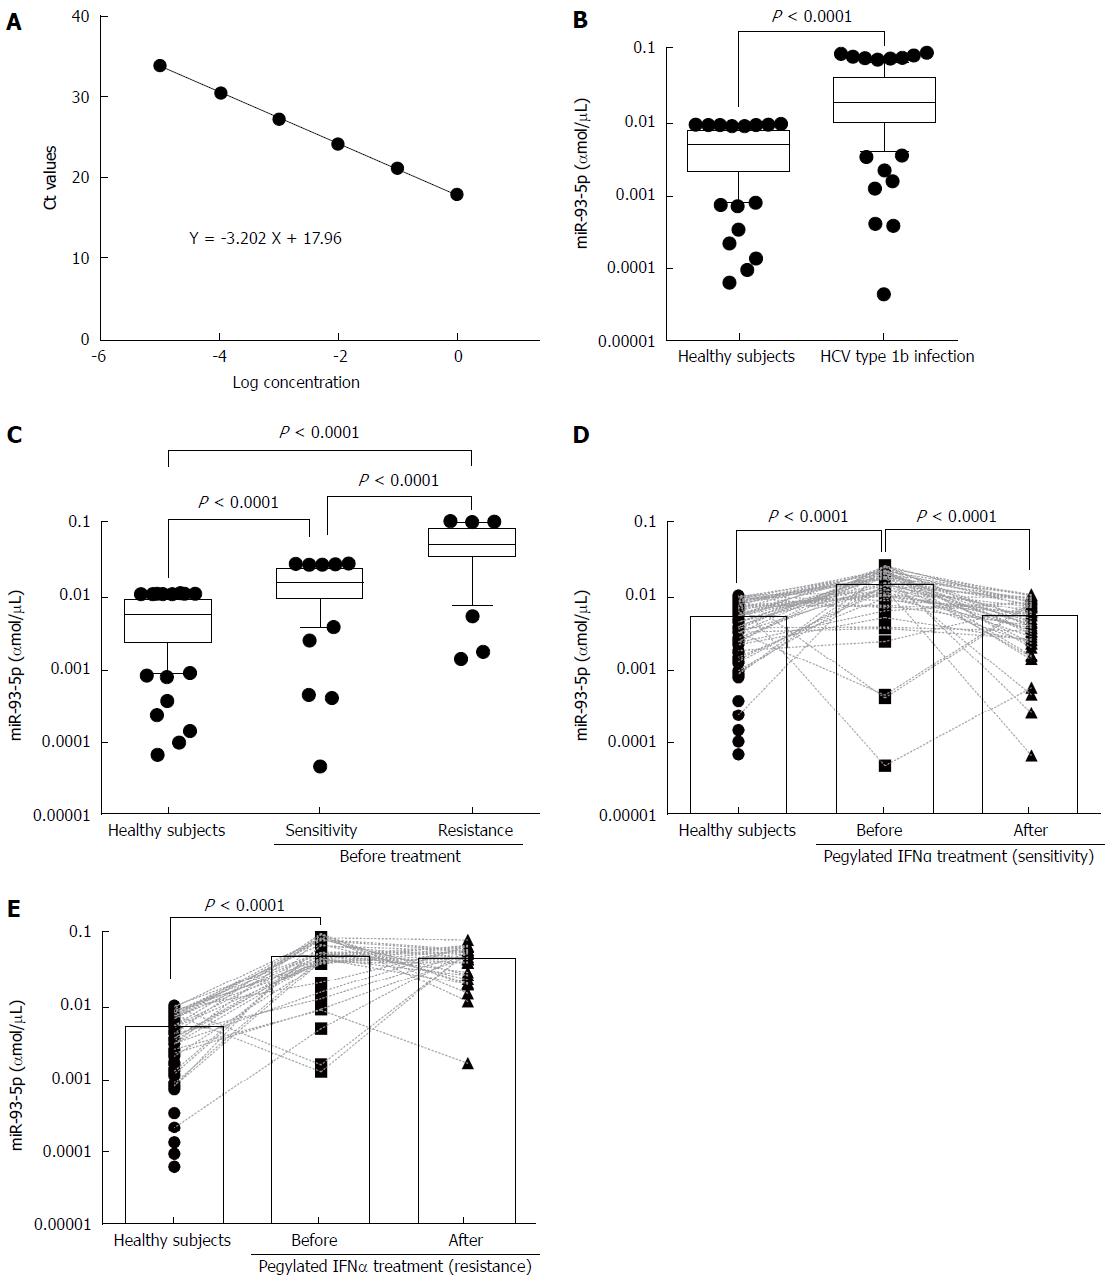
Figure 1 Serum miR-93-5p expression is increased in hepatitis C virus-1b-infected patients.
A: The linearity of miR-93-5p quantification; B: Box shows serum miR-93-5p concentrations in 84 patients with HCV-1b infection, compared with 84 healthy subjects; C: Box shows serum miR-93-5p concentrations in 50 HCV-1b-infected patients with pegylated IFNα sensitivity and 34 HCV-1b-infected patients with pegylated IFNα resistance, compared with 84 healthy subjects; D: Scatter shows serum miR-93-5p concentrations in 84 healthy subjects and 50 HCV 1b-infected patients with pegylated IFNα sensitivity before or after treatment; E: Scatter shows serum miR-93-5p concentrations in 84 healthy subjects and 34 HCV 1b-infected patients with pegylated IFNα resistance before or after treatment. HCV: Hepatitis C virus; IFNα: Interferon-α.
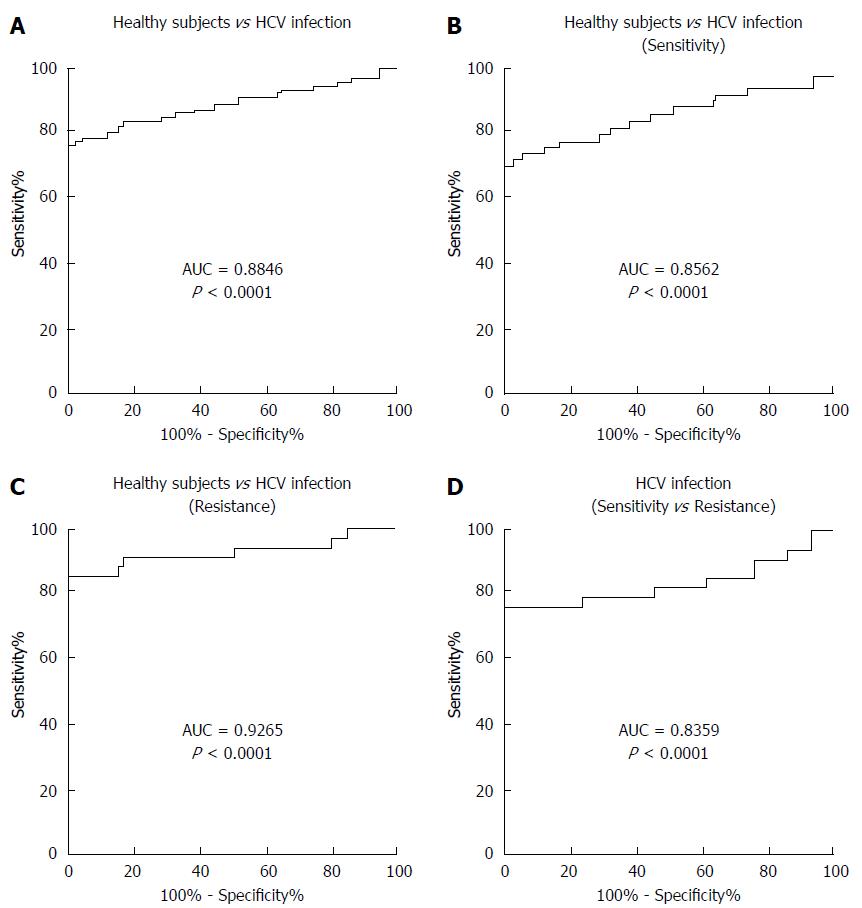
Figure 2 Serum miR-93-5p in patients with hepatitis C virus-1b infection is involved in pegylated interferon-α resistance.
A: Receiver operating characteristics (ROC) curve shows an AUC value of 0.8846 for serum miR-93-5p concentration in distinguishing HCV-1b-infected patients from healthy subjects; B and C: ROC curve shows AUC values of 0.8562 and 0.9265 in distinguishing HCV-1b-infected patients with pegylated IFNα sensitivity or resistance from healthy subjects, respectively; D: ROC curve shows an AUC value of 0.8359 in distinguishing HCV-1b-infected patients with pegylated IFNα resistance from those with pegylated IFNα sensitivity. HCV: Hepatitis C virus; IFNα: Interferon-α.
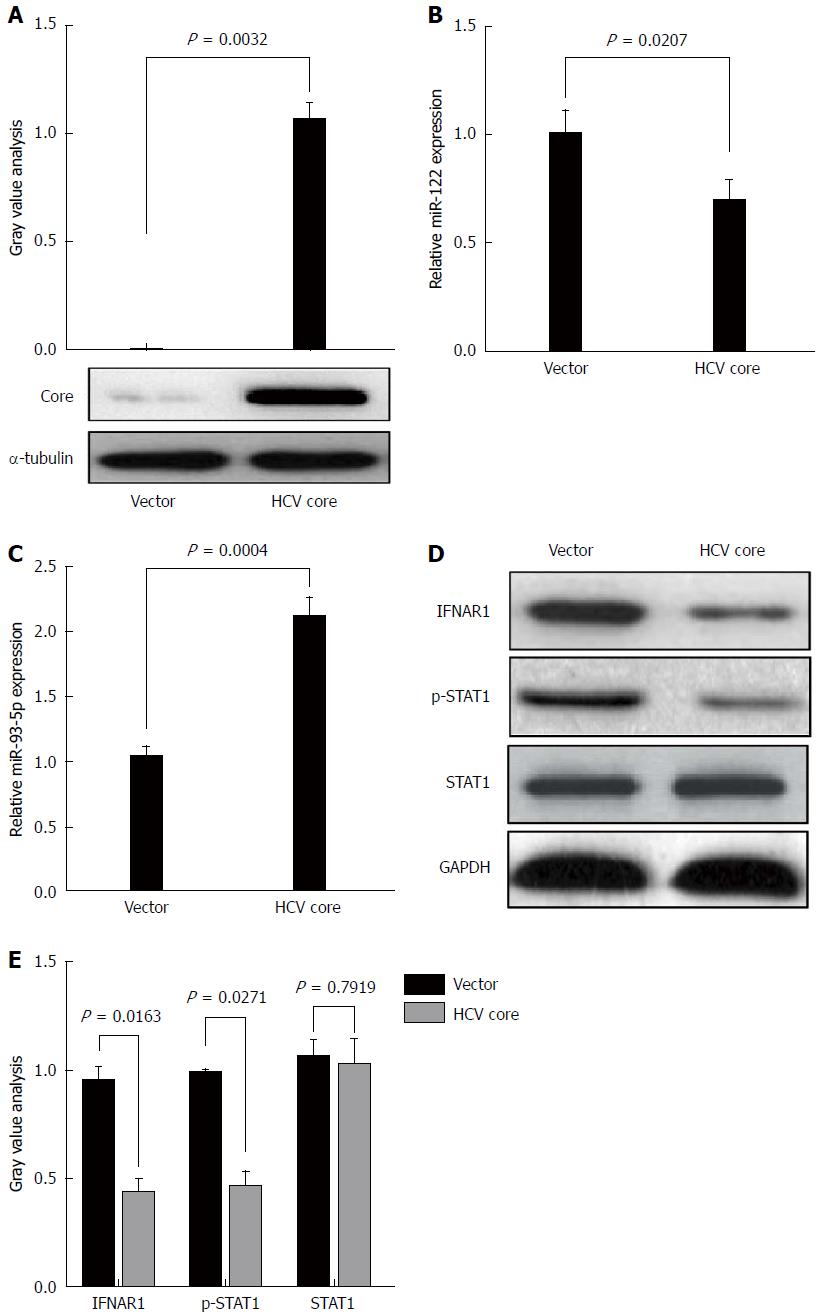
Figure 3 Hepatitis C virus-1b core protein increases miR-93-5p expression and inactivates the interferon signaling pathway.
A: HCV core protein is enforcedly expressed in Huh7 cells using pcDNA3.1 (+) vector. Western blot shows HCV core protein expression. This experiment was repeated twice; B: Bar shows miR-122 expression in Huh7 cells transfected with pcDNA 3.1 (+) empty vector or HCV core-pcDNA3.1 (+) vector. U6 was used as an internal reference. This experiment was repeated three times. C: Bar shows miR-93-5p expression in Huh7 cells transfected with pcDNA 3.1 (+) empty vector or HCV core-pcDNA3.1 (+) vector. U6 was used as an internal reference. This experiment was repeated three times. D and E: Western blot shows the protein expression of IFNAR1 and STAT1, as well as the phosphorylation level of STAT1 in Huh7 cells which were transfected with pcDNA 3.1 (+) empty vector or HCV core-pcDNA3.1 (+) vector. This experiment was repeated twice. HCV: Hepatitis C virus; IFNAR1: Interferon receptor 1.
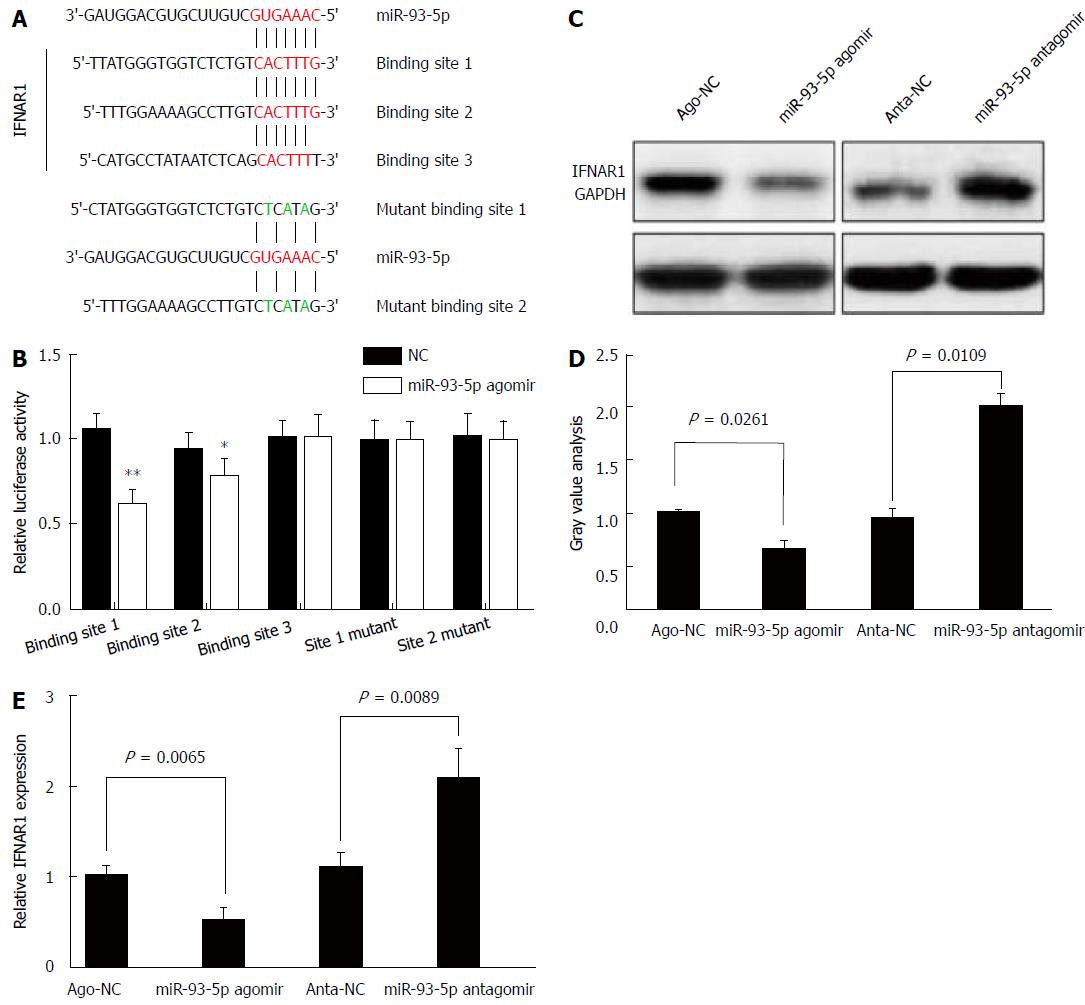
Figure 4 FNAR1 is a direct target of miR-93-5p .
A: The binding sites for miR-93-5p in the IFNAR1 3’-UTR, and the design of mutant binding sites in the IFNAR1 3’-UTR for miR-93-5p; B: Luciferase assay shows that miR-93-5p agomir inhibits the relative luciferase activity in the binding site 1 or 2-expressing HEK293T cells, but not in the binding site 3- or mutant binding sites-expressing HEK293T cells. This experiment was repeated six times; C and D: Western blot shows the protein expression of IFNAR1 in Huh7 cells transfected with ago-NC (200 nmol/L), miR-93-5p agomir (200 nmol/L), anta-NC (200 nmol/L), and miR-93-5p antagomir (200 nmol/L). This experiment was repeated twice; E: qRT-PCR shows the mRNA expression of IFNAR1 in Huh7 cells transfected with ago-NC (200 nmol/L), miR-93-5p agomir (200 nmol/L), anta-NC (200 nmol/L), and miR-93-5p antagomir (200 nmol/L). β-actin was used as an internal reference. This experiment was repeated three times. IFNAR1: Interferon receptor 1.
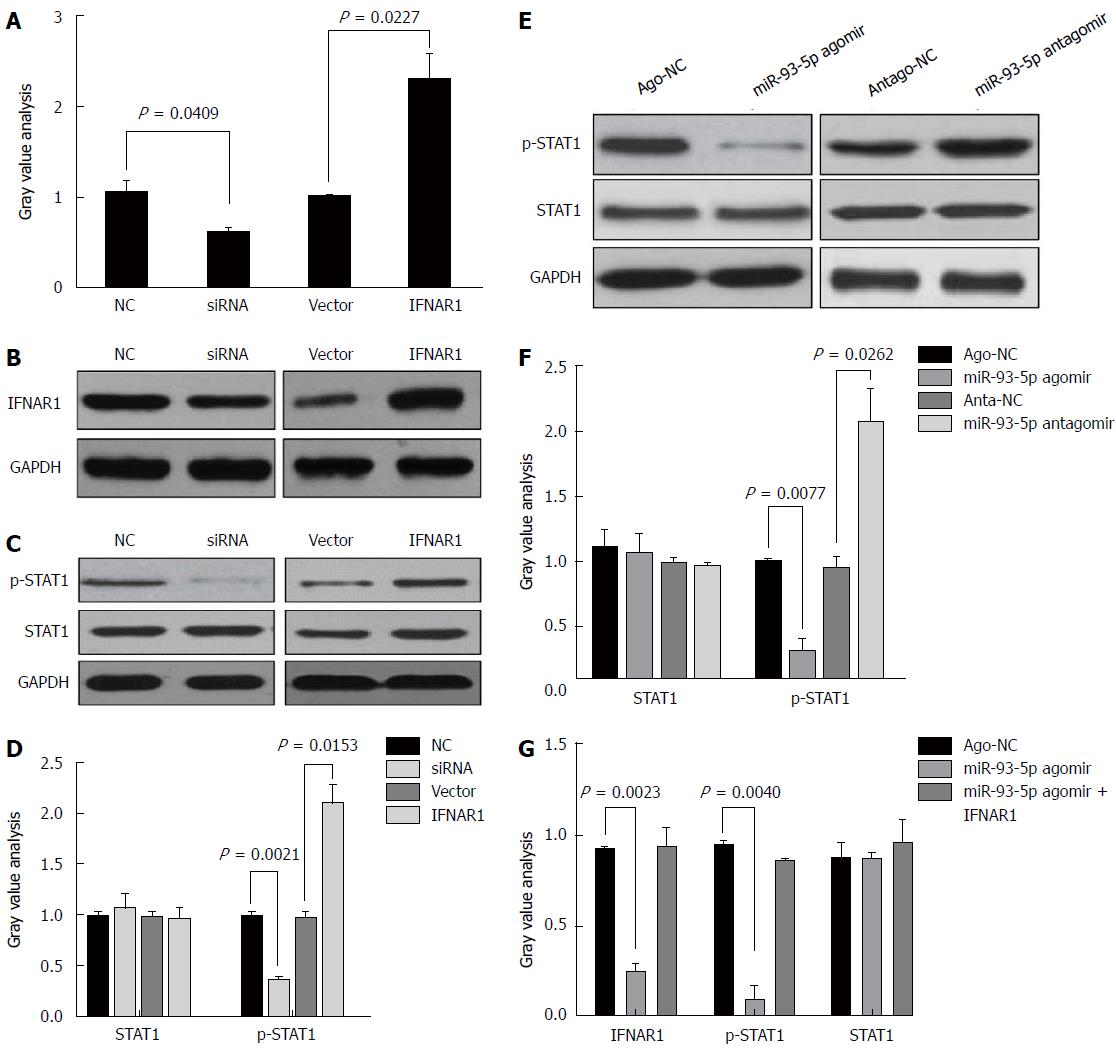
Figure 5 The miR-93-5p-IFNAR1 axis regulates the interferon signaling pathway.
A: Western blot shows the protein expression of IFNAR1 in Huh7 cells transfected with NC (200 ng/mL), siRNA (200 ng/mL), vector (200 ng/mL), or IFNAR1 (200 ng/mL). This experiment was repeated twice; B and C: Western blot shows the phosphorylation level of STAT1 and the protein expression of STAT1 in Huh7 cells transfected with NC (200 ng/mL), siRNA (200 ng/mL), vector (200 ng/mL), or IFNAR1 (200 ng/mL). This experiment was repeated twice; D and E: Western blot shows the phosphorylation level of STAT1 and the protein expression of STAT1 in Huh7 cells transfected with ago-NC (200 nmol/L), miR-93-5p agomir (200 nmol/L), antago-NC (200 nmol/L), or miR-93-5p antagomir (200 nmol/L). This experiment was repeated twice; F and G: Western blot shows the phosphorylation level of STAT1 and the protein expression of STAT1 and IFNAR1 in Huh7 cells transfected with ago-NC (200 nmol/L), miR-93-5p agomir (200 nmol/L), or miR-93-5p agomir (200 nmol/L) plus IFNAR1 (200 ng/mL). IFNAR1: Interferon receptor 1.
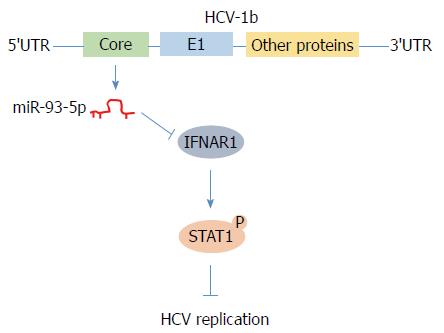
Figure 6 Schematic figure illustrating the mechanism that hepatitis C virus-1b core protein induces inactivation of the interferon signaling pathway via regulating miR-93-5p.
- Citation: He CL, Liu M, Tan ZX, Hu YJ, Zhang QY, Kuang XM, Kong WL, Mao Q. Hepatitis C virus core protein-induced miR-93-5p up-regulation inhibits interferon signaling pathway by targeting IFNAR1. World J Gastroenterol 2018; 24(2): 226-236
- URL: https://www.wjgnet.com/1007-9327/full/v24/i2/226.htm
- DOI: https://dx.doi.org/10.3748/wjg.v24.i2.226


