Copyright
©The Author(s) 2018.
World J Gastroenterol. Mar 21, 2018; 24(11): 1206-1215
Published online Mar 21, 2018. doi: 10.3748/wjg.v24.i11.1206
Published online Mar 21, 2018. doi: 10.3748/wjg.v24.i11.1206
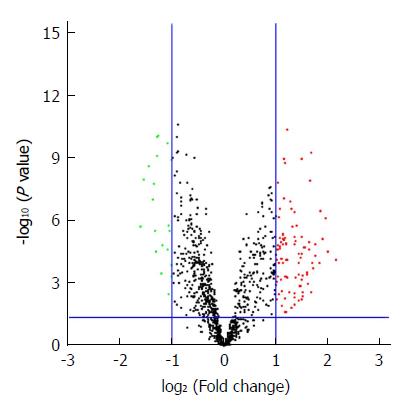
Figure 1 The volcano plot of the differentially expressed miRNAs.
A total of 110 DEMs were identified between 20 pairs of GC patients and adjacent normal tissues (cut-off criteria are P < 0.05 and fold change > 2.0). The green and red spots represent downregulated and upregulated miRNAs, respectively. DEMs: Differentially expressed miRNAs; GC: Gastric cancer.
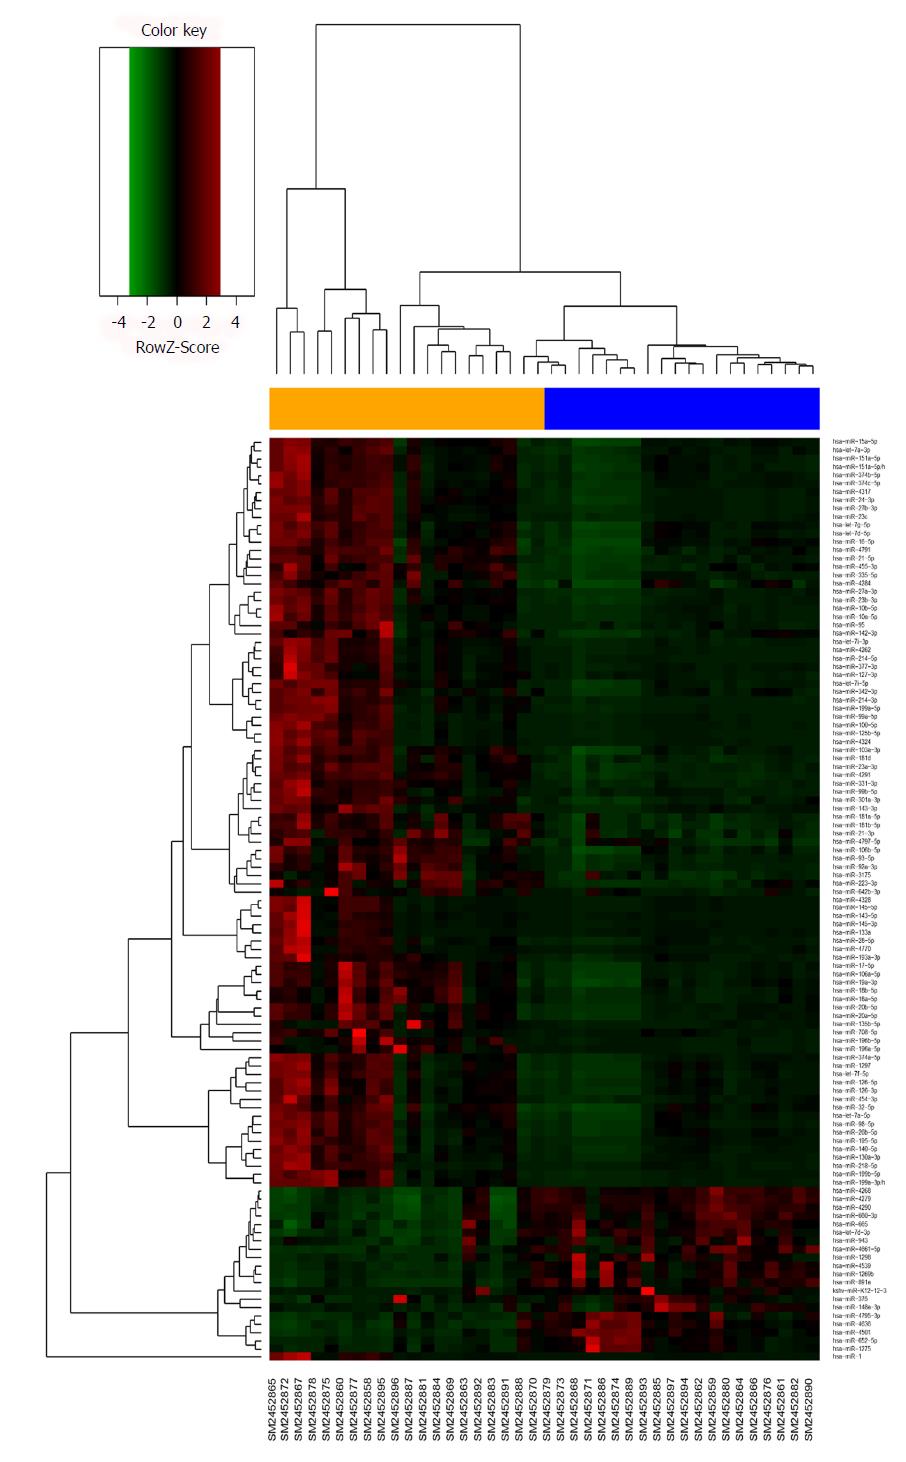
Figure 2 Hierarchical clustering analysis of the differentially expressed miRNAs between 20 pairs of gastric cancer and adjacent normal sample.
Each row represents the expression of an miRNA and each column represents a sample: orange color for gastric cancer, blue for normal.
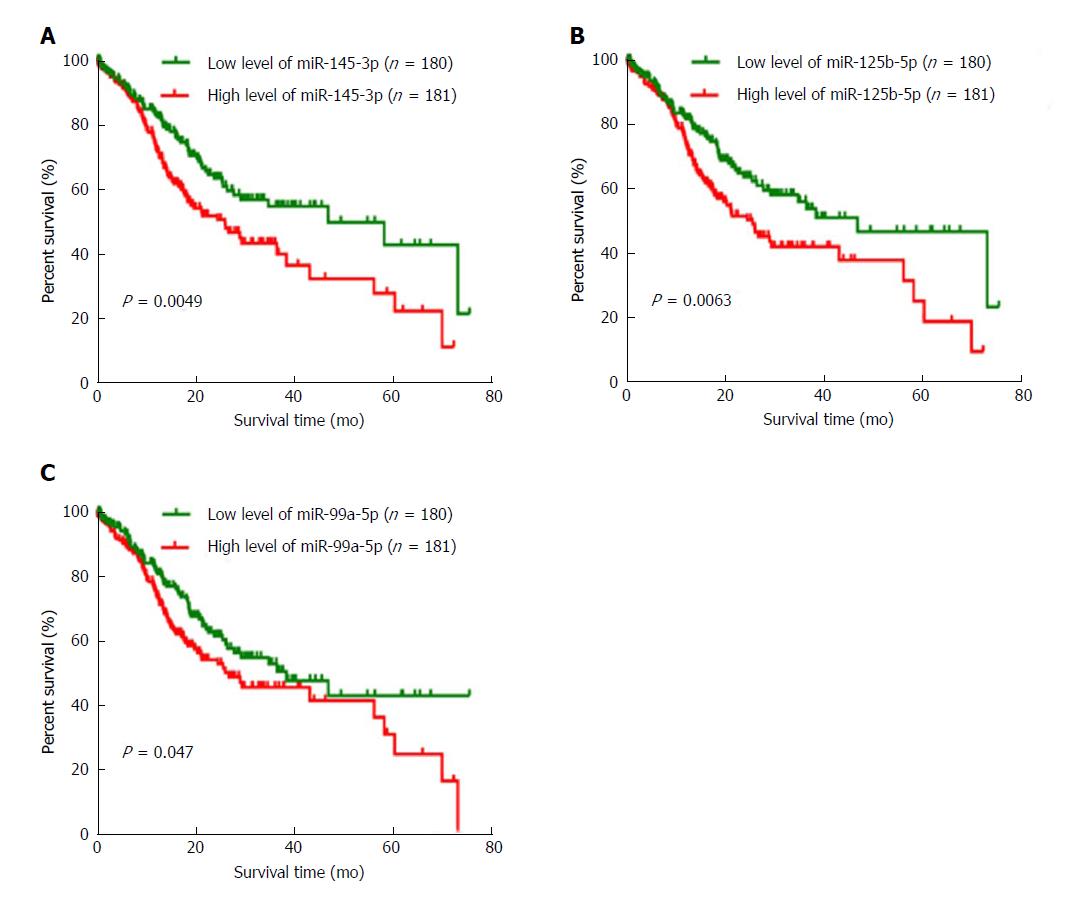
Figure 3 Three differentially expressed miRNAs are negatively associated with overall survival in gastric cancer.
A: Patients with a high level of miR-145-3p (n = 180) had a poorer prognosis than those with a low level of miR-145-3p (n = 181) (P = 0.0049). B: Patients with a high level of miR-125b-5p (n = 180) had a poorer prognosis than those with a low level of miR-125b-5p (n = 181) (P = 0.0063). C: Patients with a high level of miR-99a-5p (n = 180) had a poorer prognosis than those with a low level of miR-99a-5p (n = 181) (P = 0.047).
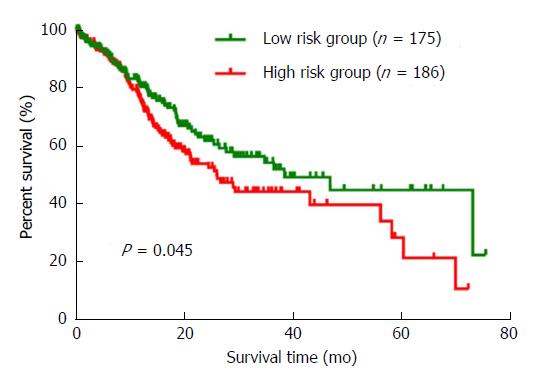
Figure 4 The Kaplan-Meier curve for the three-miRNA signature in gastric cancer.
The three differentially expressed miRNAs were ranked by the median of expression and then scored for each gastric cancer patient in accordance with high or low-level expression. The low risk group (n = 175) and high risk group (n = 186) were defined by the total scores. Compared to the low risk group, patients in the high risk group had a poorer prognosis (P = 0.045).
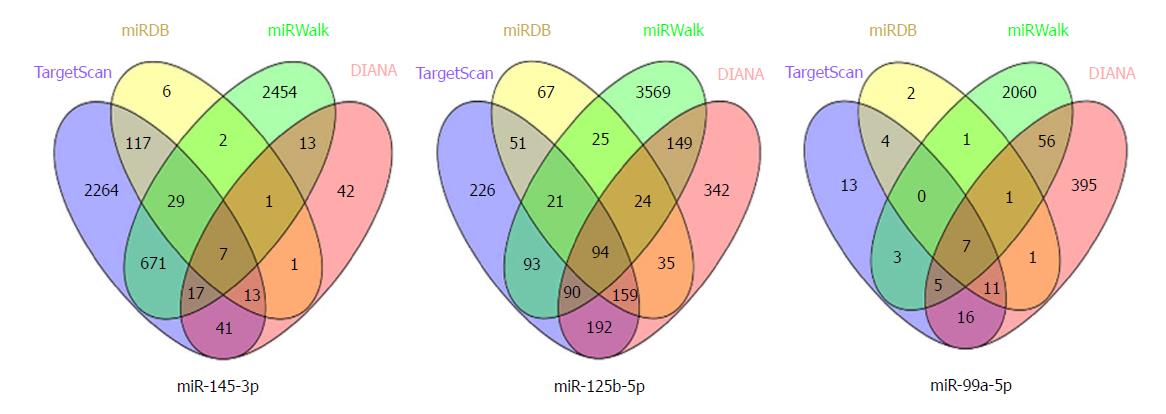
Figure 5 The consensus target genes of each differentially expressed miRNA.
The target genes of the three miRNAs were predicted with four online tools (TargetScan, miRDB, miRWalk, and DIANA).
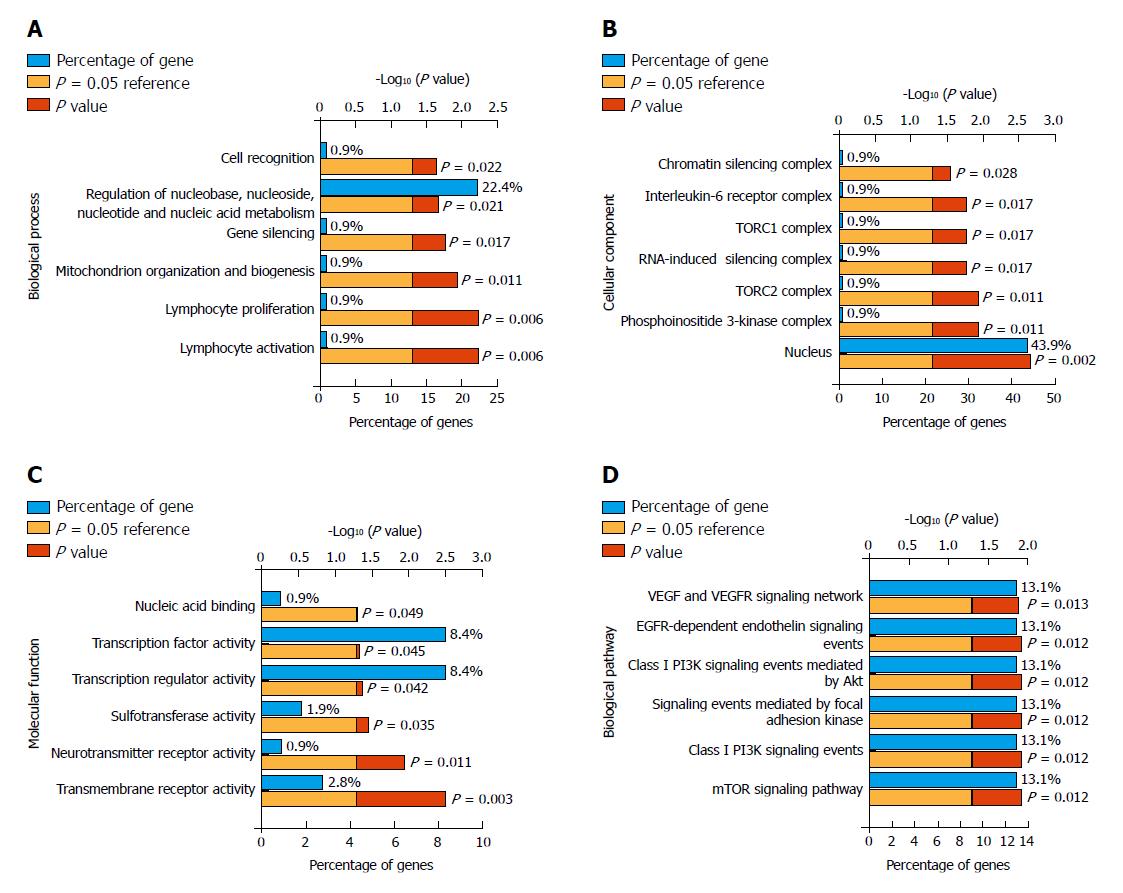
Figure 6 Genetic functional enrichment analysis.
A total of 108 consensus genes were used for functional enrichment analysis with the tool of FunRich. A: Biological process analysis showed that the genes are involved in cell recognition and gene silencing; B: Cellular component analysis indicated that the genes are portion of nucleus, chromatin silencing complex, and TORC1/2 complex; C: Molecular function results showed that the genes are involved in nucleic acid binding, transcription factor activity, and transmembrane receptor activity; D: Biological pathway analysis indicated that the genes participate in focal adhesion, PI3K, and mTOR cancer-related signaling pathways. TORC1/2: Target of rapamycin 1/2; PI3K: Phosphatidylinositide 3-kinase; mTOR: Mammalian target of rapamycin.
- Citation: Zhang C, Zhang CD, Ma MH, Dai DQ. Three-microRNA signature identified by bioinformatics analysis predicts prognosis of gastric cancer patients. World J Gastroenterol 2018; 24(11): 1206-1215
- URL: https://www.wjgnet.com/1007-9327/full/v24/i11/1206.htm
- DOI: https://dx.doi.org/10.3748/wjg.v24.i11.1206


