Copyright
©The Author(s) 2017.
World J Gastroenterol. Mar 7, 2017; 23(9): 1594-1601
Published online Mar 7, 2017. doi: 10.3748/wjg.v23.i9.1594
Published online Mar 7, 2017. doi: 10.3748/wjg.v23.i9.1594
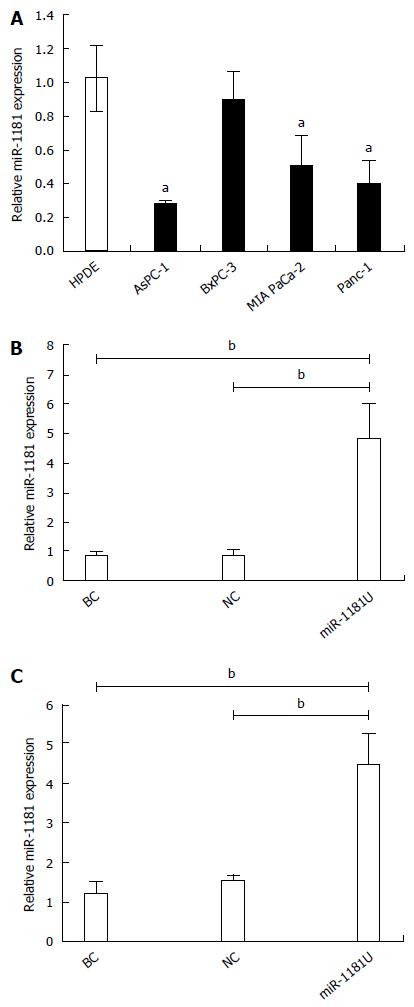
Figure 1 miR-1181 was downregulated in pancreatic cancer cell lines.
A: MiR-1181 expression was evaluated in pancreatic cancer cell lines and HPDE cells by PCR, aP < 0.05; B: Confirmation of miR-1181 upregulation in PANC-1 stable cell lines compared with negative control (NC) cells by PCR; C: Confirmation of miR-1181 upregulation in MIA-PaCa-2 stable cell lines compared with NC cells by PCR, bP < 0.01. BC: Blank control.
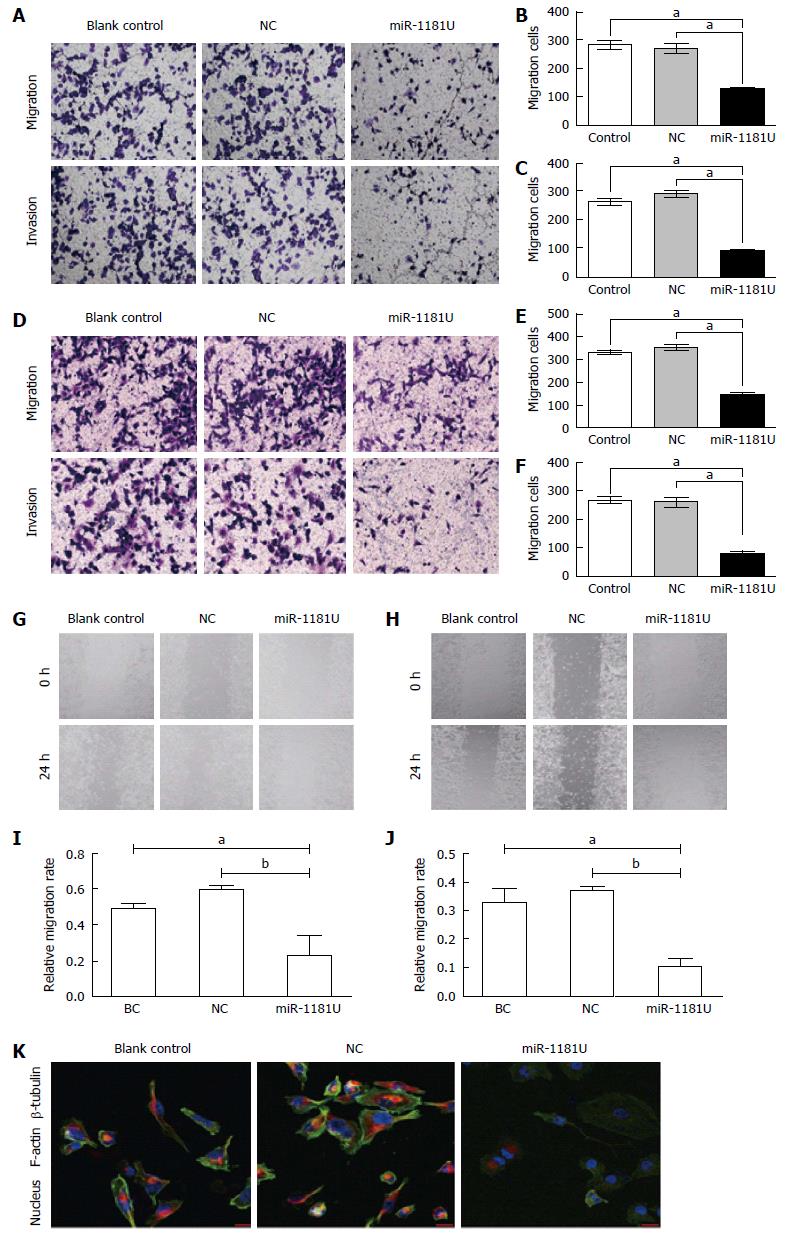
Figure 2 miR-1181 inhibited pancreatic cancer cell migration and invasion.
A: Indicated PANC-1 cells were subjected to transwell assays and relative migration and invasion capability was quantitative analyzed (B and C), aP < 0.05; D: Indicated MIA-PaCa-2 cells were subjected to transwell assays and relative migration and invasion capability was quantitative analyzed (E and F), aP < 0.05; G and I: Indicated PANC-1 and MIA-PaCa-2 (H and J) cells were subjected to wound-healing assays and quantitative analyzed, aP < 0.05, bP < 0.01, eP < 0.001; K: Immunofluorescence staining shows decreased F-actin and β-tubulin expression in PANC-1 cells over-expressing miR-1181 compared with the blank control and negative control (NC) cells.
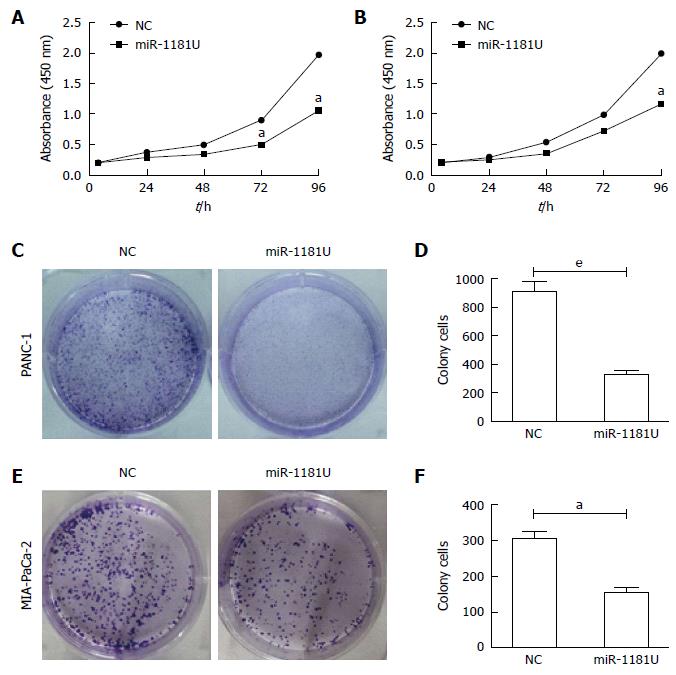
Figure 3 MiR-1181 inhibited pancreatic cancer cell proliferation.
Indicated PANC-1 (A) and MIA-PaCa-2 (B) cells were subjected to CCK-8 assays, aP < 0.05. Negative control (NC) cells were used as control. aP < 0.05; C: Indicated PANC-1 cells were subjected to colony forming assays and quantitative analyzed (D), eP < 0.001; E: Indicated MIA-PaCa-2 cells were subjected to colony forming assays and quantitative analyzed (F), aP < 0.05.
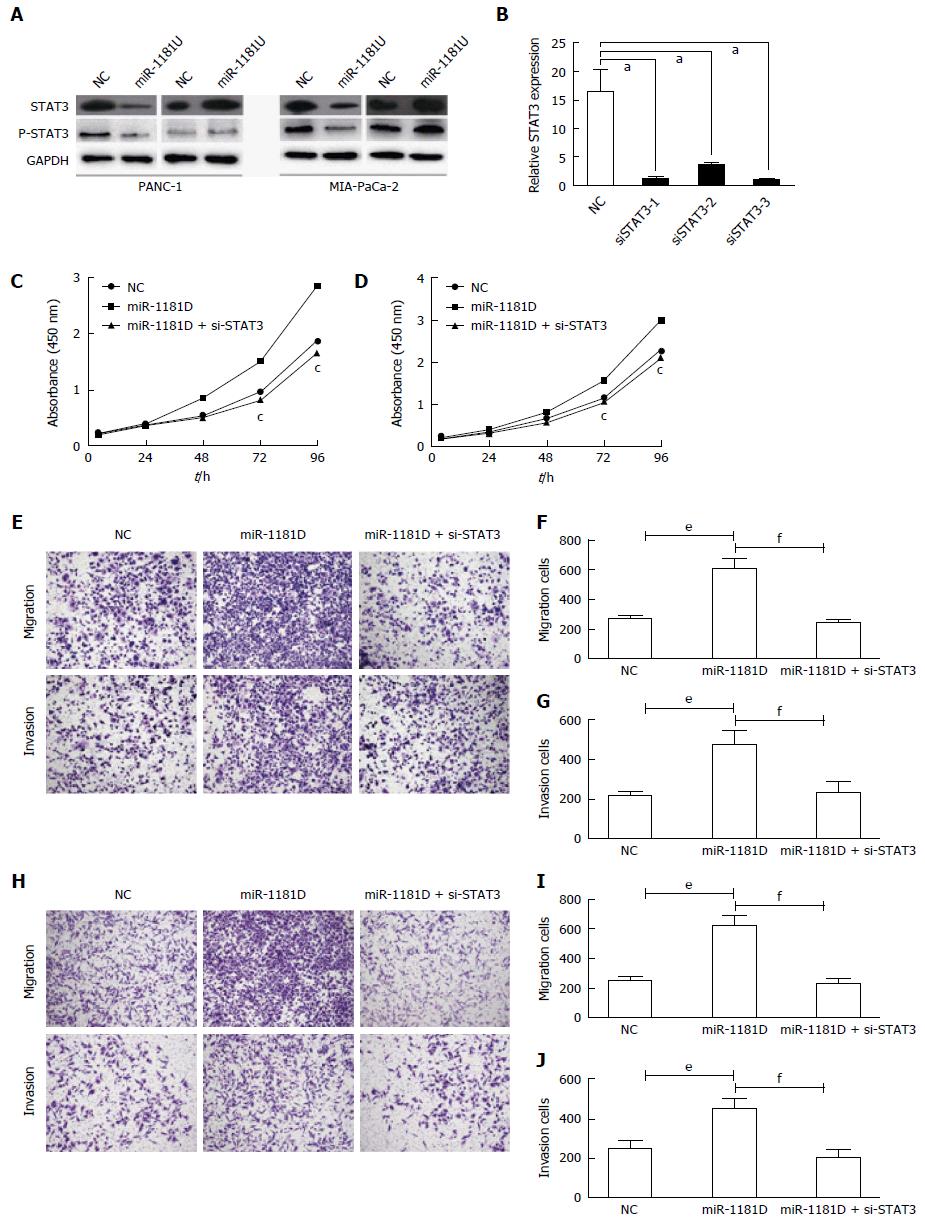
Figure 4 miR-1181 inhibits invasion and proliferation via STAT3 in pancreatic cancer cells.
A: Indicated cells were subjected to Western blot assay to detect STAT3 and p-STAT3 expression; B: We designed 3 siRNA targeted STAT3 and verified by PCR, aP < 0.05; C: Indicated PANC-1 cells were subjected to CCK-8 assays, cP < 0.05; D: Indicated MIA-PaCa-2 cells were subjected to CCK-8 assays, aP < 0.05; E: Indicated PANC-1 cells were subjected to transwell assays and relative migration and invasion capability was quantitative analyzed (F and G), eP < 0.001, fP < 0.001; H: Indicated MIA-PaCa-2 cells were subjected to transwell assays and relative migration and invasion capability was quantitative analyzed (I and J), eP < 0.001, fP < 0.001.
- Citation: Wang J, Guo XJ, Ding YM, Jiang JX. miR-1181 inhibits invasion and proliferation via STAT3 in pancreatic cancer. World J Gastroenterol 2017; 23(9): 1594-1601
- URL: https://www.wjgnet.com/1007-9327/full/v23/i9/1594.htm
- DOI: https://dx.doi.org/10.3748/wjg.v23.i9.1594


