Copyright
©The Author(s) 2017.
World J Gastroenterol. Mar 7, 2017; 23(9): 1586-1593
Published online Mar 7, 2017. doi: 10.3748/wjg.v23.i9.1586
Published online Mar 7, 2017. doi: 10.3748/wjg.v23.i9.1586
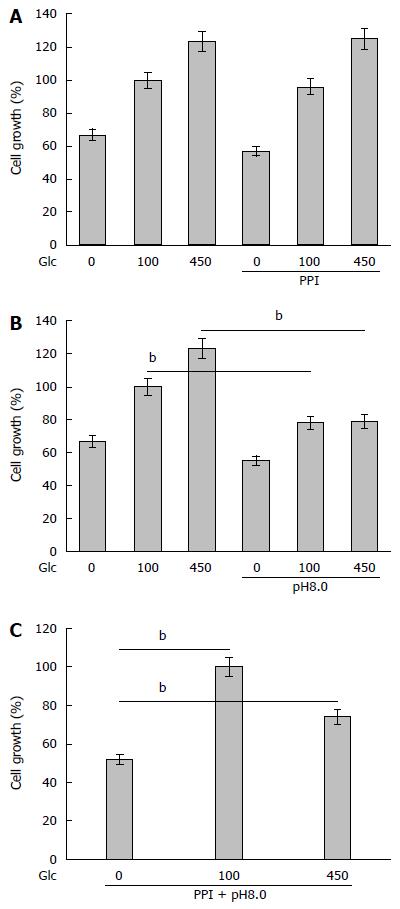
Figure 1 Effect of proton pump inhibitor and/or alkaline pH on CT26 cell growth.
Cell growth of CT26 cells was examined in different concentration of glucose (Glc) concentration (0, 100, 450 mg/dL). A: Pantoprazole (10 μg/mL) treatment (PPI); B: DMEM-pH8.0 treatment (pH 8.0); and C: Treatment with PPI and alkaline media (pH 8.0). Error bar, SD calculated from 3 independent experiments by Student's t-test. PPI: Proton pump inhibitor. bP < 0.001.
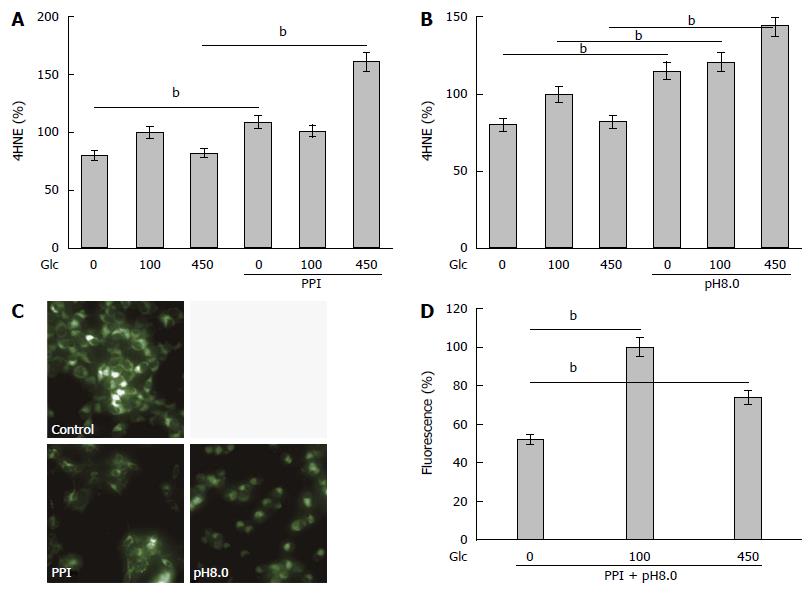
Figure 2 Effect of proton pump inhibitor and/or alkaline pH on oxidative stress and mitochondria volume.
A and B: Levels of 4-hydroxynonenal (4HNE) was measured by ELISA. Relative quantities were designated (Glucose 100 mg/dL without PPI or pH8.0 is set to 100%); C: Mitochondrial volume was examined by Mitogreen staining; D: The fluorescence strength of Mitogreen (Strength in cells treated with glucose 0 mg/dL is set to 100%). Error bar, SD calculated from 3 independent experiments by Student's t-test. PPI: Proton pump inhibitor. bP < 0.001.
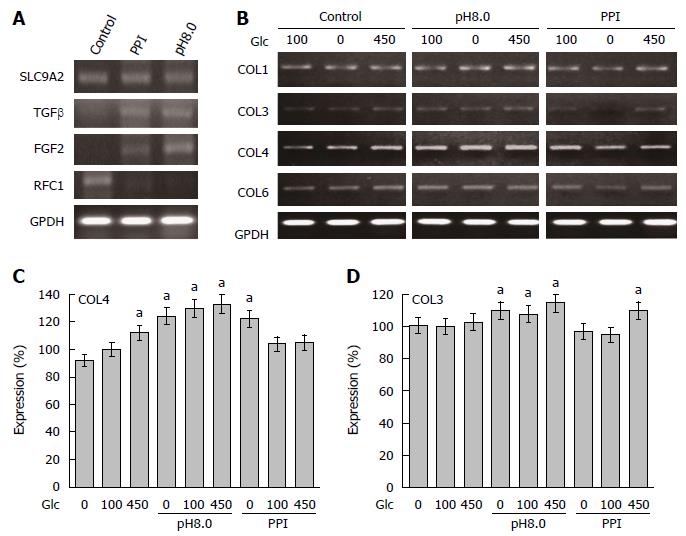
Figure 3 Expression of collagen and collagen-associated genes in CT26 cells.
A: Expression of Na+-H+ exchanger gene (SLC9A2) and collagen-associated genes was examined by RT-PCR in CT26 cells treated with PPI or alkaline media. Glyceraldehyde 3-phosphate dehydrogenase (GPDH) served as an internal control; B: Expression of collagen type I, III, IV and VI in CT26 cells treated with PPI or alkaline media; C and D: The expression of collagen type I, III, IV and VI in CT26 cells was semi-quantitated. Expression in cells without treatment in 100 mg/dL glucose concentration was set to 100% as a reference. Asterisk shows significant difference from the reference. Error bar, SD calculated from 3 independent experiments by Student's t-test. PPI: Proton pump inhibitor.
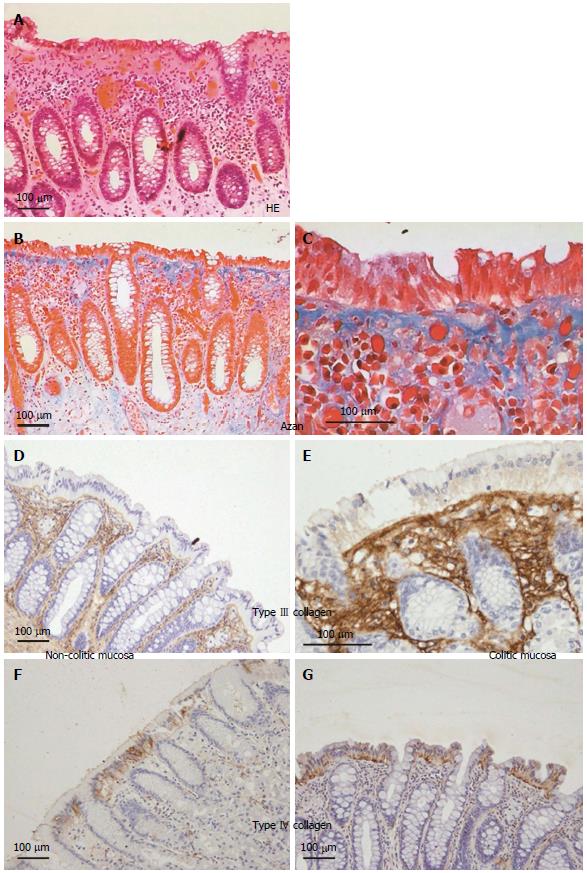
Figure 4 Expression of collagen type III and IV in colonic mucosa of collagenous colitis patients.
A-C: Histopathological appearance of colonic mucosa in collagenous colitis patients. Thickened basement membrane at the covering epithelium was observed in HE (A) and Azan (B and C) staining; D-G: Immunohistochemistry of collagen type III (D and E) and type IV (F and G) in non-pathologic mucosa (D and F) and collagenous colitis mucosa (E and G).
- Citation: Mori S, Kadochi Y, Luo Y, Fujiwara-Tani R, Nishiguchi Y, Kishi S, Fujii K, Ohmori H, Kuniyasu H. Proton pump inhibitor induced collagen expression in colonocytes is associated with collagenous colitis. World J Gastroenterol 2017; 23(9): 1586-1593
- URL: https://www.wjgnet.com/1007-9327/full/v23/i9/1586.htm
- DOI: https://dx.doi.org/10.3748/wjg.v23.i9.1586


