Copyright
©The Author(s) 2017.
World J Gastroenterol. Feb 28, 2017; 23(8): 1434-1442
Published online Feb 28, 2017. doi: 10.3748/wjg.v23.i8.1434
Published online Feb 28, 2017. doi: 10.3748/wjg.v23.i8.1434
Figure 1 Flow chart of proteomic analysis.
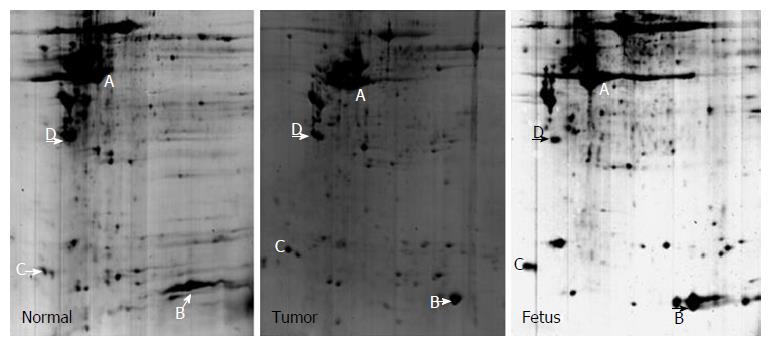
Figure 2 2-D gel images for tumor-adjacent normal esophageal epithelial tissue, esophageal squamous cell carcinoma tissue, and fetal esophageal tissue.
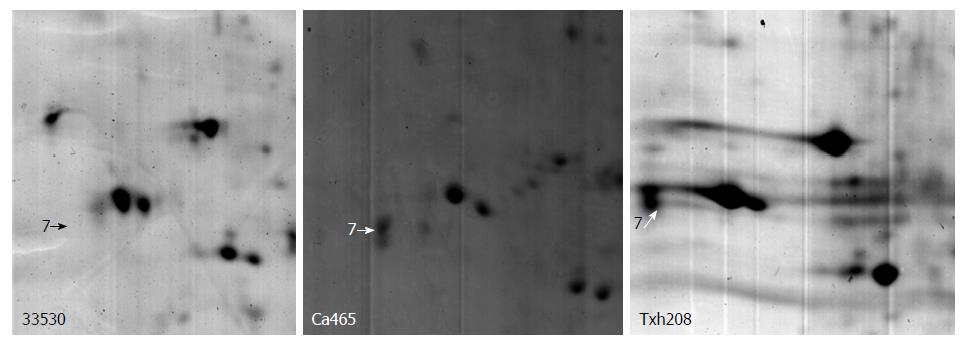
Figure 3 A typical differential protein spot in tumor-adjacent normal esophageal epithelial tissue, esophageal squamous cell carcinoma tissue, and fetal esophageal tissue.
The spot was rarely detected in normal esophageal epithelial tissue, but was overexpressed in esophageal squamous cell carcinoma and fetal esophageal tissues.
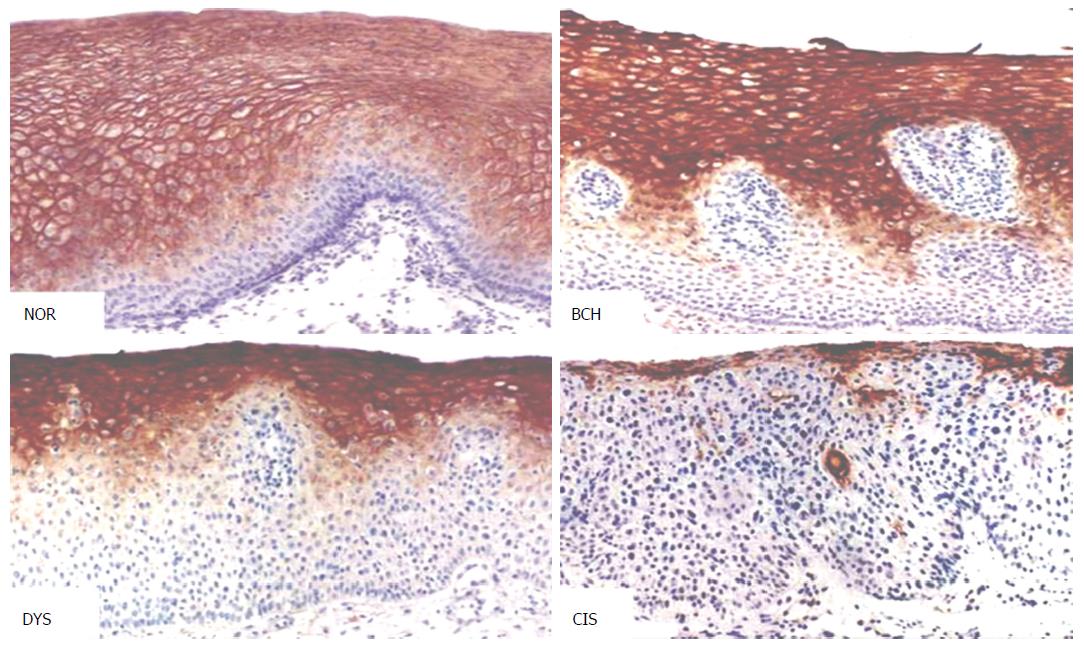
Figure 4 Peroxiredoxin 6 expression in different types of esophageal lesions (DAB, magnification × 200).
NOR: Normal epithelium; BCH: Basal cell hyperplasia; DYS: Dysplasia; CIS: Carcinoma in situ.
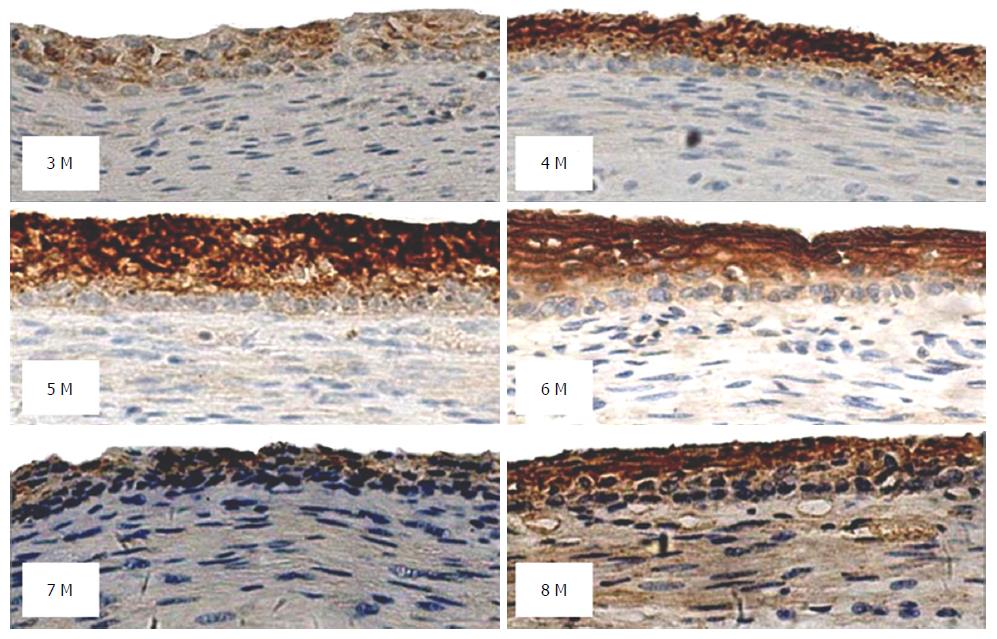
Figure 5 Peroxiredoxin 6 expression in esophageal tissues from fetuses at a gestational age of 3-8 mo (DAB, magnification × 200).
- Citation: Guo JH, Xing GL, Fang XH, Wu HF, Zhang B, Yu JZ, Fan ZM, Wang LD. Proteomic profiling of fetal esophageal epithelium, esophageal cancer, and tumor-adjacent esophageal epithelium and immunohistochemical characterization of a representative differential protein, PRX6. World J Gastroenterol 2017; 23(8): 1434-1442
- URL: https://www.wjgnet.com/1007-9327/full/v23/i8/1434.htm
- DOI: https://dx.doi.org/10.3748/wjg.v23.i8.1434


