Copyright
©The Author(s) 2017.
World J Gastroenterol. Feb 14, 2017; 23(6): 964-975
Published online Feb 14, 2017. doi: 10.3748/wjg.v23.i6.964
Published online Feb 14, 2017. doi: 10.3748/wjg.v23.i6.964
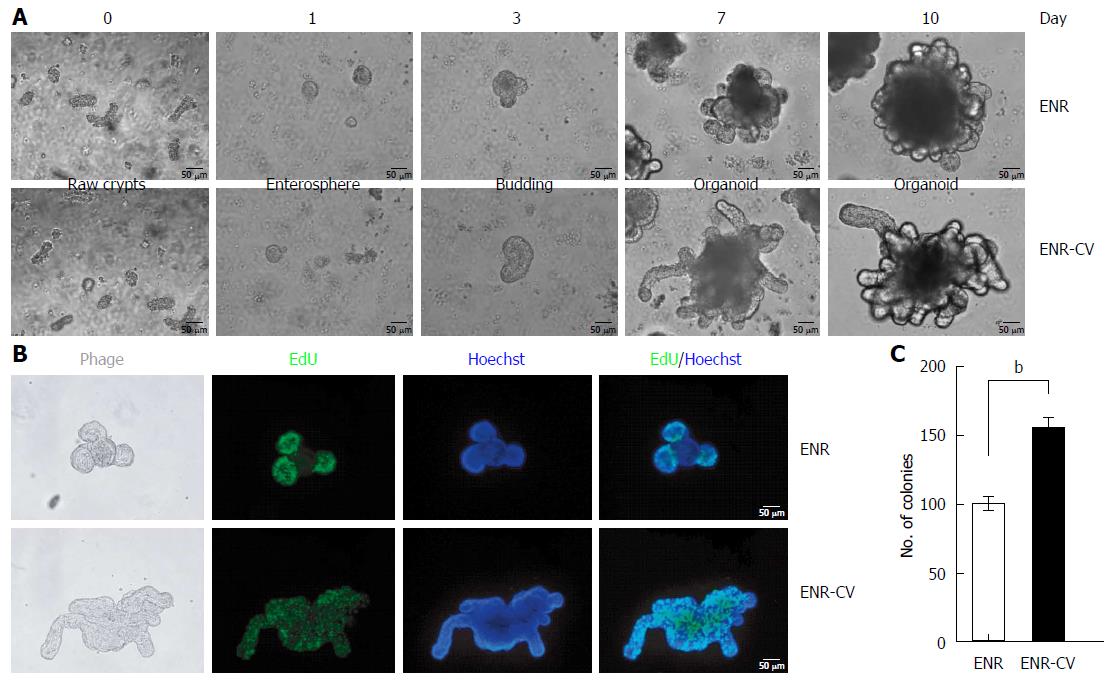
Figure 1 Establishment of small intestinal organoid culture under epidermal growth factor/noggin/r-spondin1 and epidermal growth factor/noggin/r-spondin1-/CHIR99021/VPA conditions.
Crypts were isolated from the small intestines of C57/B6 mice at ages 9-12 wk and were resuspended in growth factor-reduced Matrigel. A: Time course of the growth of isolated crypts at passage 0 (P0) under two different culture media. Enterospheres formed on day 1, budding appeared on day 3, and robust budding was observed on days 5-10. Scale bars: 50 μm. B: Organoids were incubated with the thymidine analog EdU (green) for 1 h, and freshly isolated crypts were cultured for 6 d. Images were analyzed by fluorescence microscopy, and nuclei were double stained with Hoechst (blue). Scale bars: 50 μm. C: Numbers of organoids grown in two different media for 7 d. Organoids exhibiting at least two budding structures in each group were counted. The data are shown as means ± SDs of triplicate experiments (bP < 0.01, Student’s t-tests).
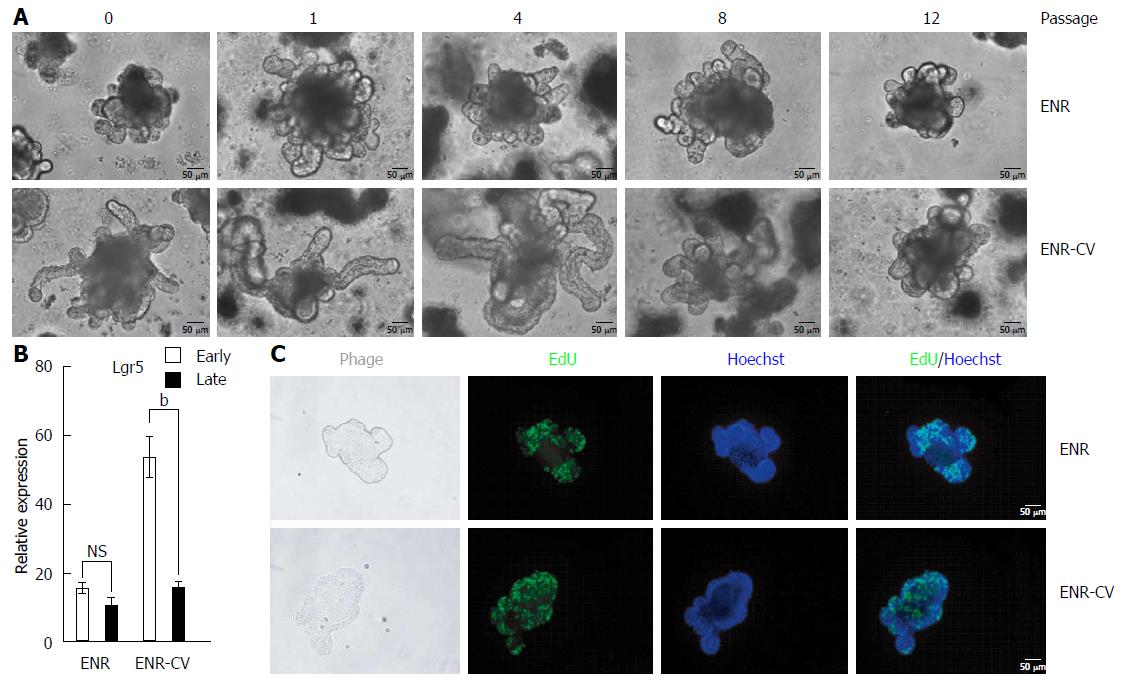
Figure 2 Phenotypic differences of intestinal organoids cultured under epidermal growth factor/noggin/r-spondin1-/CHIR99021/VPA or epidermal growth factor/noggin/r-spondin1 conditions upon continual passage.
Organoids cultured for 7 d from freshly isolated crypt were split (1:4) and were cultured. Passage was performed once per week. A: Representative morphology of organoids cultured on day 7 under ENR or ENR-CV conditions upon continual passage. Scale bars; 50 μm. B: Quantitative real-time polymerase chain reaction analysis of relative mRNA expression levels of markers for intestinal stem cells (Lgr5) in organoids at early passage (P0-4) or late passage (P8-12) after culture for 6 d under ENR or ENR-CV conditions. GAPDH was used as an internal control. The data are shown as means ± SEMs of two independent experiments (bP < 0.01, two-way analysis of variance with Dunnett’s T3 tests) and normalized to the value for the ENR condition. Note that the mean of the sum from each passage with triplicate experiments in the indicated early and late passages was used. C: Organoids cultured on day 6 at late passage (P10) were incubated with the thymidine analog EdU (green) for 1 h. Images were analyzed by fluorescence microscopy. Nuclei were double stained with Hoechst (blue). Scale bars: 50 μm. GAPDH: Glyceraldehyde 3-phosphate dehydrogenase; ENR: Epidermal growth factor/Noggin/R-spondin1; ENR-CV: ENR/CHIR99021/VPA.
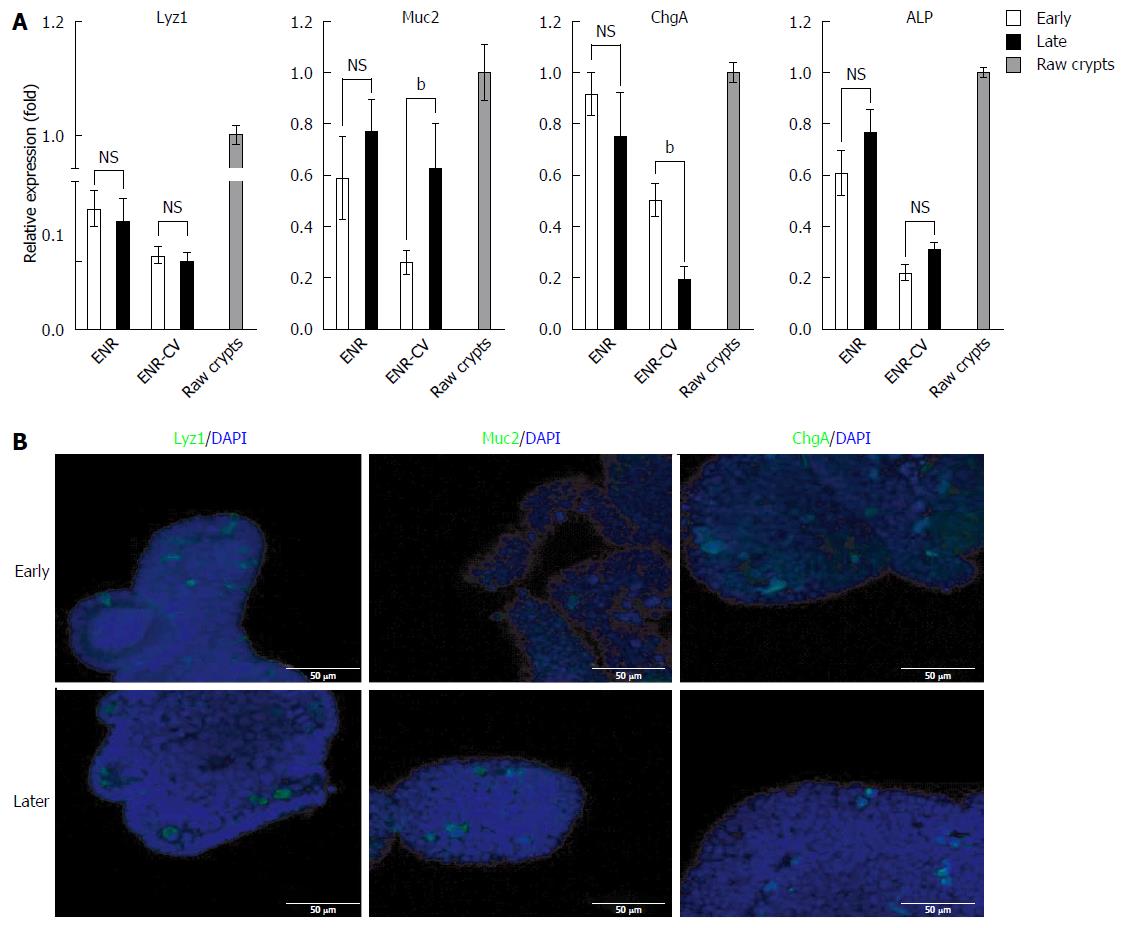
Figure 3 Comparison of the compositions of differentiated intestinal epithelial cells in long-term cultured intestinal organoids under two different media.
A: Quantitative real-time polymerase chain reaction analysis of relative mRNA expression of markers for intestinal epithelial cells (Muc2 for goblet cells, ChgA for enteroendocrine cells, Alp for enterocytes, and Lyz1 for paneth cells) in organoids at early passage (P0-4) or late passage (P8-12) cultured for 6 d under ENR or ENR-CV conditions. GAPDH was used as an internal control. The data are shown as means ± SEMs of two independent experiments (bP < 0.01, two-way analysis of variance with Dunnett’s T3 test) and normalized to the ENR value. Note that the mean of the sum from each passage with triplicate experiments in the indicated early and late passages was used. Raw crypts: freshly isolated crypts from mice. B: Representative images show lysozyme (paneth cells), Muc2 (goblet cells), and ChgA (enteroendocrine cells) staining of organoids cultured for 6 d at passages 3 and 10 under ENR-CV conditions. Three-dimensional reconstructed confocal images are shown. Nuclei were double stained with DAPI (blue). Scale bars: 50 μm. GAPDH: Glyceraldehyde 3-phosphate dehydrogenase; ENR: Epidermal growth factor/Noggin/R-spondin1; ENR-CV: ENR/CHIR99021/VPA.
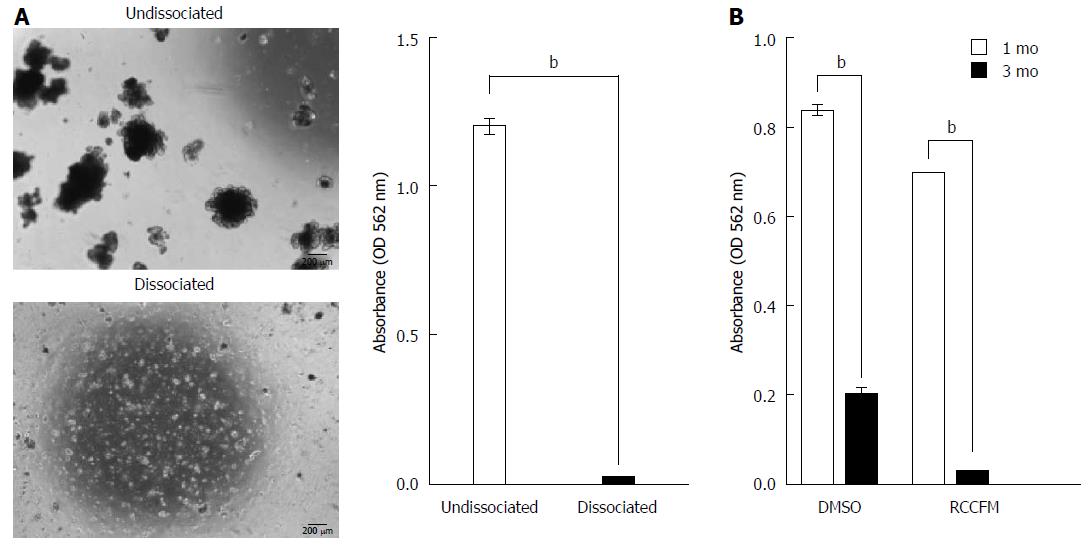
Figure 4 Low recovery of cryopreserved intestinal organoids upon long-term cryopreservation.
Cultured organoids (P3) under ENR medium were subjected to dissociation or were left undissociated, followed by cryopreservation. A: Representative morphology (left panel) and quantification of recovery (right panel) for organoids on day 7 cultured under ENR conditions after thawing organoid cryopreserved for 1 mo in the presence of 10% DMSO as a cryoprotectant. Scale bars: 200 μm. The data are shown as the means ± SDs of triplicate MTT assays (bP < 0.01, Student’s t-tests). B: Quantification of recovery from cryopreserved organoid was performed using MTT assay. After 1 or 3 mo of cryopreservation with 10% DMSO or RCCFM (commercial freezing media), organoids were cultured for 7 d under ENR conditions. The data are shown as the mean ± SDs of triplicate experiments (bP < 0.01, two-way analysis of variance with Dunnett’s T3 tests). MTT: Methyl thiazolyl tetrazolium; ENR: Epidermal growth factor/Noggin/R-spondin1.
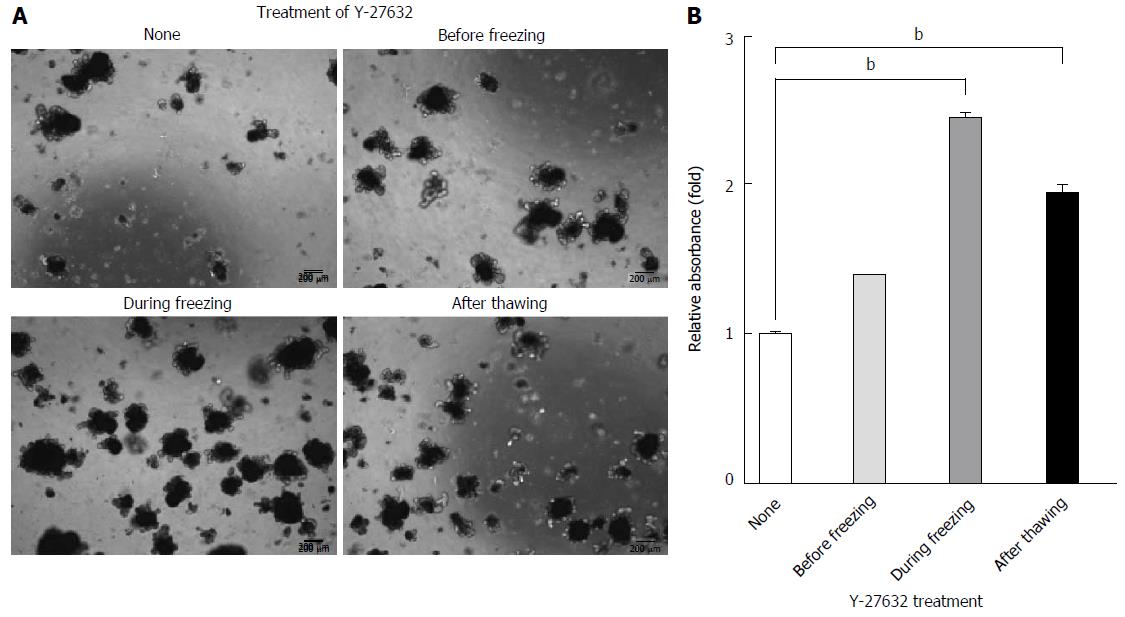
Figure 5 Enhanced recovery of long-term cryopreserved intestinal organoids was dependent on the timing of Y-27632 treatment.
Undissociated organoids (P3) were treated with 10 μmol/L Y-27632 at the indicated time points. A: Representative morphology of organoids cultured on day 7 in the presence of ENR medium after thawing organoids cryopreserved for 3 mo in the presence of 10% DMSO. Scale bars, 200 μm. B: Quantification of recovery from cryopreserved organoids was performed using MTT assays. The data are shown as means ± SDs of triplicate experiments (bP < 0.01, two-way analysis of variance with Dunnett’s T3 tests) and normalized to untreated samples. MTT: Methyl thiazolyl tetrazolium; ENR: Epidermal growth factor/Noggin/R-spondin1.
- Citation: Han SH, Shim S, Kim MJ, Shin HY, Jang WS, Lee SJ, Jin YW, Lee SS, Lee SB, Park S. Long-term culture-induced phenotypic difference and efficient cryopreservation of small intestinal organoids by treatment timing of Rho kinase inhibitor. World J Gastroenterol 2017; 23(6): 964-975
- URL: https://www.wjgnet.com/1007-9327/full/v23/i6/964.htm
- DOI: https://dx.doi.org/10.3748/wjg.v23.i6.964


