Copyright
©The Author(s) 2017.
World J Gastroenterol. Dec 21, 2017; 23(47): 8432-8436
Published online Dec 21, 2017. doi: 10.3748/wjg.v23.i47.8432
Published online Dec 21, 2017. doi: 10.3748/wjg.v23.i47.8432
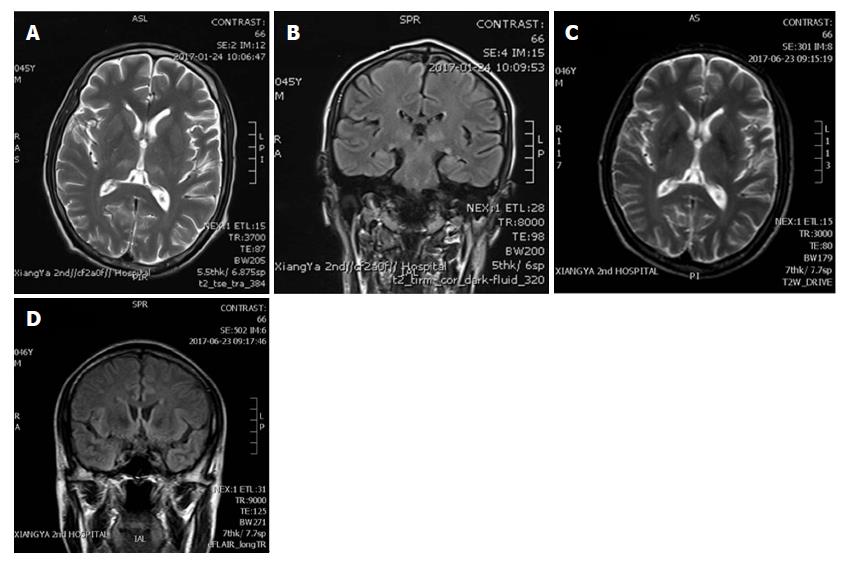
Figure 1 Brain magnetic resonance imaging.
(A) and (B) are MRIs taken before the thiamine treatment, while (C) and (D) are from 5 mo after the thiamine treatment. A: Symmetrical high T2 signal intensities in pons; B: Symmetrical high T2 signal intensities in paraventricular area; C: Reduction of abnormal signal in pons; D: Reduction of abnormal signal in paraventricular area. MRI: Magnetic resonance imaging.
- Citation: Xie B, Si ZZ, Tang WT, Qi HZ, Li T. Wernicke encephalopathy in a patient after liver transplantation: A case report. World J Gastroenterol 2017; 23(47): 8432-8436
- URL: https://www.wjgnet.com/1007-9327/full/v23/i47/8432.htm
- DOI: https://dx.doi.org/10.3748/wjg.v23.i47.8432


