Copyright
©The Author(s) 2017.
World J Gastroenterol. Dec 21, 2017; 23(47): 8376-8386
Published online Dec 21, 2017. doi: 10.3748/wjg.v23.i47.8376
Published online Dec 21, 2017. doi: 10.3748/wjg.v23.i47.8376
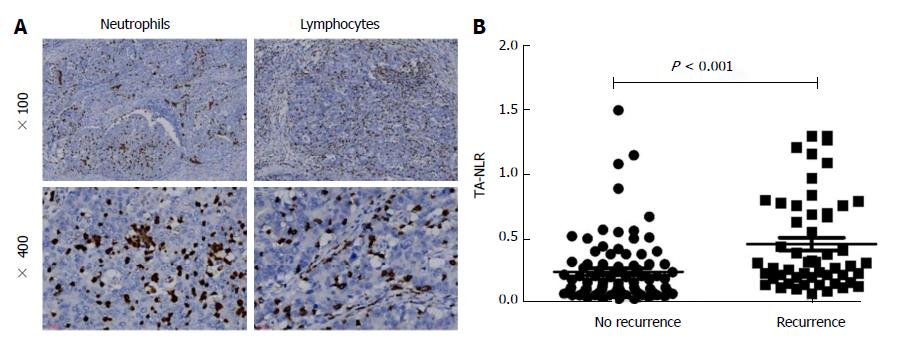
Figure 1 Relationship between the tumor-associated neutrophil-to-lymphocyte ratio and tumor recurrence.
A: Representative immunohistochemical staining for CD15 (left) and CD8 (right); B: Significant differences in the TA-NLR were observed between the recurrence group (0.46% ± 0.05%, mean ± SE) and the non-recurrence group (0.24% ± 0.03%, P < 0.001). TA-NLR: Tumor-associated neutrophil-to-lymphocyte ratio.
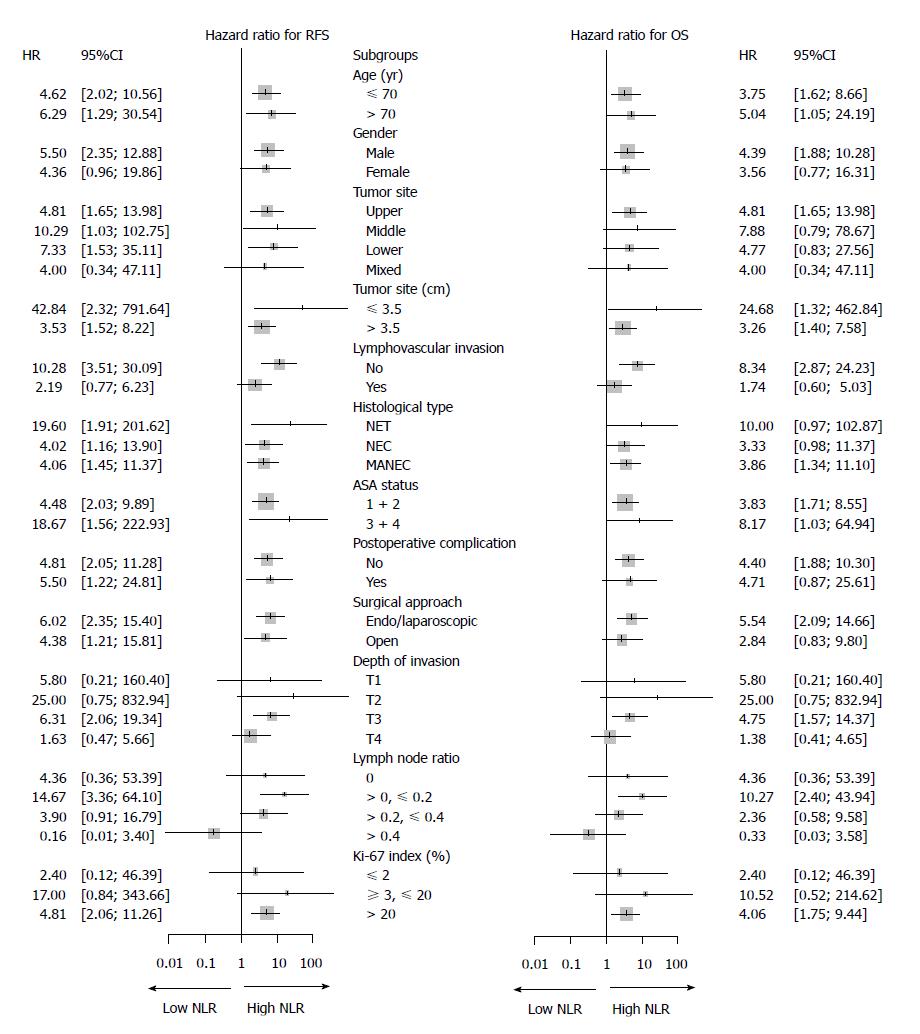
Figure 2 Forest plot showing the hazard ratios (oblongs) and 95%CIs (bars) for RFS (left) and OS (right) (according to subgroups) among 142 patients with gastric neuroendocrine neoplasms undergoing radical surgery.
Long-term survival, including RFS and OS, was better among patients with a low TA-NLR than in patients with a high TA-NLR. g-NENs: Gastric neuroendocrine neoplasms. RFS: Recurrence-free survival; OS: Overall survival; TA-NLR: Tumor-associated neutrophil-to-lymphocyte ratio.
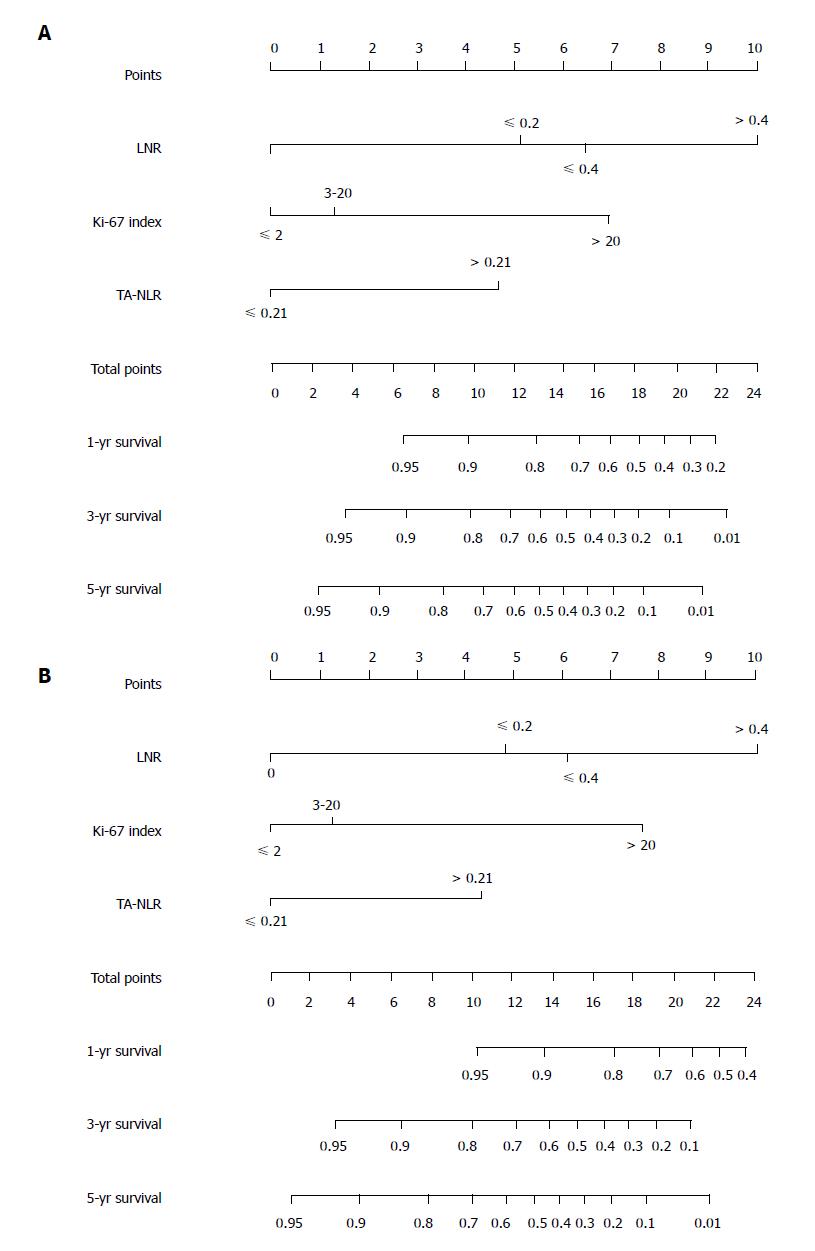
Figure 3 Nomograms for the prediction of recurrence-free survival (A) and overall survival (B) in patients following gastric neuroendocrine neoplasm resection; the C-index was 0.
788 and 0.759 for RFS and OS, respectively. LNR: Lymph node ratio; TA-NLR: Tumor-associated neutrophil-to-lymphocyte ratio.
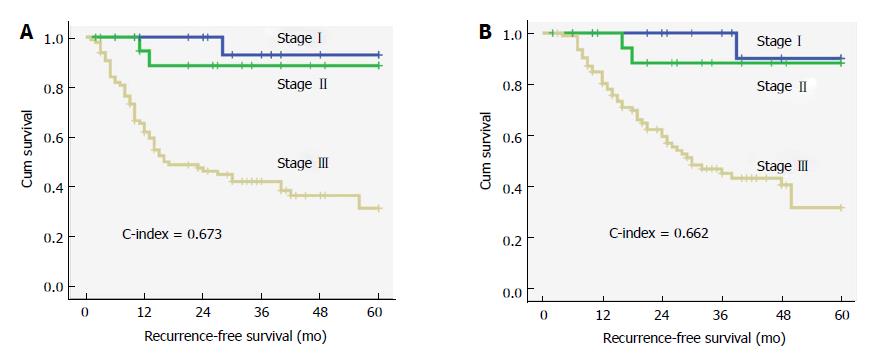
Figure 4 Survival curves for recurrence-free survival (A) and overall survival (B) according to the traditional TNM staging system (NCCN 2015); the C-index was 0.
673 and 0.662 for RFS and OS, respectively.
- Citation: Cao LL, Lu J, Lin JX, Zheng CH, Li P, Xie JW, Wang JB, Chen QY, Lin M, Tu RH, Huang CM. Nomogram based on tumor-associated neutrophil-to-lymphocyte ratio to predict survival of patients with gastric neuroendocrine neoplasms. World J Gastroenterol 2017; 23(47): 8376-8386
- URL: https://www.wjgnet.com/1007-9327/full/v23/i47/8376.htm
- DOI: https://dx.doi.org/10.3748/wjg.v23.i47.8376


