Copyright
©The Author(s) 2017.
World J Gastroenterol. Dec 21, 2017; 23(47): 8355-8366
Published online Dec 21, 2017. doi: 10.3748/wjg.v23.i47.8355
Published online Dec 21, 2017. doi: 10.3748/wjg.v23.i47.8355
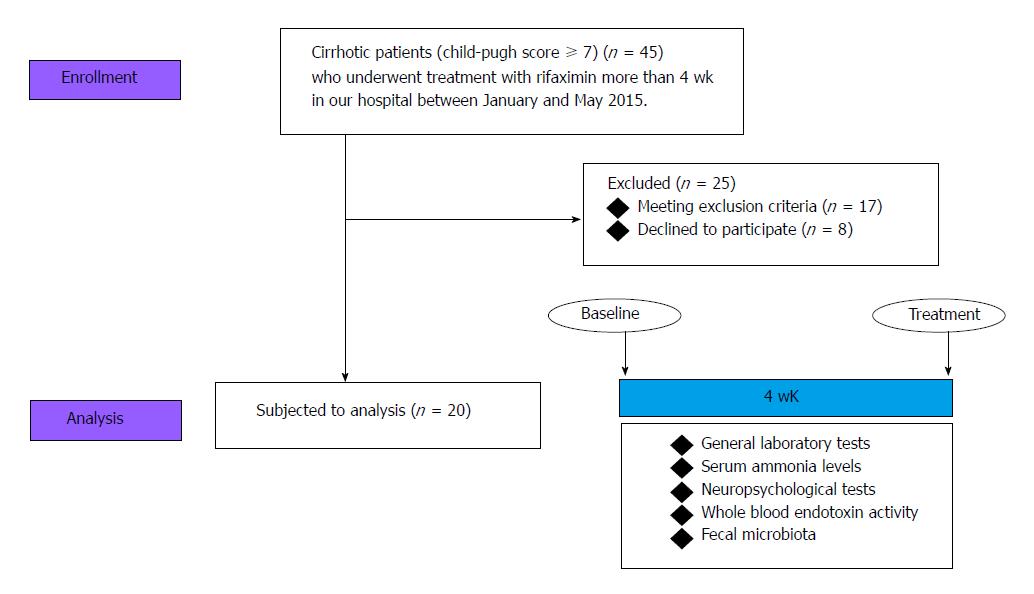
Figure 1 The selection of the study population and experimental design.
20 patients except for 25 patients to meet the exclusion criteria and decline to participate were finally analyzed.
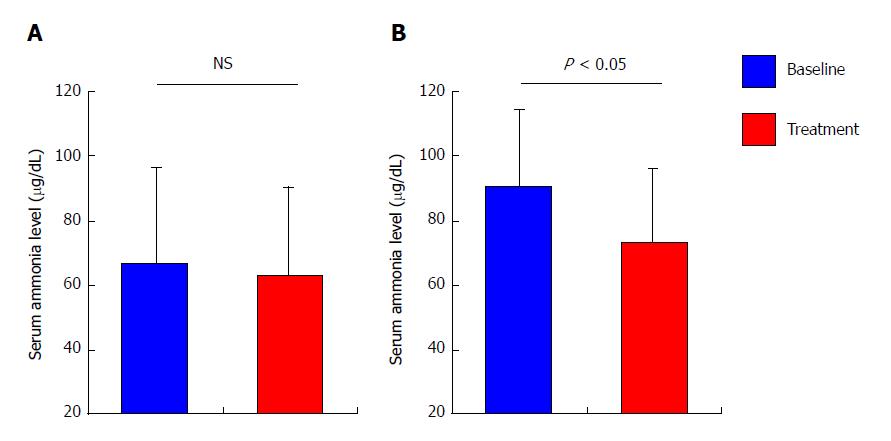
Figure 2 Effect of rifaximin on serum ammonia level.
Comparison of the mean levels of serum ammonia between baseline and 4 wk post-rifaximin among (A) total patients (n = 20) and (B) the patients who showed high levels of serum ammonia (> 70 μg/dL) at baseline (n = 16). Data are means ± SD.
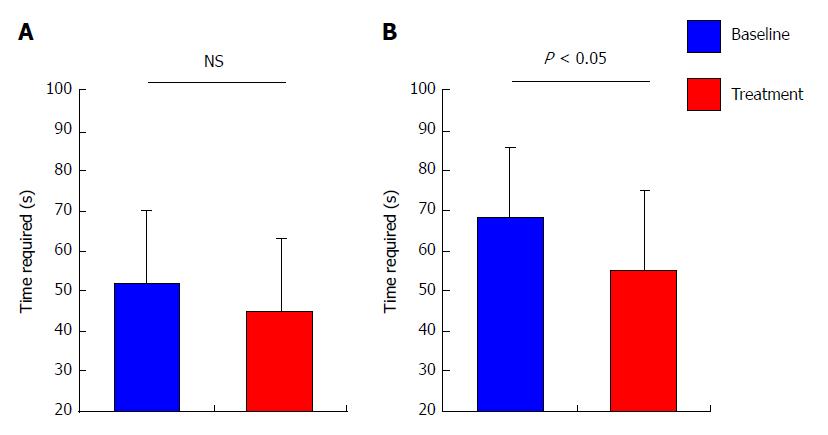
Figure 3 Effect of rifaximin on cognitive disturbance.
Comparison of the mean time required for NCT between baseline and 4 wk post-rifaximin among (A) total patients (n =20) and (B) the patients who showed prolongation for NCT (> 50 s) at baseline (n = 10). Data are means ± SD.
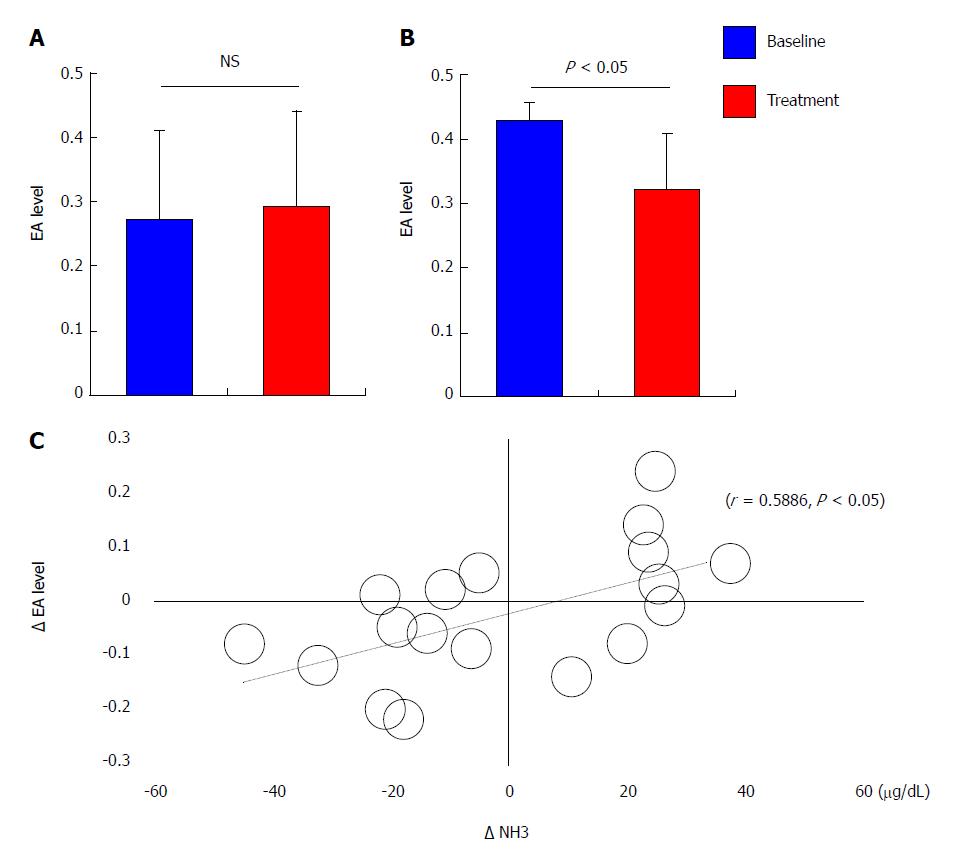
Figure 4 Effect of rifaximin on endotoxin activity.
Comparison of the endotoxin activities between baseline and 4 wk post-rifaximin among (A) total patients (n = 20) and (B) the patients who showed high levels of EA (> 0.4) at baseline (n = 11). C: Univariate correlation analysis between the decrease in EA level (Δ EA) and that in serum ammonia level (Δ NH3) by treatment with rifaximin (r = 0.5886, P < 0.05). Data are means ± SD.
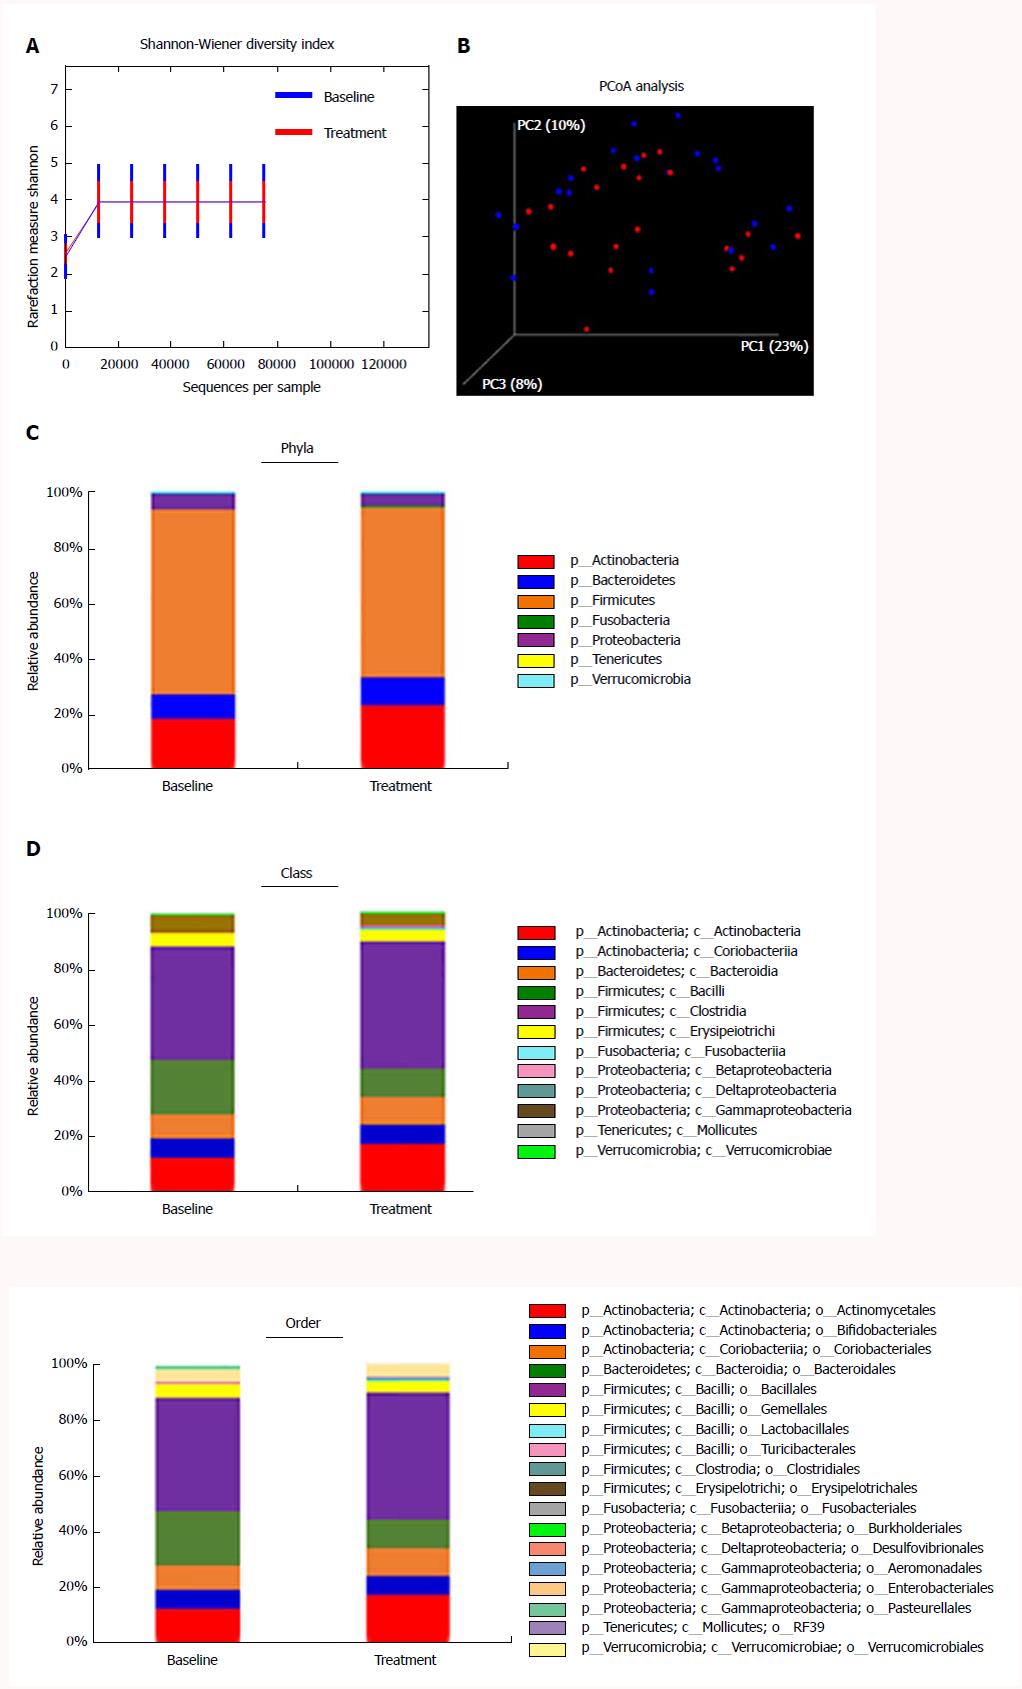
Figure 5 Effect of rifaximin on the diversity and major compositions of gut microbiome.
A: Shannon diversity between baseline and treatment groups (mean index ± SD 3.948 ± 0.548 at baseline vs 3.980 ± 0.968 at treatment, P = 0.544). B: Pco analysis (PcoA) of gut microbiota. Baseline samples (blue) were clustered together compared to 4 wk post-rifaximin (red). C-E: Effects of rifaximin on alterations in the composition of gut microbiome in phylum (C), class (D) and order (E).
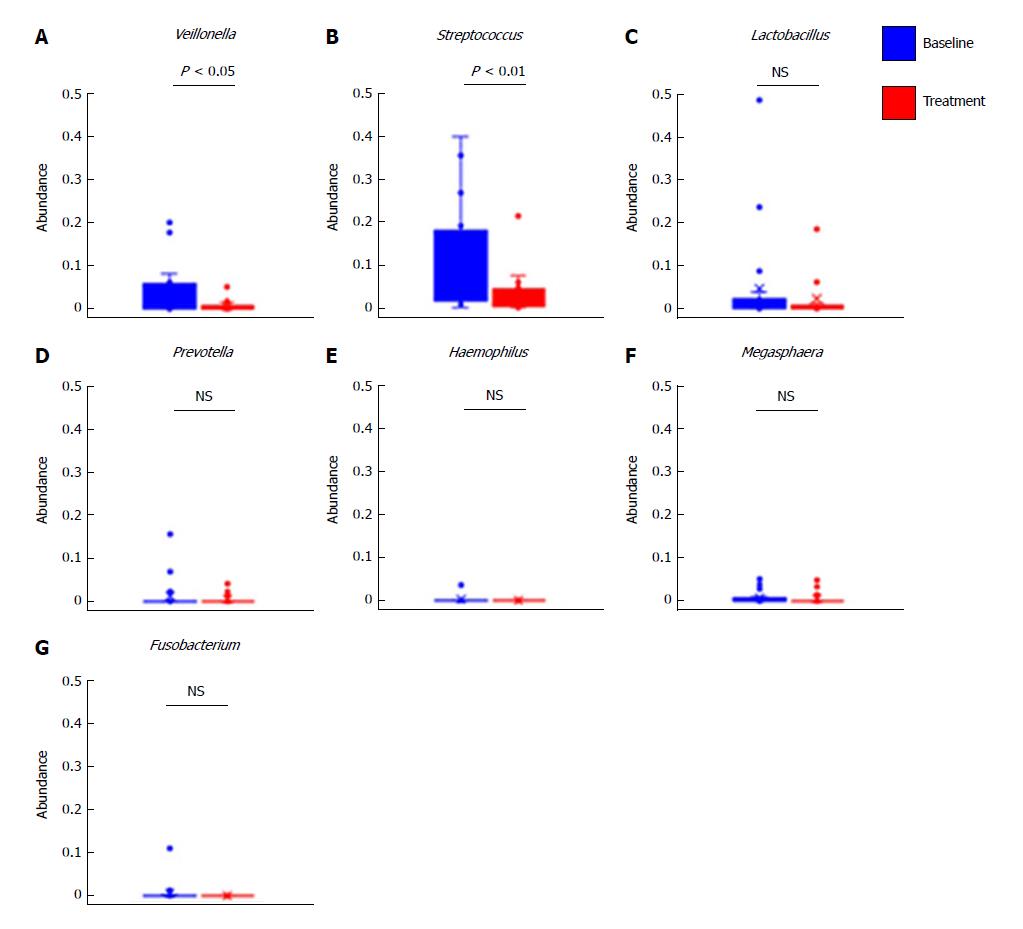
Figure 6 Alterations in abundances of selected genera by treatment with rifaximin.
Relative abundances of (A) Veillonella, (B) Streptococcus, (C) Lactobacillus, (D) Prevotella, (E) Haemophilus, (F) Megaspaera and (G) Fusobacterium. Data are means ± SD.
- Citation: Kaji K, Takaya H, Saikawa S, Furukawa M, Sato S, Kawaratani H, Kitade M, Moriya K, Namisaki T, Akahane T, Mitoro A, Yoshiji H. Rifaximin ameliorates hepatic encephalopathy and endotoxemia without affecting the gut microbiome diversity. World J Gastroenterol 2017; 23(47): 8355-8366
- URL: https://www.wjgnet.com/1007-9327/full/v23/i47/8355.htm
- DOI: https://dx.doi.org/10.3748/wjg.v23.i47.8355


