Copyright
©The Author(s) 2017.
World J Gastroenterol. Dec 14, 2017; 23(46): 8217-8226
Published online Dec 14, 2017. doi: 10.3748/wjg.v23.i46.8217
Published online Dec 14, 2017. doi: 10.3748/wjg.v23.i46.8217
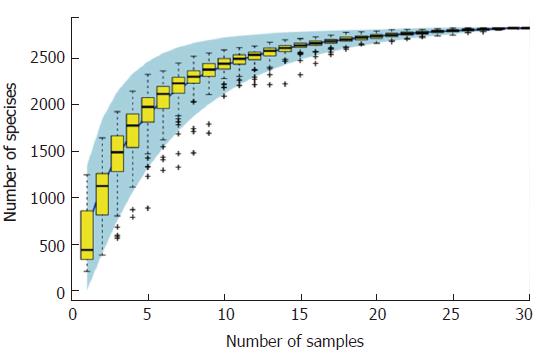
Figure 1 Species accumulation curve.
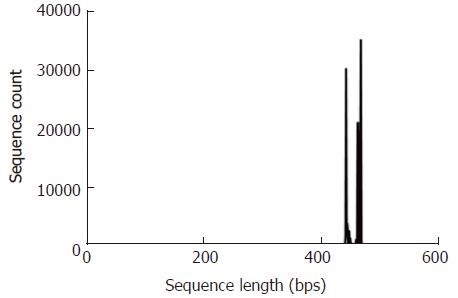
Figure 2 The distribution of sequence length of all patients.
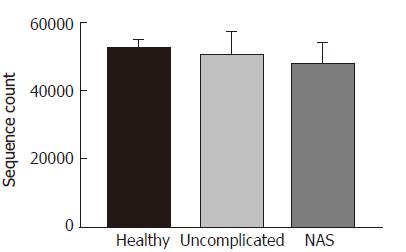
Figure 3 Sequence number in the three groups.
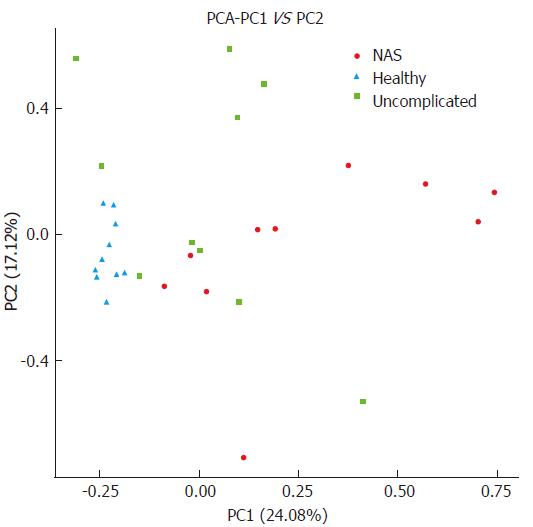
Figure 4 Principal component analysis.
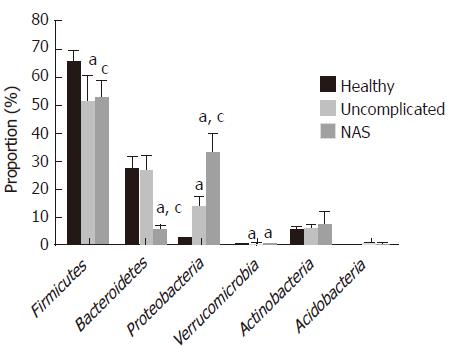
Figure 5 Distribution of bacteria at different phyla.
aP < 0.05 vs healthy controls group; cP < 0.05 vs uncomplicated group.
- Citation: Zhang J, Ren FG, Liu P, Zhang HK, Zhu HY, Feng Z, Zhang XF, Wang B, Liu XM, Zhang XG, Wu RQ, Lv Y. Characteristics of fecal microbial communities in patients with non-anastomotic biliary strictures after liver transplantation. World J Gastroenterol 2017; 23(46): 8217-8226
- URL: https://www.wjgnet.com/1007-9327/full/v23/i46/8217.htm
- DOI: https://dx.doi.org/10.3748/wjg.v23.i46.8217


