Copyright
©The Author(s) 2017.
World J Gastroenterol. Dec 14, 2017; 23(46): 8152-8168
Published online Dec 14, 2017. doi: 10.3748/wjg.v23.i46.8152
Published online Dec 14, 2017. doi: 10.3748/wjg.v23.i46.8152
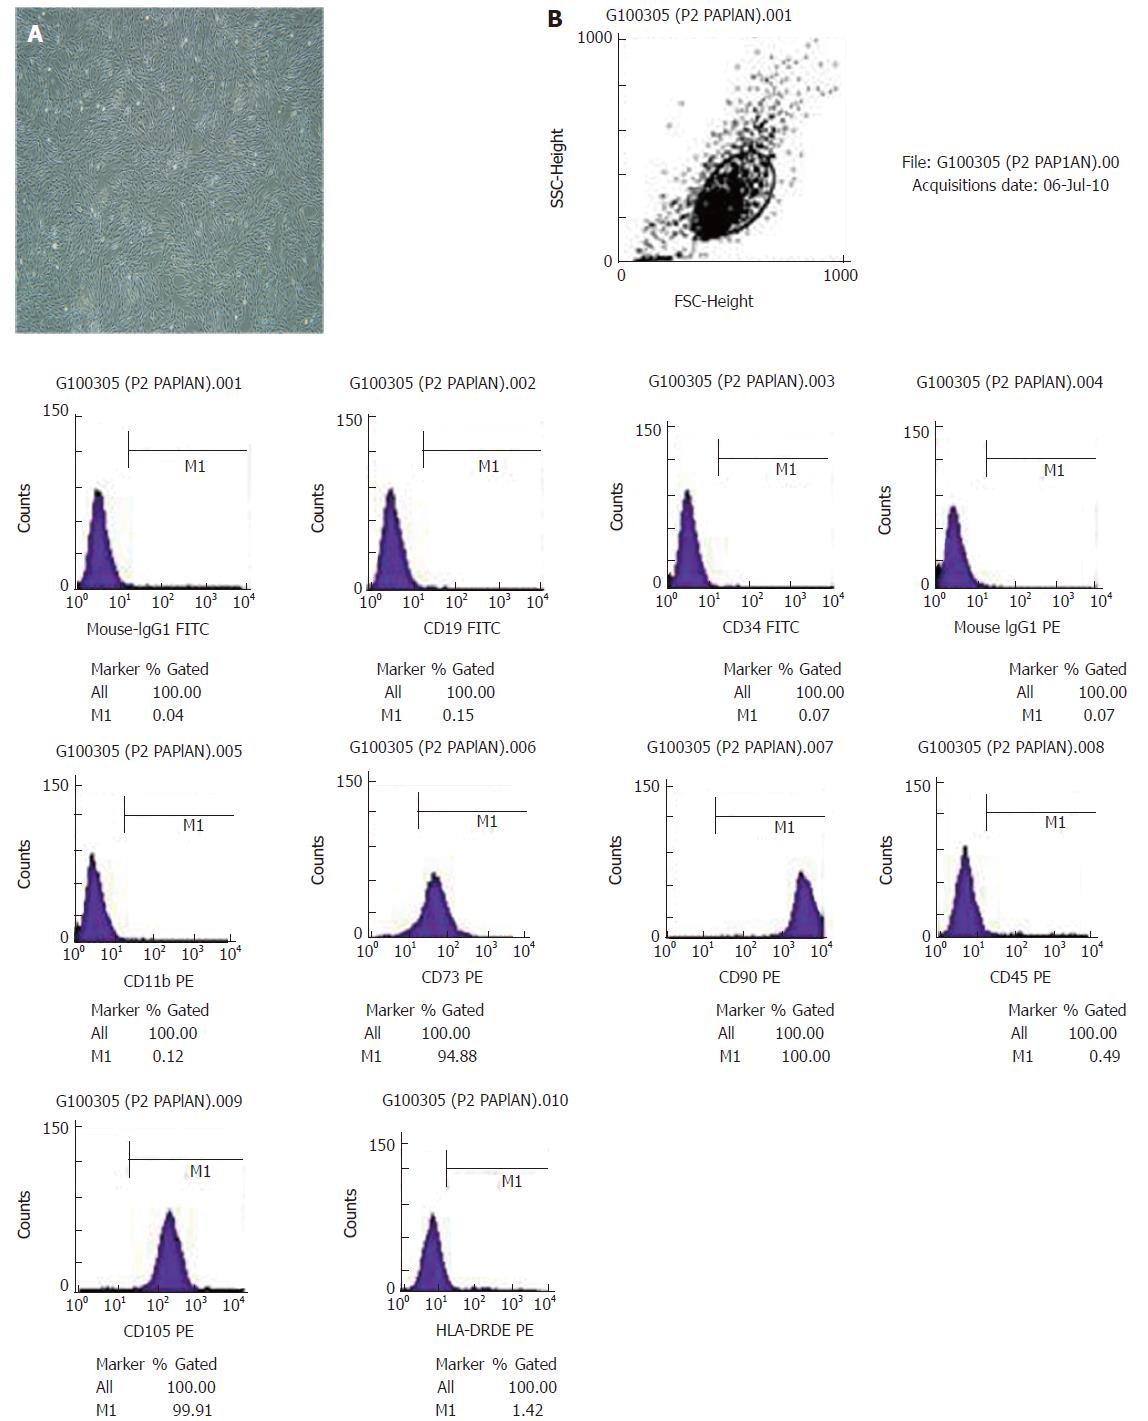
Figure 1 Morphology of umbilical cord-derived mesenchymal stem cells and immunophenotype analysis using FACS.
A: The morphology of umbilical cord-derived mesenchymal stem cells (UC-MSCs) (× 100); B: Immunophenotype analysis using FACS. The 3rd passage hUC-MSCs are shown, and the adherent cells displayed a fibroblastic morphology. Immunophenotype analysis using FACS showed that hUC-MSCs were positive for the human MSC-specific markers CD90, CD105 and CD73 but were negative for CD34, CD19, CD11b, HLA-DR and CD45.
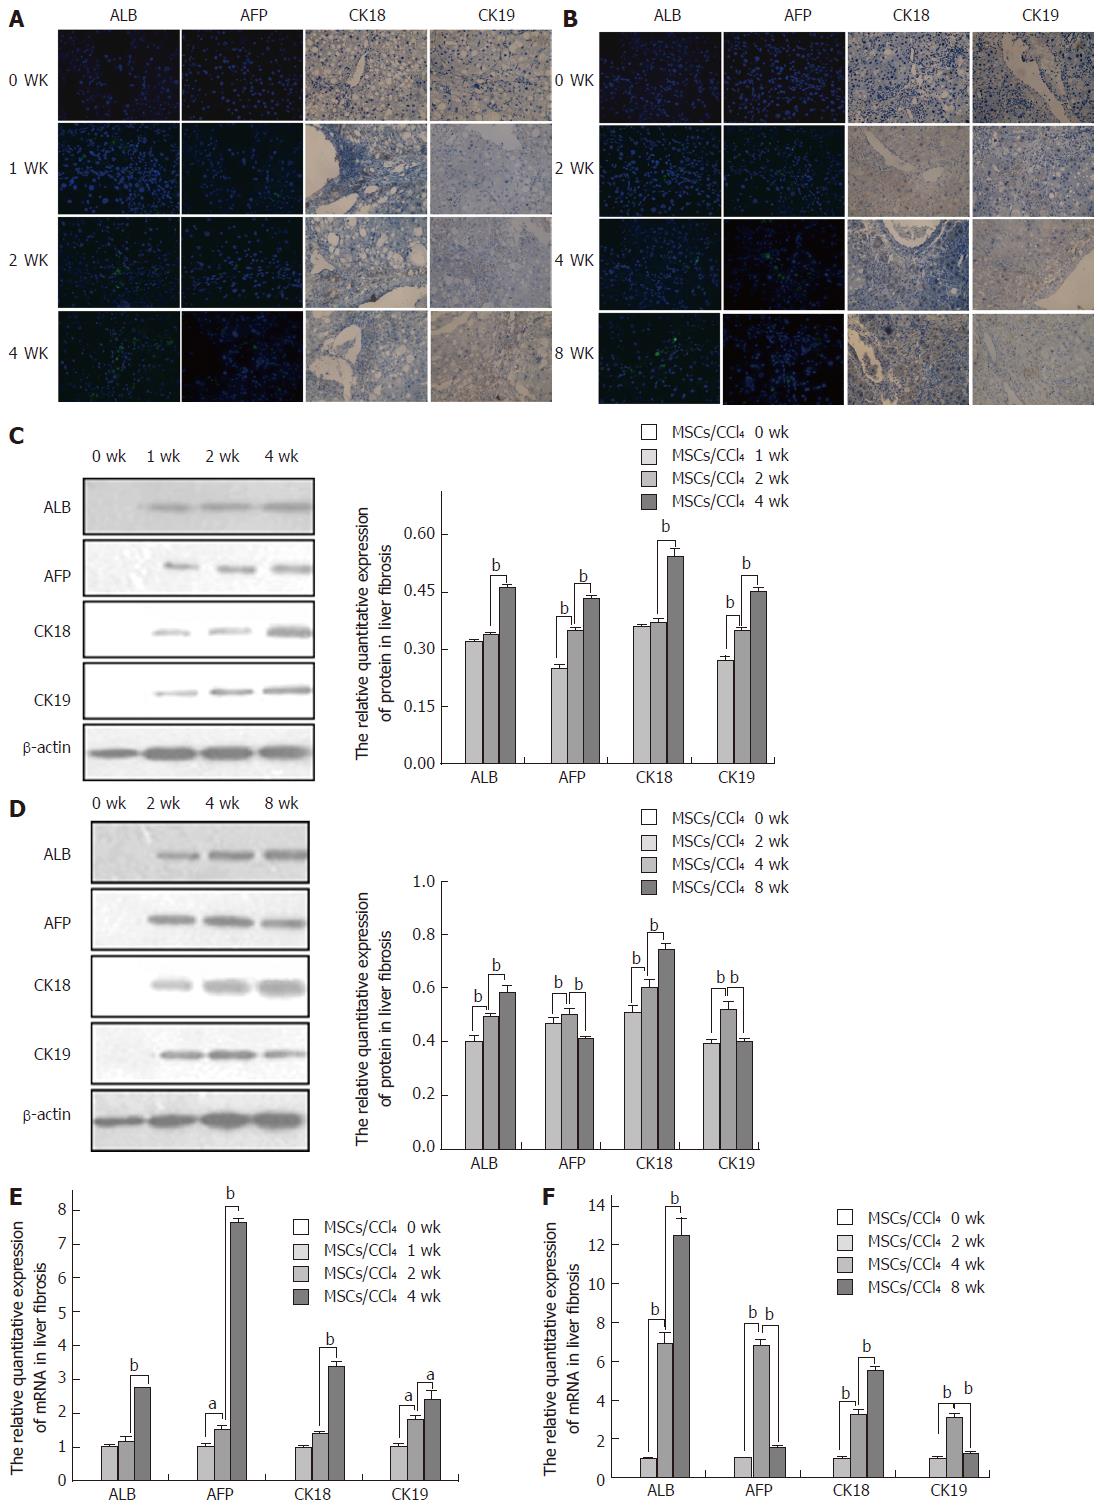
Figure 2 Expression of human hepatic markers in rat liver tissues.
A, C, and E: Immunohistochemical, Western blot, and real-time PCR analysis of human albumin (ALB), α-fetoprotein (AFP), CK18, and CK19 in rat fibrotic livers at 0, 1, 2, and 4 wk after human umbilical cord-derived mesenchymal stem cell (hUC-MSC) transplantation, respectively; B, D, and F: Immunohistochemical, Western blot, and real-time PCR analysis of human ALB, AFP, CK18, or CK19 in rat cirrhotic livers at 0, 2, 4, and 8 wk after hUC-MSC transplantation, respectively, aP < 0.05; bP < 0.01.
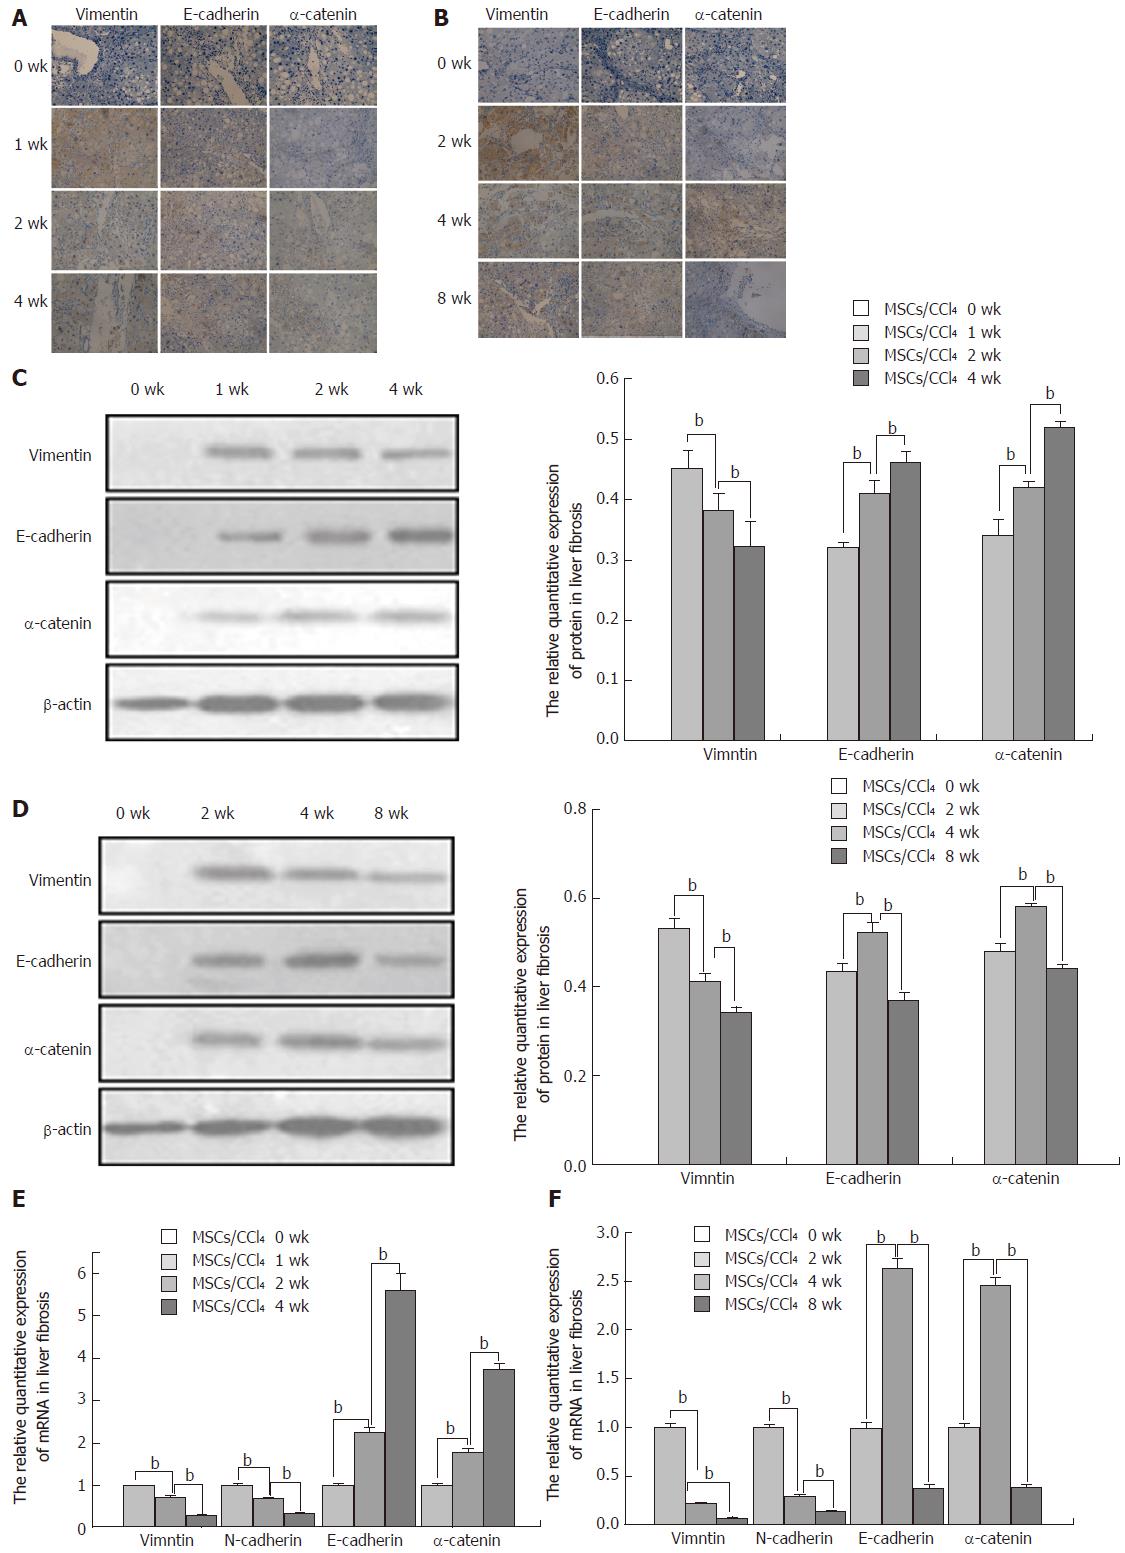
Figure 3 Expression of human vimentin, a mesenchymal marker, and human E-cadherin and α-catenin, epithelial markers, in rat liver tissues.
A, C, and E: Immunohistochemical, Western blot, and real-time PCR analysis of human vimentin, E-cadherin and α-catenin in rat fibrotic livers at 0, 1, 2, and 4 wk after human umbilical cord-derived mesenchymal stem cell (hUC-MSC) transplantation, respectively; B, D, and F: Immunohistochemical, Western blot, and real-time PCR analysis of human vimentin, E-cadherin and α-catenin in rat cirrhotic livers at 0, 2, 4, and 8 wk after hUC-MSC transplantation, respectively, bP < 0.01.
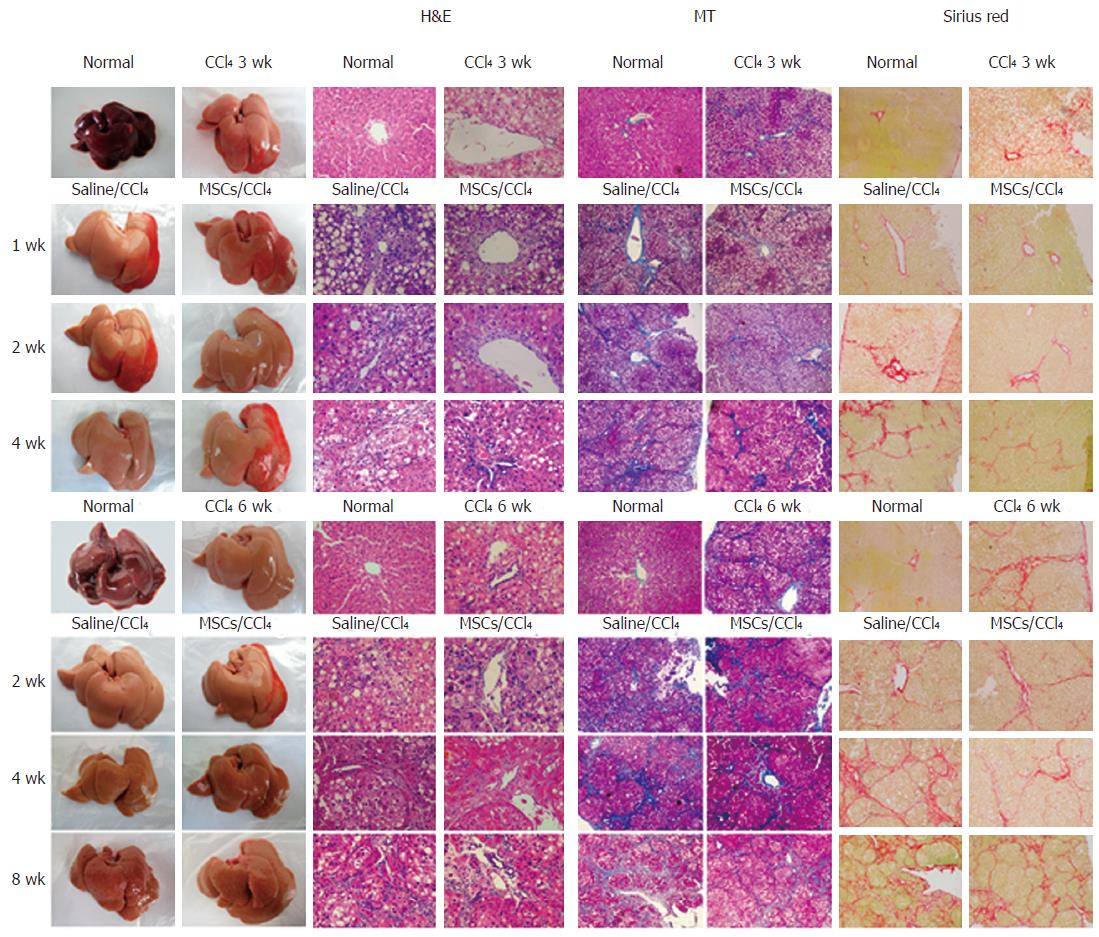
Figure 4 Representative photographs of the fresh livers, hematoxylin and eosin staining (H&E staining), Masson's trichrome staining (MT staining) and sirius red staining in rat fibrotic or cirrhotic hepatic tissues.
Liver sections were stained with hematoxylin and eosin (H&E, ×400), Masson's trichrome (MT, ×100) and Sirius red (×100) or representative photographs of the fresh livers without fixation were used to evaluate histopathological changes for liver tissues in control conditions; with CCl4 for 3 wk; or with 1, 2, and 4 wk in fibrotic rat tissues; with CCl4 for 6 wk; or with 2, 4, and 8 wk in cirrhotic rat tissues after human umbilical cord-derived mesenchymal stem cell (hUC-MSC) or saline injection into rats.
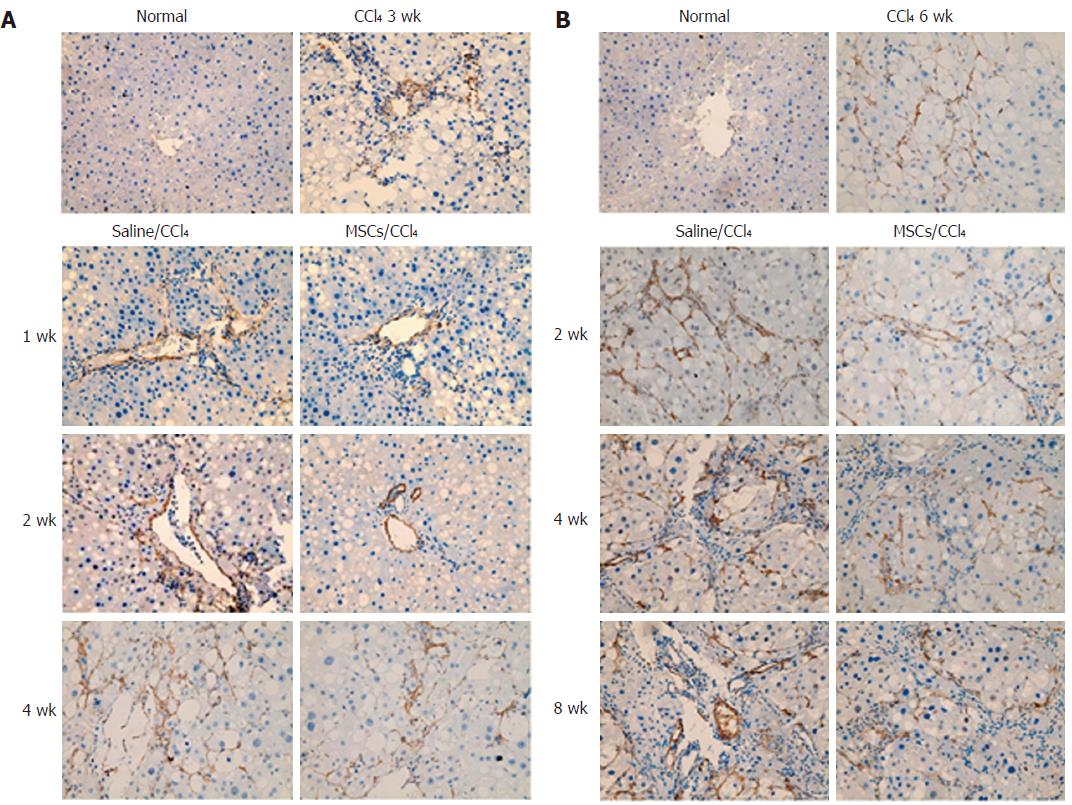
Figure 5 Immunohistochemcial staining for α-smooth muscle actin in hepatic fibrosis and cirrhosis groups (× 400).
A: Immunohistochemcial staining for α-smooth muscle actin (α-SMA) in hepatic fibrosis groups; B: Immunohistochemcial staining for α-SMA in hepatic cirrhosis groups. In normal rat liver, α-SMA was occasionally detected in vascular smooth muscle cells, and the expression level was low, revealing few activated hepatic stellate cells (HSCs). After CCl4 administration, the α-SMA spread to the portal area, showing more activated HSCs. The expression of α-SMA in liver tissues increased significantly in the saline infusion group compared with the normal group. Compared with the saline infusion groups, they significantly decreased in the MSC transplantation groups.
Figure 6 Changes of collagen I and III in the liver fibrosis and cirrhosis groups.
A, C, and E: Immunohistochemical, Western blot, and real-time PCR analysis of collagen I and III in fibrotic livers, respectively, in normal rats, rats at 3 wk after CCl4 treatment, and rats at 1, 2, or 4 wk after human umbilical cord-derived mesenchymal stem cells (hUC-MSCs) transplantation; B, D, and F: Immunohistochemical, Western blot, and real-time PCR analysis of collagen I and III in cirrhotic livers, respectively, in normal rats; rats at 6 wk after CCl4 treatment; and rats at 2, 4, or 8 wk after hUC-MSC transplantation.
Figure 7 Expression of MMP-13 and TIMP-1 in the liver fibrosis or cirrhosis groups.
A, C, and E: Immunohistochemical, Western blot, and real-time PCR analysis of MMP-13 and TIMP-1 in rat fibrotic livers, respectively, in normal rats; rats at 3 wk after CCl4 treatment; and rats at 1, 2, or 4 wk after human umbilical cord-derived mesenchymal stem cell (hUC-MSC) transplantation; B, D, and F: Immunohistochemical, Western blot, and real-time PCR analysis of MMP-13 and TIMP-1 in rat cirrhotic livers, respectively, in normal rats; rats at 6 wk after CCl4 treatment; and rats at 2, 4, or 8 wk after hUC-MSC transplantation.
- Citation: Zhang GZ, Sun HC, Zheng LB, Guo JB, Zhang XL. In vivo hepatic differentiation potential of human umbilical cord-derived mesenchymal stem cells: Therapeutic effect on liver fibrosis/cirrhosis. World J Gastroenterol 2017; 23(46): 8152-8168
- URL: https://www.wjgnet.com/1007-9327/full/v23/i46/8152.htm
- DOI: https://dx.doi.org/10.3748/wjg.v23.i46.8152


