Copyright
©The Author(s) 2017.
World J Gastroenterol. Dec 7, 2017; 23(45): 8097-8103
Published online Dec 7, 2017. doi: 10.3748/wjg.v23.i45.8097
Published online Dec 7, 2017. doi: 10.3748/wjg.v23.i45.8097
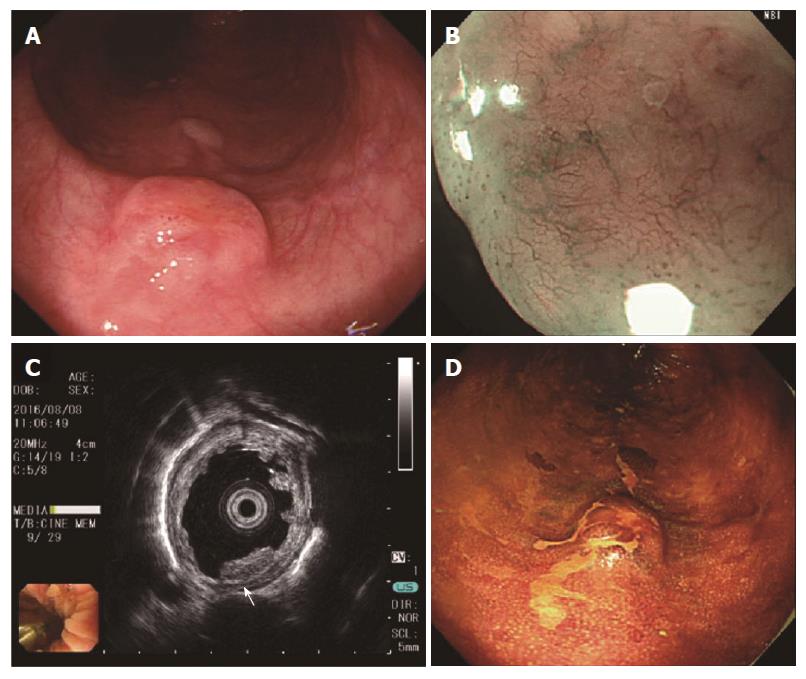
Figure 1 Preoperative endoscopy.
A: Normal white light; B: Narrow band imaging with magnification; C: Endoscopic ultrasound, showing a tumor that was hypoechoic and homogeneous with a thickened hyperechoic submucosa slight irregularity of the third layer (white arrow); D: Lugol’s solution application.
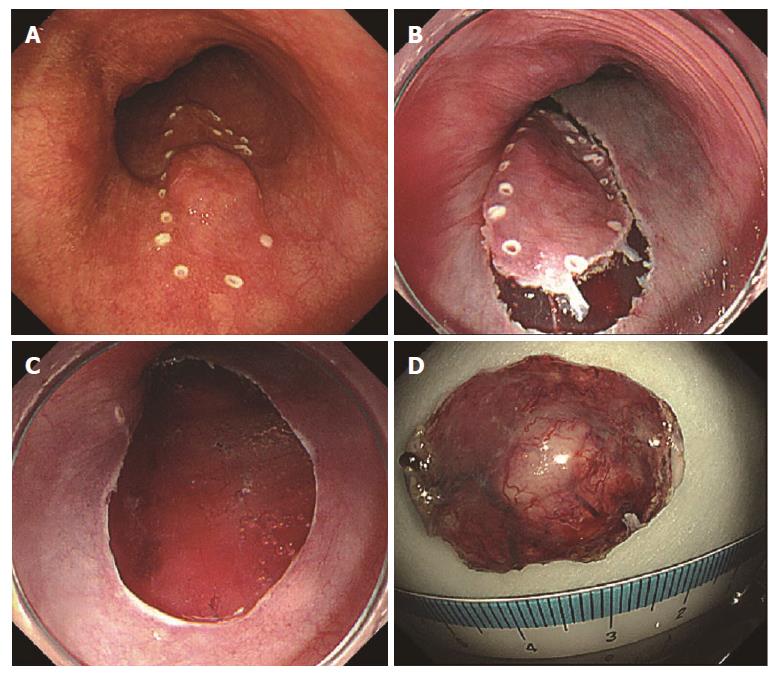
Figure 2 Intraoperative endoscopy.
A: Marking of lesion; B: Incision of lesion perimeter; C: Resected surface after excision; D: Excised specimen.
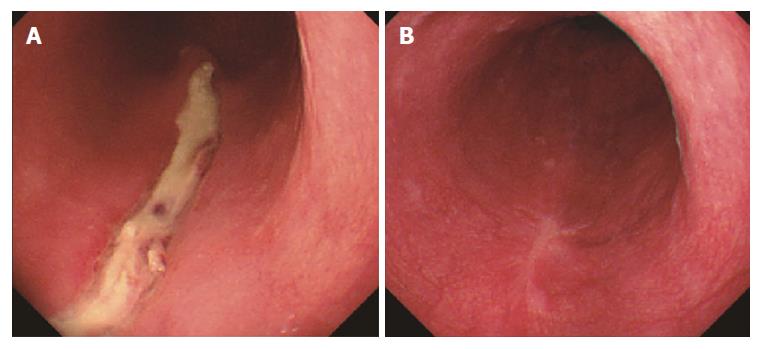
Figure 3 Postoperative endoscopy.
A: 2 d postoperatively; B: 6 mo postoperatively.
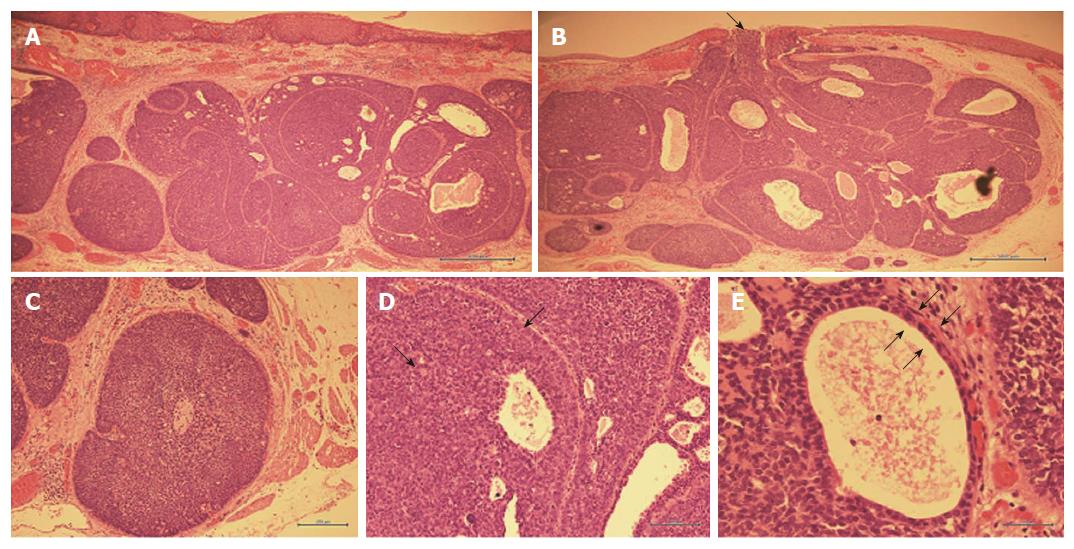
Figure 4 Hematoxylin and eosin staining of the resected specimen.
A: Main locus of submucosal tumor (× 40); B: Tumor protrusion into esophageal lumen (black arrows, × 40); C: Cribriform structure of tumor cells (× 100); D: Heterotypic cells with eosinophilic cytoplasm (black arrows, × 200); E: Bi-layered structure of tumor duct cells (black arrows, × 400).
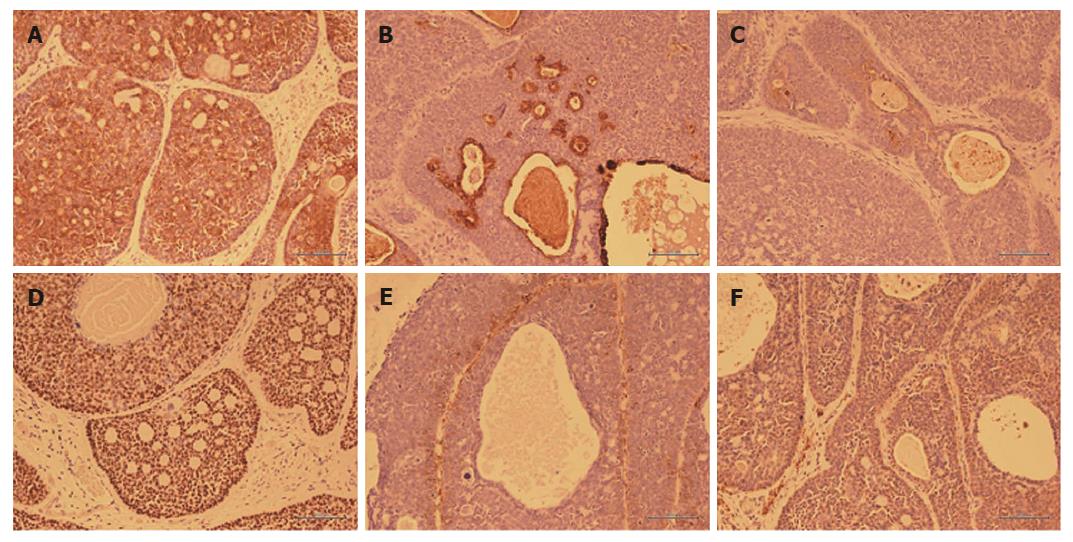
Figure 5 Immunostaining of resected specimen.
A: Cytokeratin CAM 5.2 staining (× 200); B: Epithelial membrane antigen staining (× 200); C: Carcinoembryonic antigen staining (× 200); D: p63 staining (× 200); E: Alpha-smooth muscle actin staining (× 200); F: Calponin staining (× 200).
- Citation: Yoshikawa K, Kinoshita A, Hirose Y, Shibata K, Akasu T, Hagiwara N, Yokota T, Imai N, Iwaku A, Kobayashi G, Kobayashi H, Fushiya N, Kijima H, Koike K, Kaneyama H, Ikeda K, Saruta M. Endoscopic submucosal dissection in a patient with esophageal adenoid cystic carcinoma. World J Gastroenterol 2017; 23(45): 8097-8103
- URL: https://www.wjgnet.com/1007-9327/full/v23/i45/8097.htm
- DOI: https://dx.doi.org/10.3748/wjg.v23.i45.8097


