Copyright
©The Author(s) 2017.
World J Gastroenterol. Dec 7, 2017; 23(45): 7989-7999
Published online Dec 7, 2017. doi: 10.3748/wjg.v23.i45.7989
Published online Dec 7, 2017. doi: 10.3748/wjg.v23.i45.7989
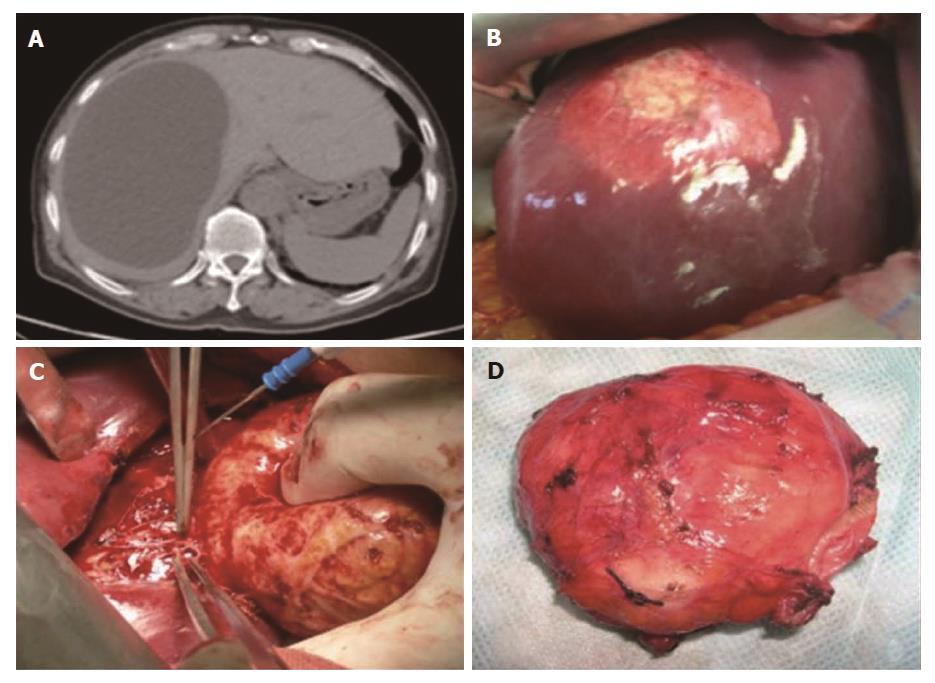
Figure 1 Echinococcus granulosus protoscolex collection.
The protoscolices were collected from patients with hepatic hydatid cysts. A: Type I hydatid cyst (WHO classification) presents as a well-defined unilocular and fluid attenuation lesion in the liver; B: The single cyst appearance during an open surgery; C: The complete removal of the hydatid cyst from the liver; D: The hydatid cyst is full of protoscolices.
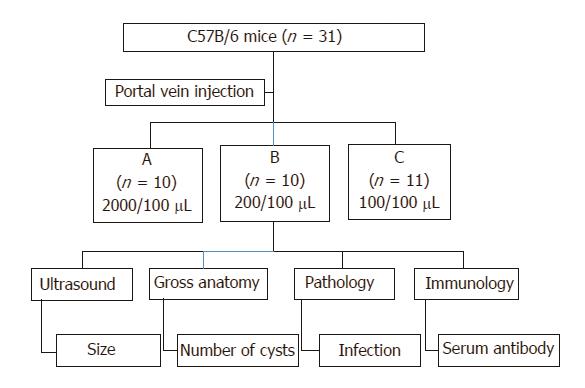
Figure 2 Experiment design and follow-up plan.
Three different concentrations were prepared for a parallel experiment design with long-term follow-up: group A (2000 protoscolices/100 μL), group B (200 protoscolices/100 μL), and group C (100 protoscolices/100 μL). After injection, the hydatid cyst formation, location, distribution, and size, pathology, and immunology were followed regularly till the 10th month post injection.
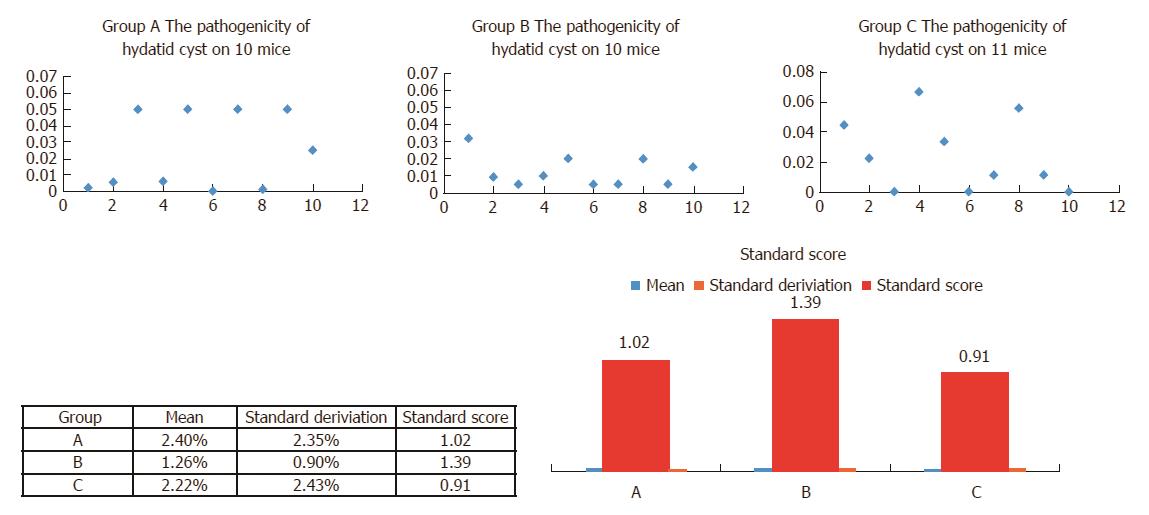
Figure 3 Pathogenicity and efficiency evaluated by cyst per protoscolex.
After 6 mo when the hydatid cysts fully developed in the mouse liver, the injection efficiency was evaluated by two markers: The pathogenicity (cyst number per protoscolex) and hydatid cyst number per mouse.
Figure 4 Injection concertation optimization by standard score.
The standard score was used in this study to compare the reliability and efficiency of animal models. The normal distribution of groups A, B, and C is shown in upper panel. A standard score of 1.39 of group B indicates that its performance was better compared with groups A (1.02) and C (0.91).
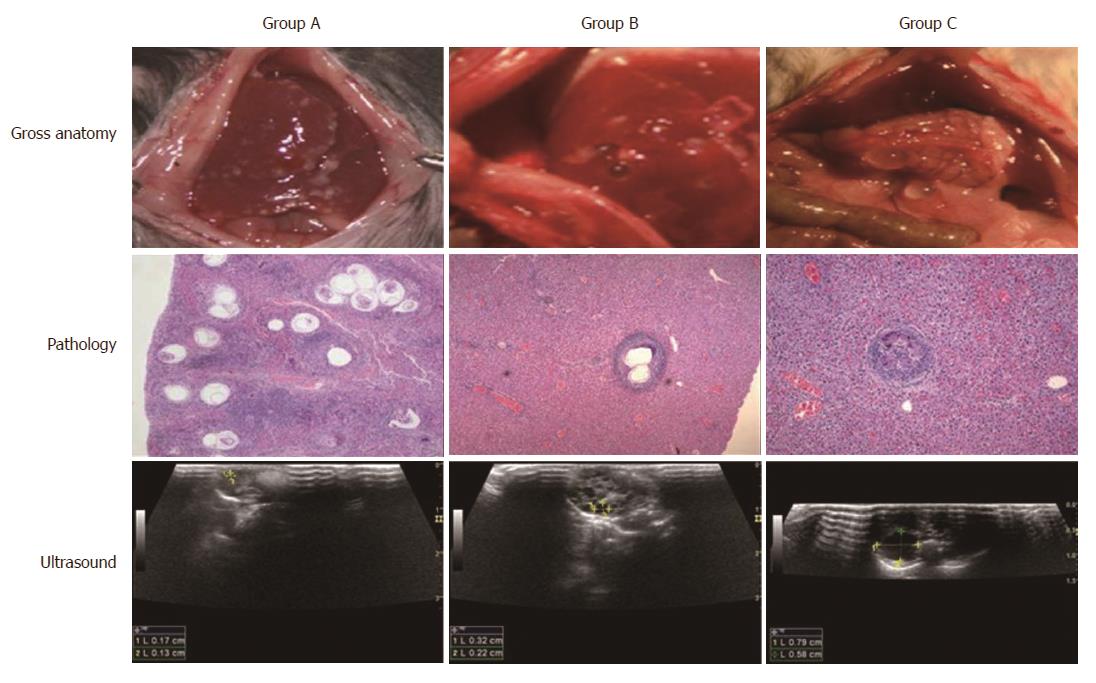
Figure 5 Migration of the protoscolices in the portal vein and liver.
The path and course of the protoscolex migration in the portal vein and liver were tracked by open examination, pathology, and ultrasound. When the human Echinococcus granulosus protoscolices were injected, they travelled from small branches of the portal vein to the liver with the blood flow, causing inflammatory cell infiltration. When the hydatid cyst formed, the infected liver presented the infection zone around the parasite lesion. The open examination showed the distribution and cyst abundance in the livers of groups A, B, and C. After 4 mo, ultrasound detected spherical, fibrous rimmed cyst with surrounding host reaction. After 6 mo, the even larger parent cyst with satellite daughter cysts within or outside the parent cyst was found.
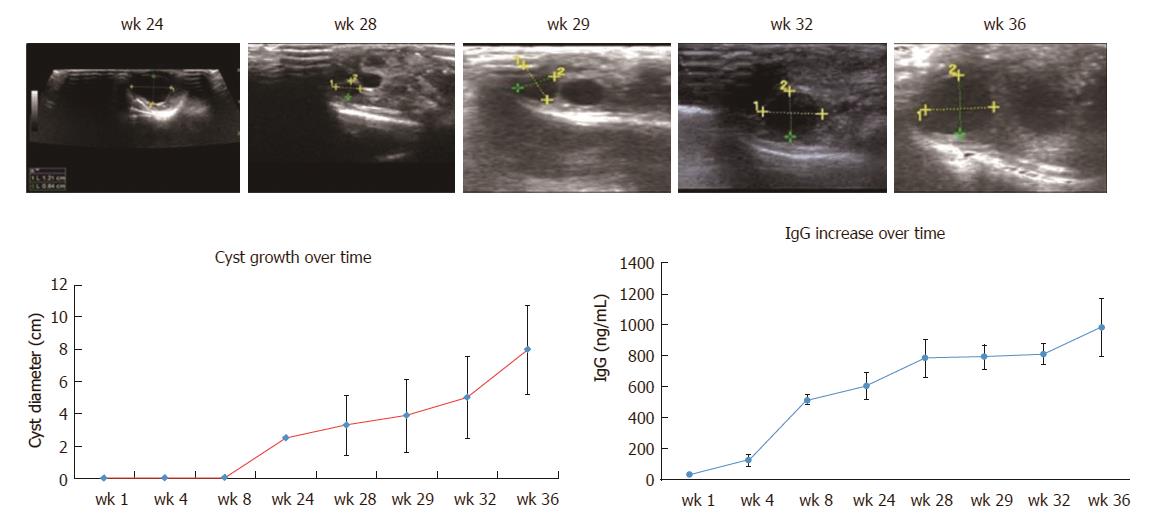
Figure 6 Hydatid cyst growing dynamics measured by ultrasound and accompanied IgG increase.
Ultrasound measured the detectable hydatid cysts after 4 mo. After 6 mo, the hydatid cysts were fully developed and stimulated strong host immune reaction marked by IgG increase.
Figure 7 Pathological images of mouse liver injected with 200 protoscolices at different time points.
0 d: On the same day of portal vein injection, the protoscolices congested the portal vein. 1 d: The injected protoscolice caused the dilatation of vessel sinusoids. The central vein size increased. 3 d: Those dead protoscolices ended up as focal degeneration; mouse liver reacted with increased diameter of central veins, inflammatory cell infiltration (blue stained), and collagen deposition (red stained). 1 wk: Mouse liver had protective immune reactions such as lymphocyte infiltration. The vessel fibrosis was found in biliary ducts and portal vein area. 3 wk: The newly developed hydatid cyst was found full of the germinal layer, the laminated layer, and the beginning of the adventitious layer. 6 wk: The mouse localized the hydatid cyst with compressed and fibrotic host tissue (HE staining, × 10).
- Citation: Zhang RQ, Chen XH, Wen H. Improved experimental model of hepatic cystic hydatid disease resembling natural infection route with stable growing dynamics and immune reaction. World J Gastroenterol 2017; 23(45): 7989-7999
- URL: https://www.wjgnet.com/1007-9327/full/v23/i45/7989.htm
- DOI: https://dx.doi.org/10.3748/wjg.v23.i45.7989


