Copyright
©The Author(s) 2017.
World J Gastroenterol. Dec 7, 2017; 23(45): 7978-7988
Published online Dec 7, 2017. doi: 10.3748/wjg.v23.i45.7978
Published online Dec 7, 2017. doi: 10.3748/wjg.v23.i45.7978
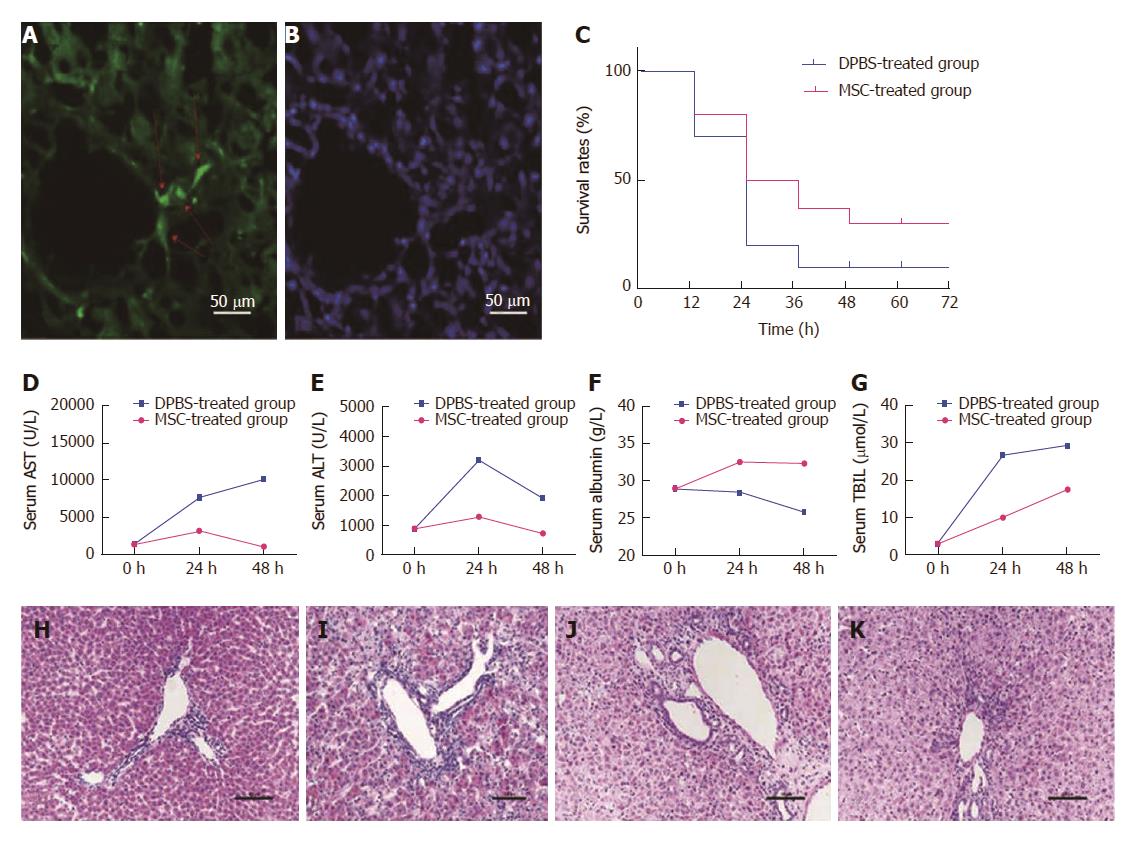
Figure 1 Survival rate and biochemical indicators in rats are improved after mesenchymal stem cell treatment.
Colonization of mesenchymal stem cells (MSCs) was observed in the liver (A and B). The red arrow on the left shows engraftment of MSCs and nuclear staining in the same slice. Survival rates were compared between the MSC-treated group and the DPBS-treated group at each time point (C) (P = 0.36). Serum samples collected at various times (0 h, 24 h, 48 h) after MSC treatment were analyzed for levels of ALT, AST, ALB, and TBIL and compared with the DPBS-treated group (D-G). HE staining of liver sections was performed in each group. Compared with the PBS-treated group (H), we observed necrosis of centrilobular hepatocytes, characterized by cell shrinkage and lost nuclei, interstitial hemorrhage, and inflammatory cell infiltration in the DPBS-treated group (I). Liver histomorphology at 48 h after MSC treatment (J) did not change significantly compared with the DPBS-treated group, but the number of hepatocytes with edema, shrinkage, and lost nuclei decreased significantly, with massive inflammatory cell infiltration and increased number of cells observed. The liver histomorphology was gradually repaired after 5 d (K).
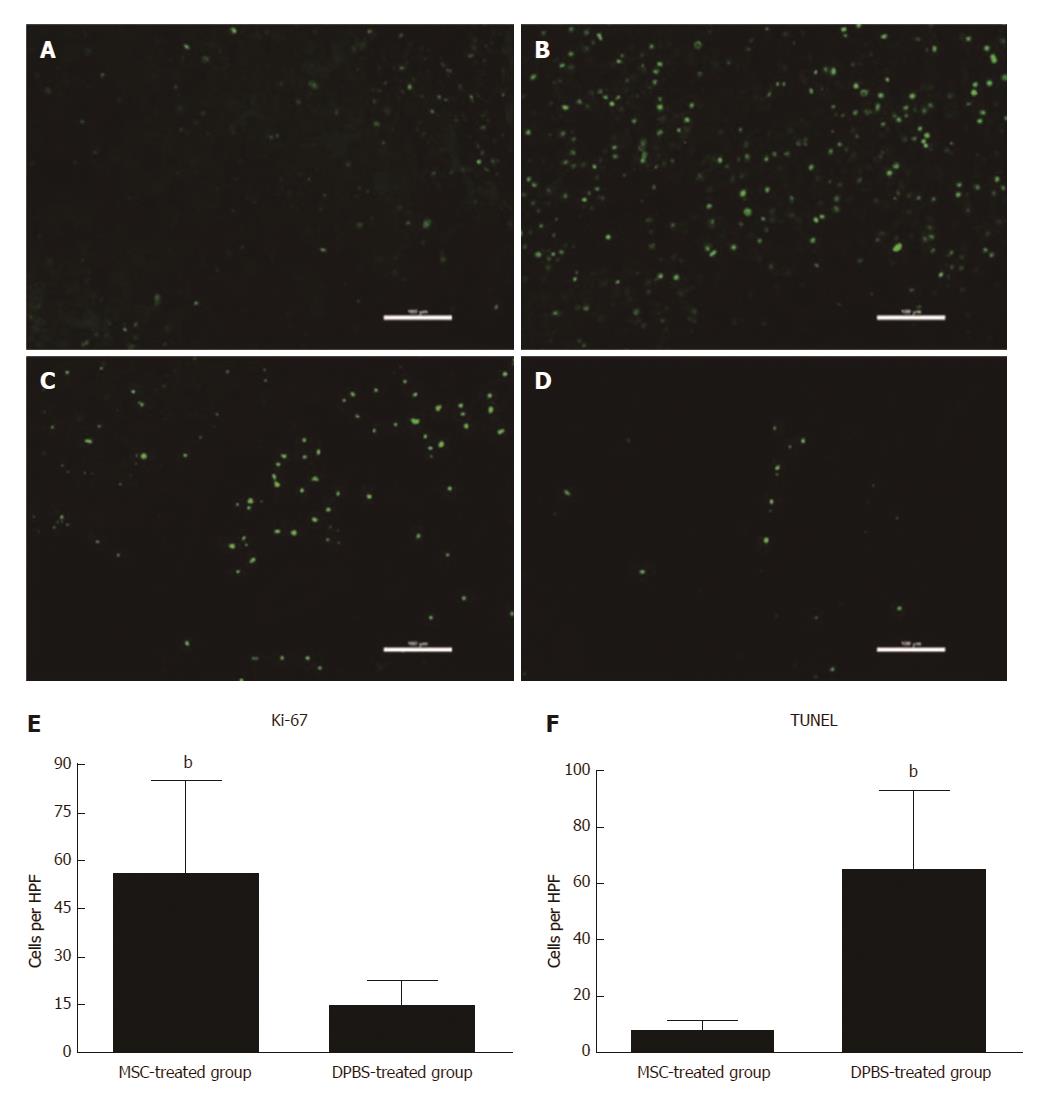
Figure 2 Assessment of hepatocyte apoptosis and proliferation after mesenchymal stem cell transplantation.
Immunofluorescence for Ki-67 (A and B) and terminal deoxyribonucleotide transferase (TdT)-mediated deoxyuridine triphosphate nick end labeling (TUNEL) (C and D) staining in MSC-treated and DPBS-treated livers. A and C: MSC-treated group; B and D: DPBS-treated group. The numbers of Ki-67-positive and TUNEL-positive hepatocytes were observed in the DPBS- and MSC-treated groups (E and F). Bar represents the mean ± SD. (n = 5, bP < 0.001). MSC: Mesenchymal stem cell.
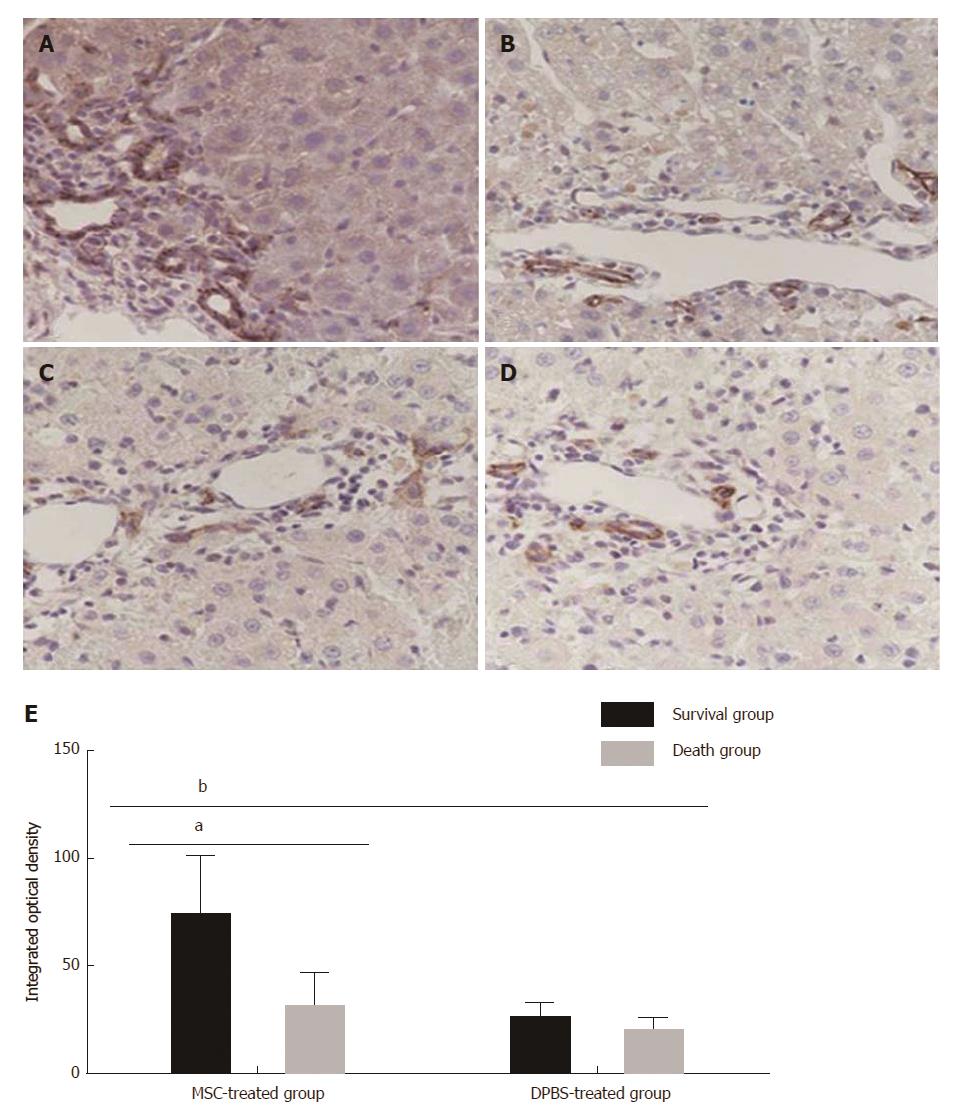
Figure 3 Immunohistochemical staining for epithelial cell adhesion molecule expression in each group.
A: Survival group after mesenchymal stem cell (MSC) treatment; B: Death group after MSC treatment; C: Survival group after DPBS treatment; D: Death group after DPBS treatment; E: Integrated optical density of immunohistochemical staining for EPCAM+ hepatocytes. Bar represents the mean ± SD (n = 5, aP < 0.05, bP < 0.001).
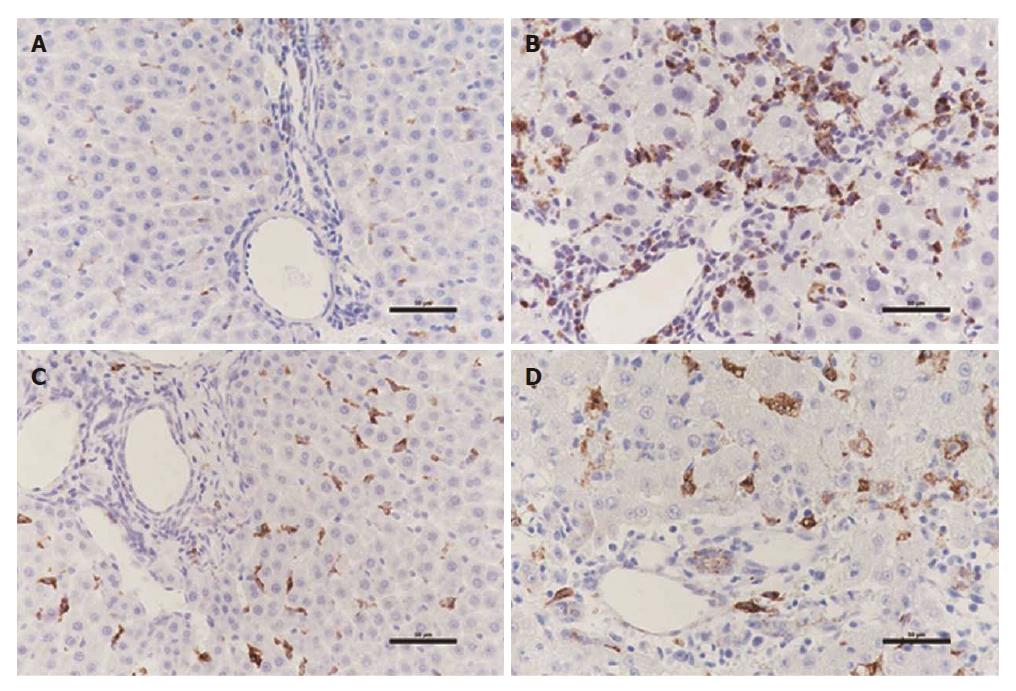
Figure 4 Immunohistochemistry for polarization of macrophages in liver tissue.
A: Distribution of macrophages reacting to CD68 for M1 in PBS-treated group; B: Distribution of macrophages reacting to CD68 for M1 in DGalN-treated group; C: Distribution of macrophages reacting to CD163 for M2 in PBS-treated group; D: Distribution of macrophages reacting to CD163 for M2 in DGalN-treated group (n = 4).
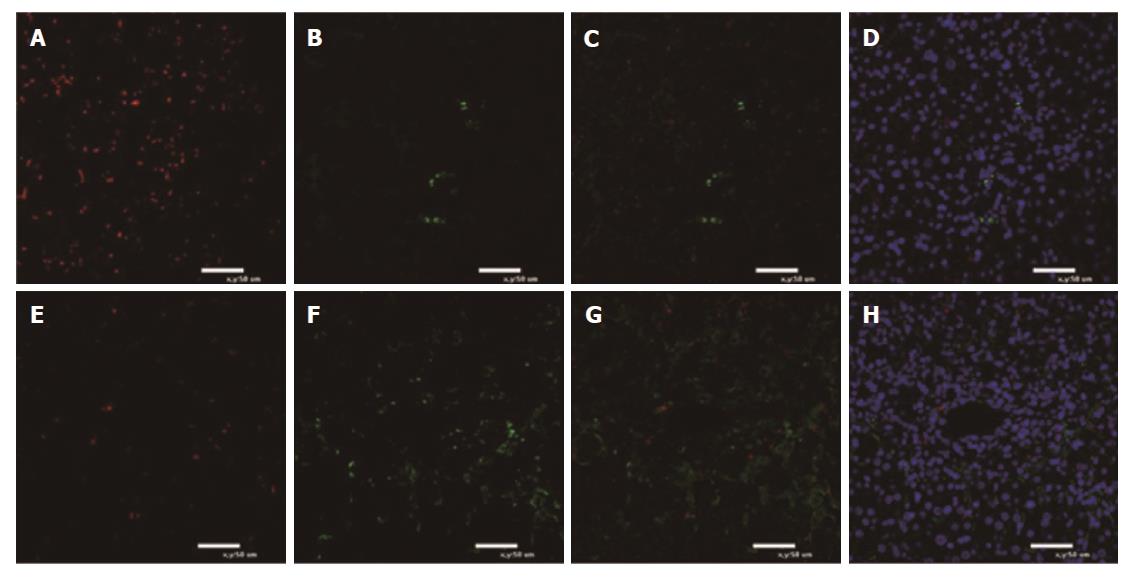
Figure 5 Immunofluorescence for polarization of macrophages in liver tissue.
A-D: Death group after mesenchymal stem cell (MSC) treatment; E-H: Survival group after MSC treatment. Green fluorescence indicates CD163+ macrophages. Red fluorescence indicates CD68+ macrophages. Nuclei are stained blue with DAPI. Immunofluorescence for M1 macrophages reacting to CD68 and M2 macrophages reacting to CD163 is shown (n = 5).
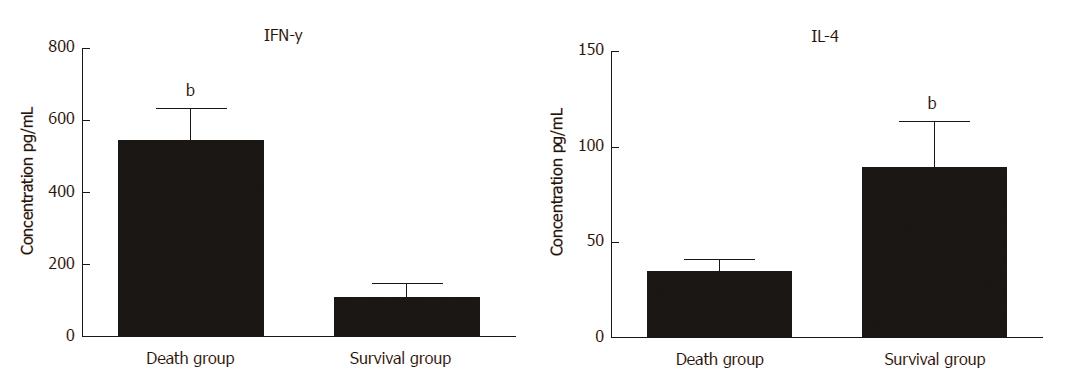
Figure 6 Flow cytometry analysis for serum levels of IFN-y and IL-4 in survival and death groups after mesenchymal stem cell treatment.
Bar represents the mean ± SD (n = 6, bP < 0.001).
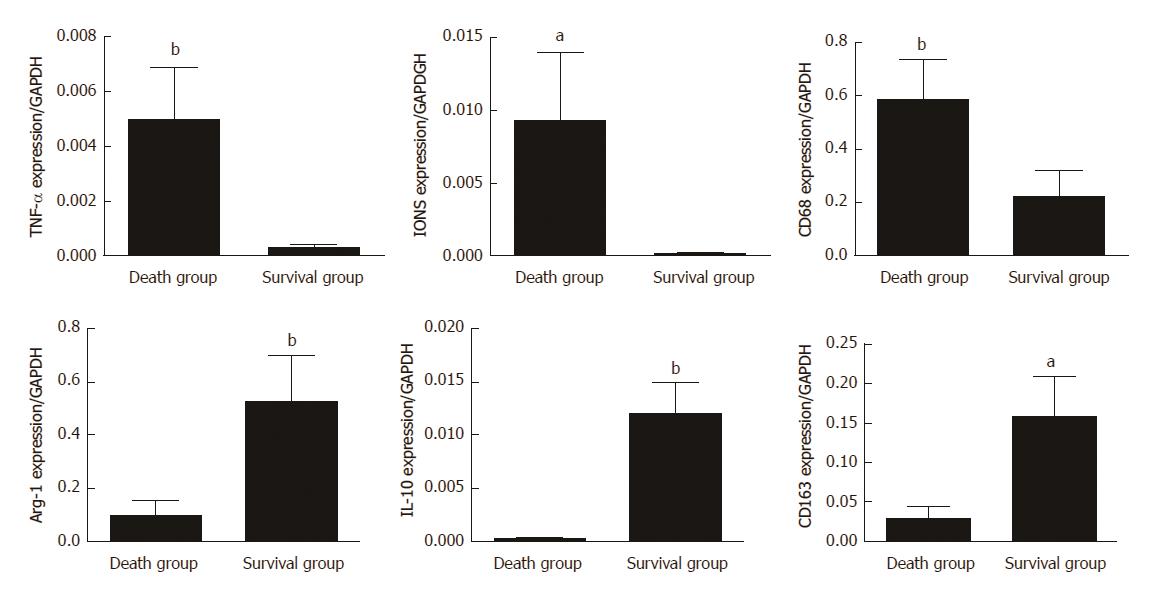
Figure 7 mRNA expression of M1- and M2-related factors in survival and death groups after mesenchymal stem cells treatment.
The mRNA expression of M1-related factors (TNF-α, INOS, and CD68) and M2-related factors (Arg-1, IL-10, and CD163) was detected in the total liver tissues of death group and survival group after MSC treatment. Bar represents the mean ± SD (n = 6, aP < 0.05, bP < 0.001).
- Citation: Li YW, Zhang C, Sheng QJ, Bai H, Ding Y, Dou XG. Mesenchymal stem cells rescue acute hepatic failure by polarizing M2 macrophages. World J Gastroenterol 2017; 23(45): 7978-7988
- URL: https://www.wjgnet.com/1007-9327/full/v23/i45/7978.htm
- DOI: https://dx.doi.org/10.3748/wjg.v23.i45.7978


