Copyright
©The Author(s) 2017.
World J Gastroenterol. Dec 7, 2017; 23(45): 7978-7988
Published online Dec 7, 2017. doi: 10.3748/wjg.v23.i45.7978
Published online Dec 7, 2017. doi: 10.3748/wjg.v23.i45.7978
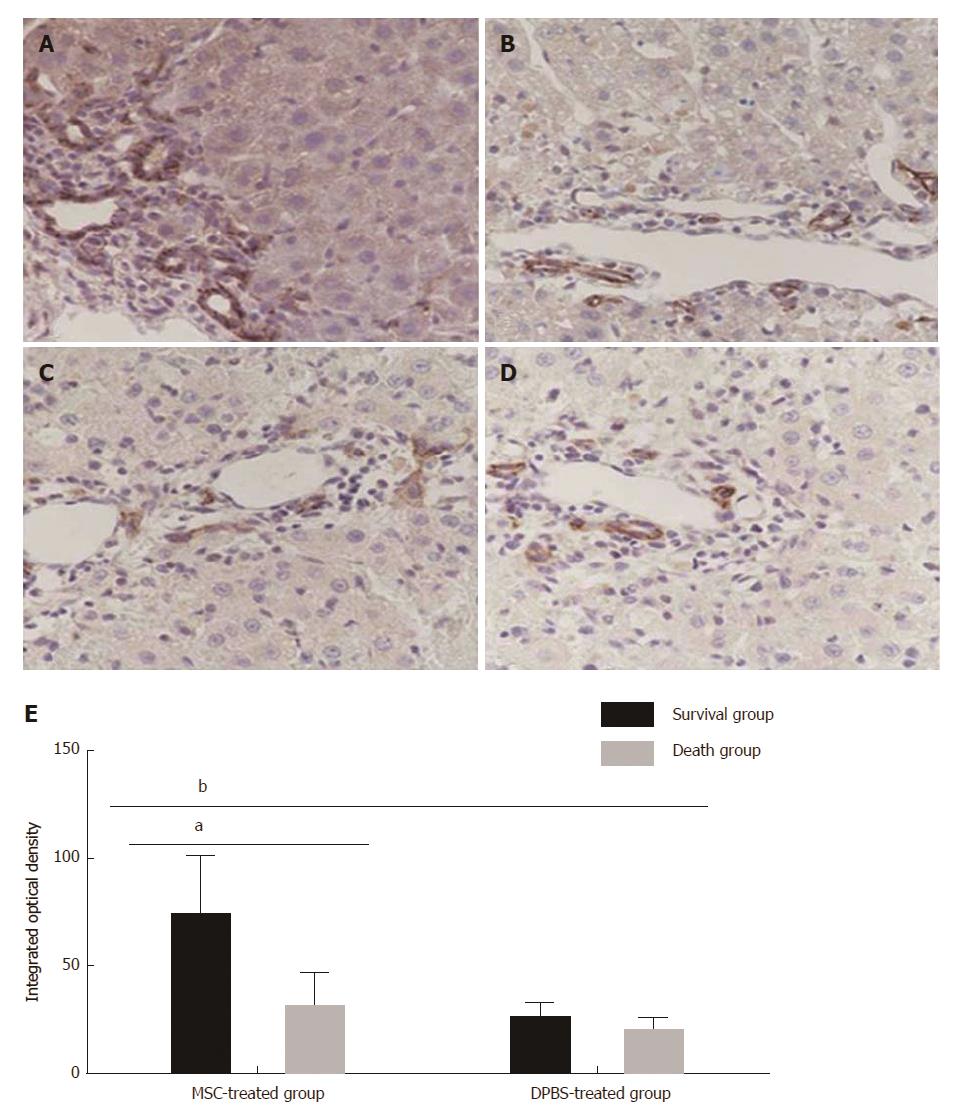
Figure 3 Immunohistochemical staining for epithelial cell adhesion molecule expression in each group.
A: Survival group after mesenchymal stem cell (MSC) treatment; B: Death group after MSC treatment; C: Survival group after DPBS treatment; D: Death group after DPBS treatment; E: Integrated optical density of immunohistochemical staining for EPCAM+ hepatocytes. Bar represents the mean ± SD (n = 5, aP < 0.05, bP < 0.001).
- Citation: Li YW, Zhang C, Sheng QJ, Bai H, Ding Y, Dou XG. Mesenchymal stem cells rescue acute hepatic failure by polarizing M2 macrophages. World J Gastroenterol 2017; 23(45): 7978-7988
- URL: https://www.wjgnet.com/1007-9327/full/v23/i45/7978.htm
- DOI: https://dx.doi.org/10.3748/wjg.v23.i45.7978


