Copyright
©The Author(s) 2017.
World J Gastroenterol. Nov 21, 2017; 23(43): 7776-7784
Published online Nov 21, 2017. doi: 10.3748/wjg.v23.i43.7776
Published online Nov 21, 2017. doi: 10.3748/wjg.v23.i43.7776
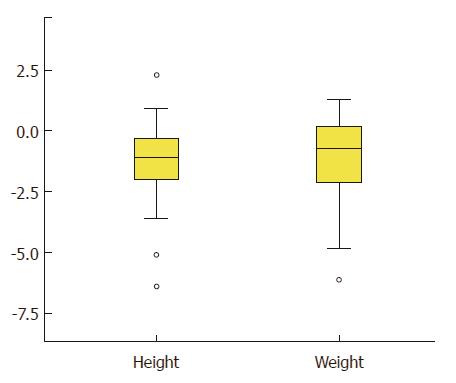
Figure 1 Boxplot showing distribution of weight-for-age and height-for-age z-score in 52 children with biliary atresia surviving with native livers.
From top to bottom, the five horizontal lines represent the largest data point, which is not more than 1.5 times from the box, the third quartile, the median, the first quartile and the smallest data point which is not more than 1.5 times the interquartile range from the box, respectively.
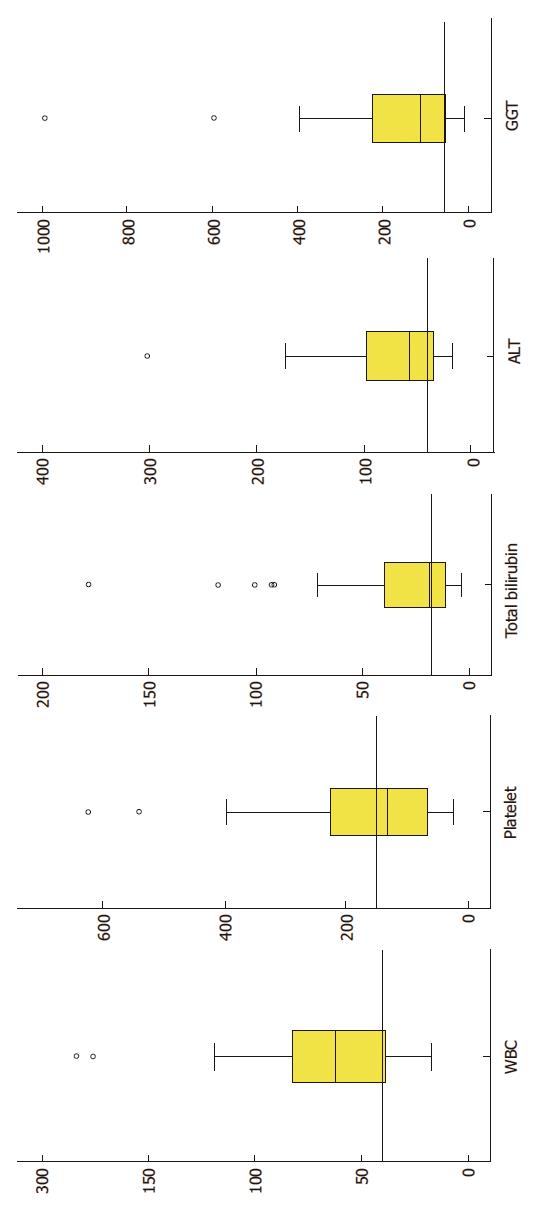
Figure 2 Boxplot showing distribution of white cell count, platelet count, total serum bilirubin and liver enzymes in 52 children with biliary atresia surviving with native livers.
From top to bottom, the five horizontal lines represent the largest data point, which is not more than 1.5 times from the box, the third quartile, the median, the first quartile and the smallest data point which is not more than 1.5 times the interquartile range from the box, respectively.
- Citation: Lee WS, Ong SY, Foo HW, Wong SY, Kong CX, Seah RB, Ng RT. Chronic liver disease is universal in children with biliary atresia living with native liver. World J Gastroenterol 2017; 23(43): 7776-7784
- URL: https://www.wjgnet.com/1007-9327/full/v23/i43/7776.htm
- DOI: https://dx.doi.org/10.3748/wjg.v23.i43.7776


