Copyright
©The Author(s) 2017.
World J Gastroenterol. Nov 7, 2017; 23(41): 7407-7414
Published online Nov 7, 2017. doi: 10.3748/wjg.v23.i41.7407
Published online Nov 7, 2017. doi: 10.3748/wjg.v23.i41.7407
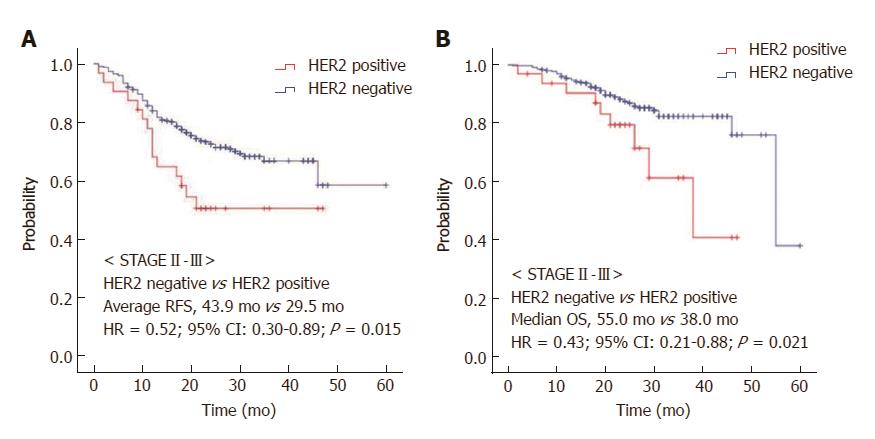
Figure 1 Kaplan-Meier survival curves.
A: Recurrence-free survival (RFS) and B: Overall survival (OS) based on human epidermal growth factor 2 (HER2) expression in stage II-III gastric cancer patients. HR: Hazard ratio.
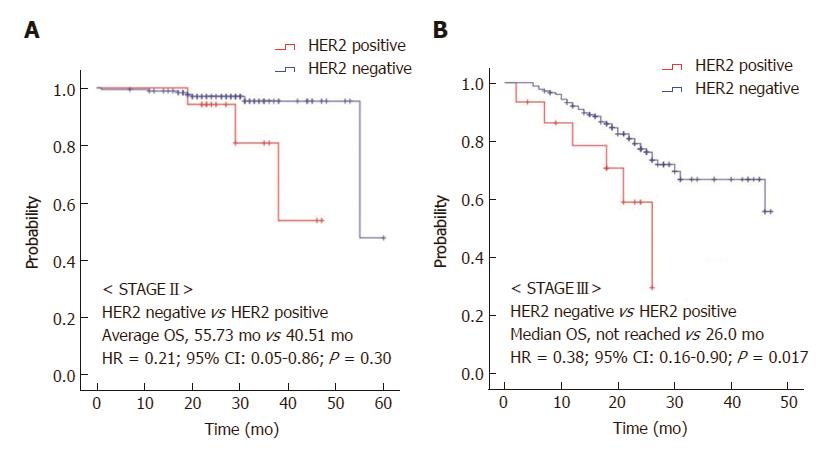
Figure 2 Kaplan-Meier survival curves.
Overall survival (OS) based on human epidermal growth factor receptor 2 (HER2) expression in A: Stage II and B: Stage III gastric cancer patients. HR: Hazard ratio; CI: Confidence interval.
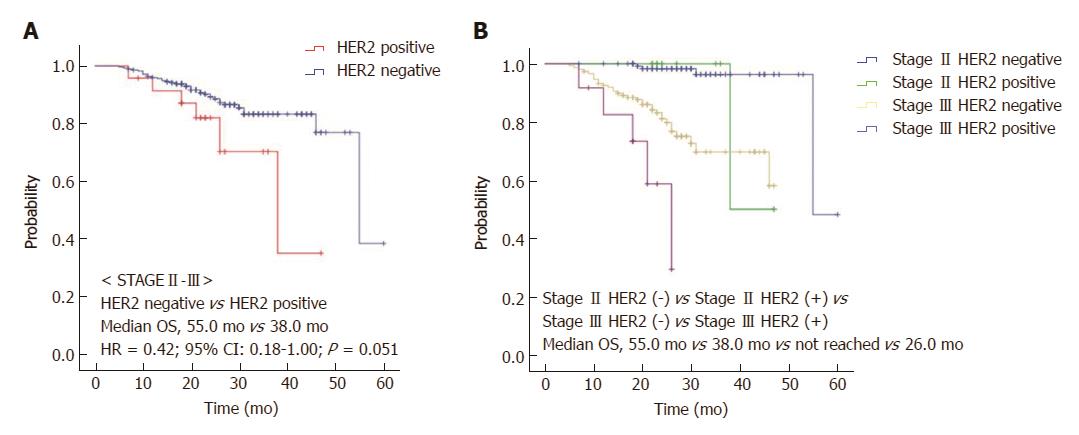
Figure 3 Kaplan-Meier survival curve.
Overall survival (OS) based on human epidermal growth factor receptor 2 (HER2) expression in stage II and III gastric cancer patients who received adjuvant chemotherapy. A: Total patients both stage II and III; B: Divided by each stage. HR: Hazard ratio; CI: Confidence interval.
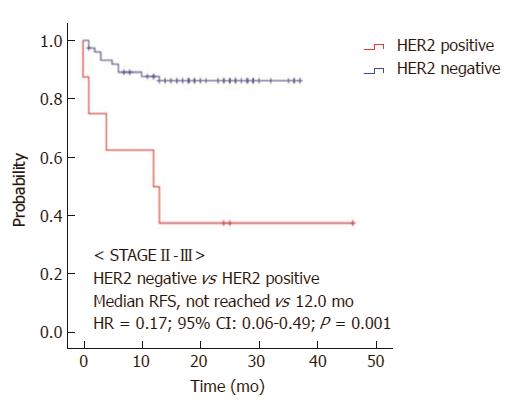
Figure 4 Kaplan-Meier survival curve.
Recurrence free survival (RFS) based on human epidermal growth factor receptor 2 (HER2) expression in stage II and III gastric cancer patients who did not receive adjuvant chemotherapy. HR: Hazard ratio; CI: Confidence interval.
- Citation: Cho JH, Lim JY, Cho JY. Survival analysis based on human epidermal growth factor 2 status in stage II-III gastric cancer. World J Gastroenterol 2017; 23(41): 7407-7414
- URL: https://www.wjgnet.com/1007-9327/full/v23/i41/7407.htm
- DOI: https://dx.doi.org/10.3748/wjg.v23.i41.7407


