Copyright
©The Author(s) 2017.
World J Gastroenterol. Jan 28, 2017; 23(4): 676-686
Published online Jan 28, 2017. doi: 10.3748/wjg.v23.i4.676
Published online Jan 28, 2017. doi: 10.3748/wjg.v23.i4.676
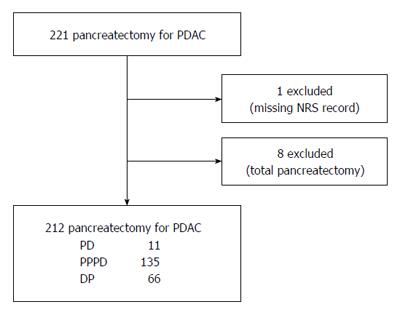
Figure 1 Patient eligibility.
PDAC: Pancreatic ductal adenocarcinoma; NRS: Numerical rating scale; PD: Pancreaticoduodenectomy; PPPD: Pylorus-preserving pancreaticoduodenectomy; DP: Distal pancreatectomy with or without spleen preservation.
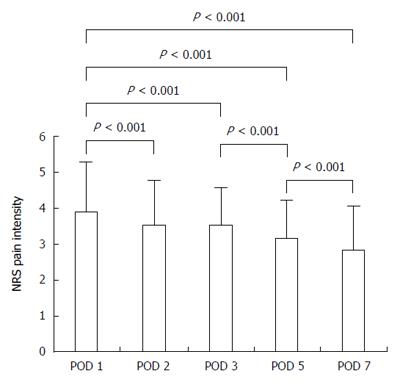
Figure 2 Overall changes in postoperative numerical rating scale pain intensity following pancreatectomy.
POD: Postoperative day; NRS: Numerical rating scale.
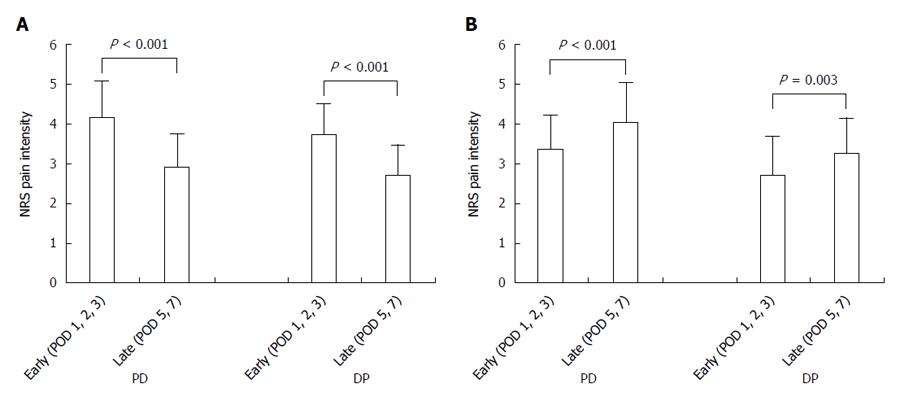
Figure 3 Change in numerical rating scale pain intensity following pancreatectomy stratified by quality of pain control.
A: Good pain control group (n = 109, PD; n = 53, DP); B: Poor pain control group (n = 37, PD; n = 13, DP). PD: Patients underwent pancreaticoduodenectomy or pylorus-preserving pancreaticoduodenectomy; DP: Patients underwent distal pancreatectomy; POD: Postoperative day; NRS: Numerical rating scale.
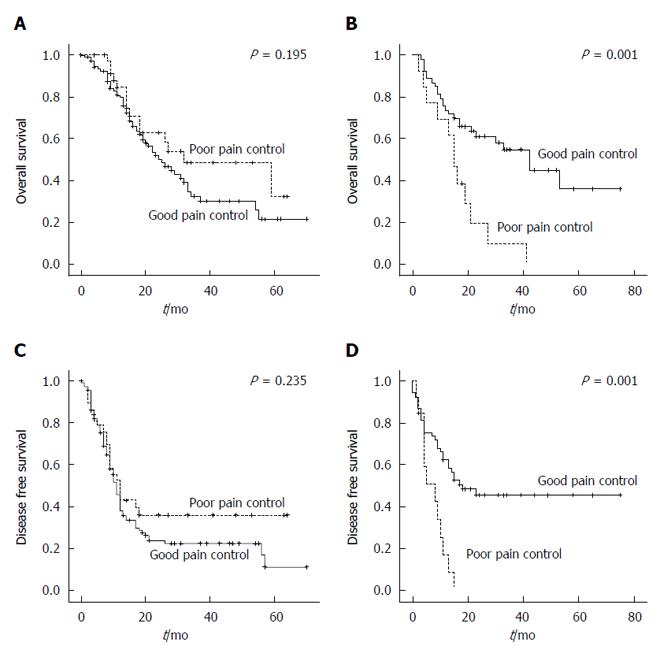
Figure 4 Oncologic outcomes.
Comparison of overall survival between the good pain control group (solid line) and poor pain control group (dotted curve) after pancreaticoduodenectomy (PD) (A) and distal pancreatectomy (DP) (B); Comparison of disease-free survival between the good pain control group (solid line) and poor pain control group (dotted curve) after PD (C) and DP (D).
- Citation: Min EK, Chong JU, Hwang HK, Pae SJ, Kang CM, Lee WJ. Negative oncologic impact of poor postoperative pain control in left-sided pancreatic cancer. World J Gastroenterol 2017; 23(4): 676-686
- URL: https://www.wjgnet.com/1007-9327/full/v23/i4/676.htm
- DOI: https://dx.doi.org/10.3748/wjg.v23.i4.676


