Copyright
©The Author(s) 2017.
World J Gastroenterol. Oct 14, 2017; 23(38): 6983-6994
Published online Oct 14, 2017. doi: 10.3748/wjg.v23.i38.6983
Published online Oct 14, 2017. doi: 10.3748/wjg.v23.i38.6983
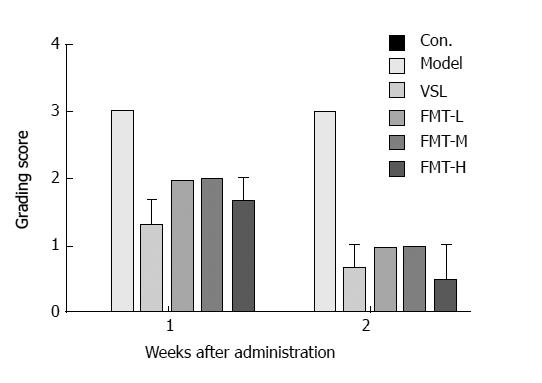
Figure 1 Animal behavior score after fecal microbiota transplantation.
FMT: Fecal microbiota transplantation.
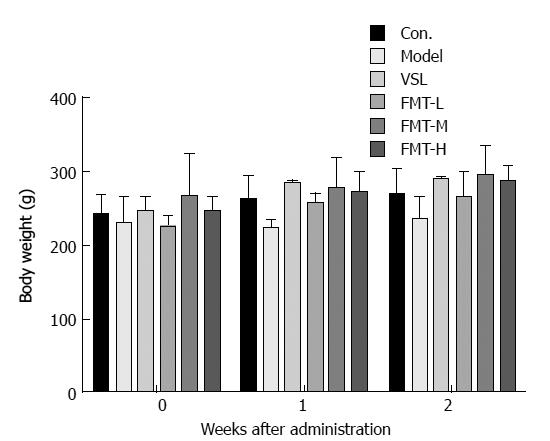
Figure 2 Fecal microbiota transplantation treatment enables body weight gain.
FMT: Fecal microbiota transplantation.
Figure 3 Cognitive function before and after VSL#3 or fecal microbiota transplantation treatment.
A: FMT treatment increases rat total swim distance as revealed by the Morris water maze; B: Rats that received FMT showed improved swim speed; C: The number of line crossings in the FMT group was significantly increased relative to that of the model group. FMT: Fecal microbiota transplantation.
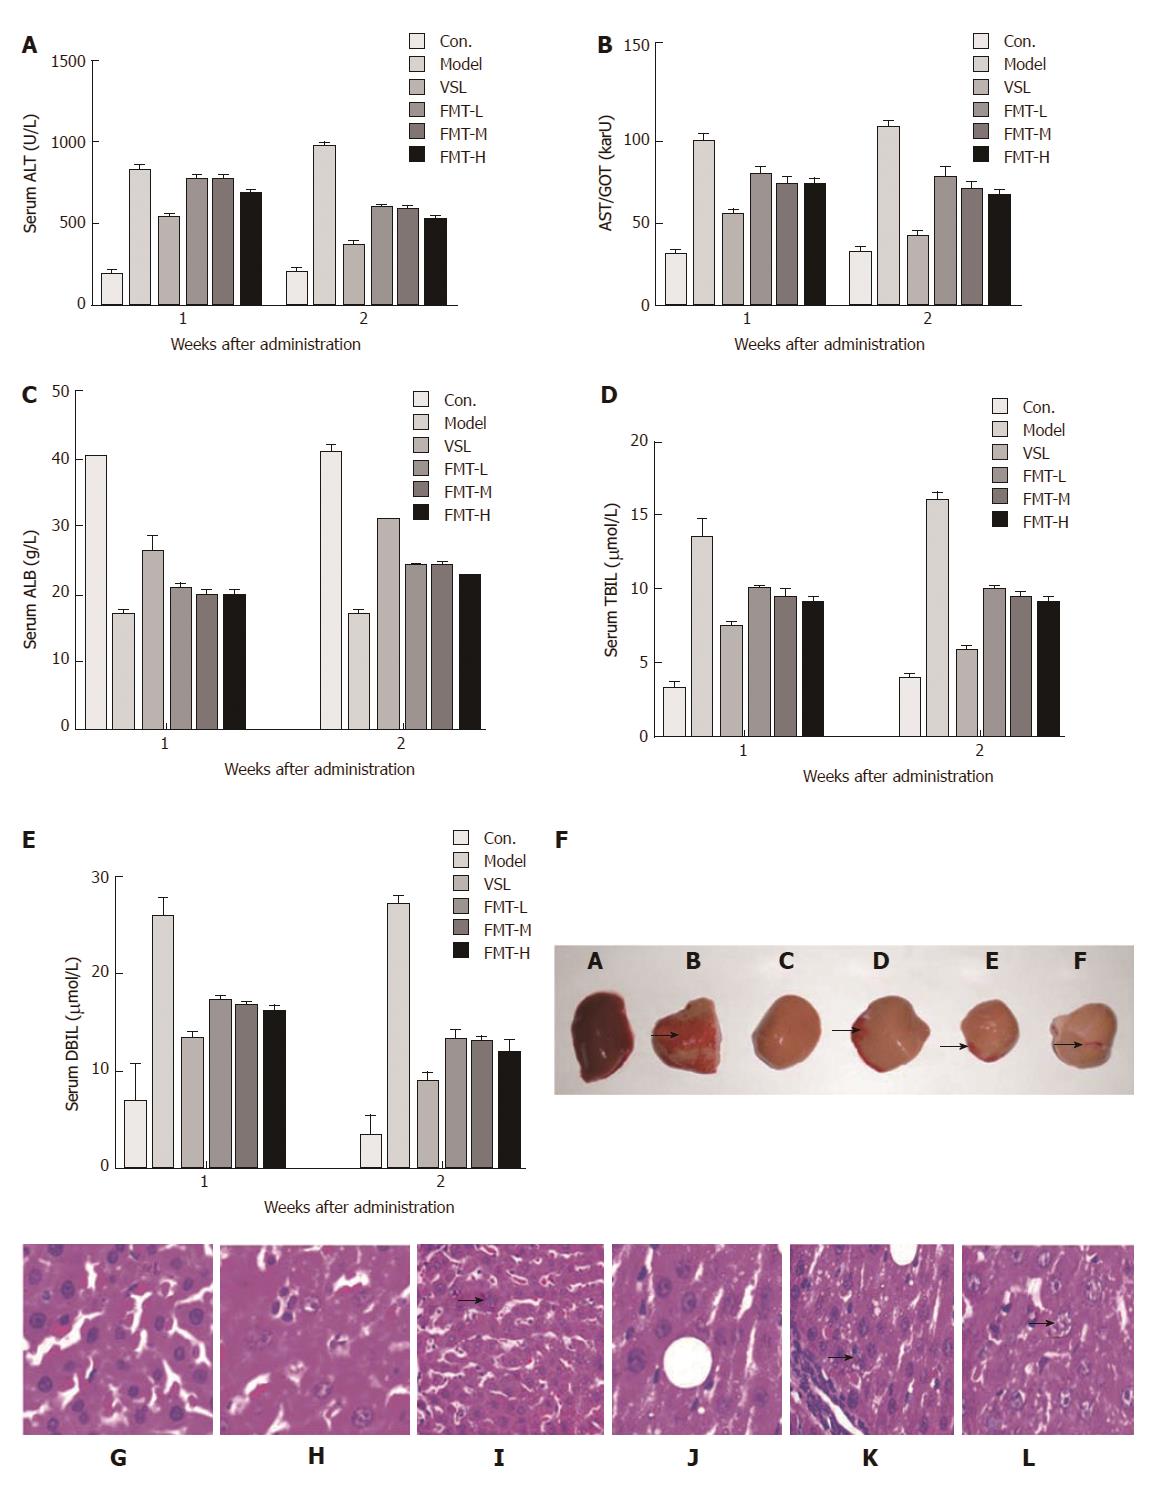
Figure 4 The changes of hepatic function and hepatic pathology before and after treatment with VSL#3 or fecal microbiota transplantation.
A-E: Serological parameter examinations suggested improved hepatic function. Blood samples were collected from the indicated groups at the described time points and analyzed using an automatic biochemistry analyzer; F: Rats treated with FMT showed attenuated liver damage (arrow); J-L: FMT administration decreased CCl4-induced liver necrosis in rats. I: Following VSL#3 treatment, liver dikaryocytes (arrow) were visible; K, L: Following FMT, liver cells with red nucleolus were visible (arrow). FMT: Fecal microbiota transplantation.
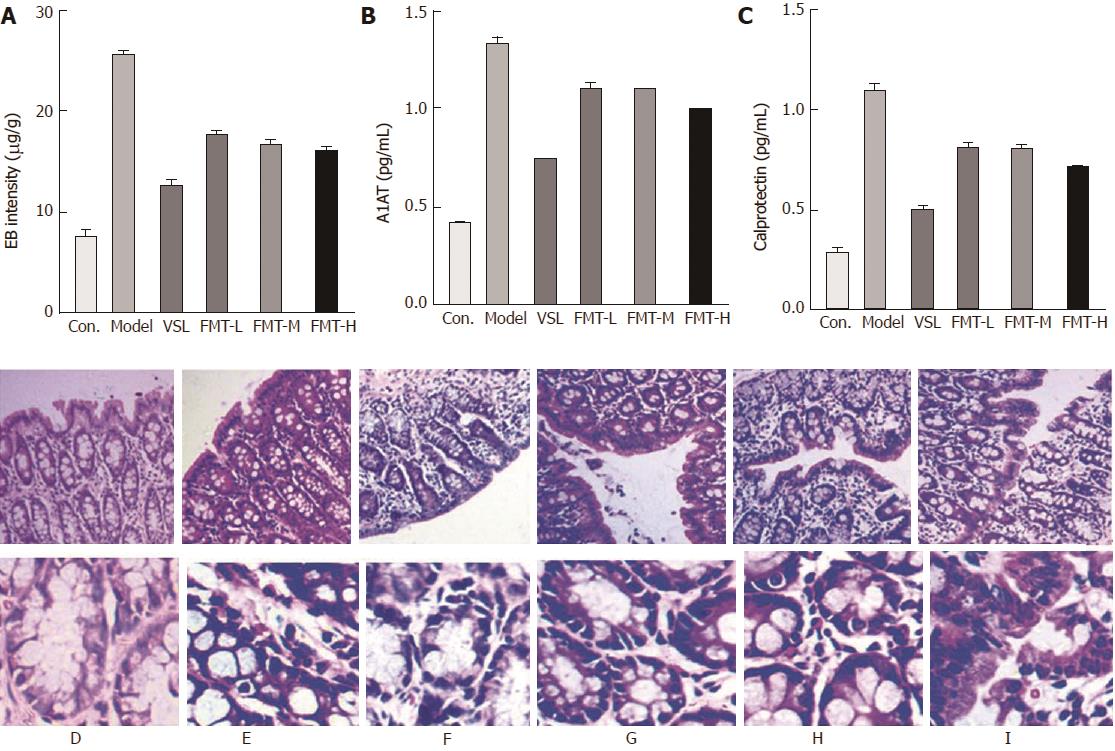
Figure 5 Expression of proteins related to intestinal permeability and intestinal wall stained with hematoxylin and eosin.
A: FMT reduced intestinal permeability in HE rats as evidenced by Evans blue staining; B: Stool A1AT levels in rats were decreased following FMT treatment, which was indicative of improved intestinal permeability and reduced gastrointestinal protein loss. The stools in the indicated groups were collected and diluted in PBS and analyzed by ELISA; C: Stool Calprotectin levels in rats with HE were decreased following FMT treatment, which was indicative of reduced intestinal inflammation. Stools in the indicated groups were collected and diluted in PBS and analyzed by ELISA; D-I: Five-micron thick tissue sections were obtained and stained with hematoxylin and eosin for microscopic examination. The data shown are representative of hematoxylin and eosin staining in the indicated groups, but there were no differences among the tissues. FMT: Fecal microbiota transplantation.
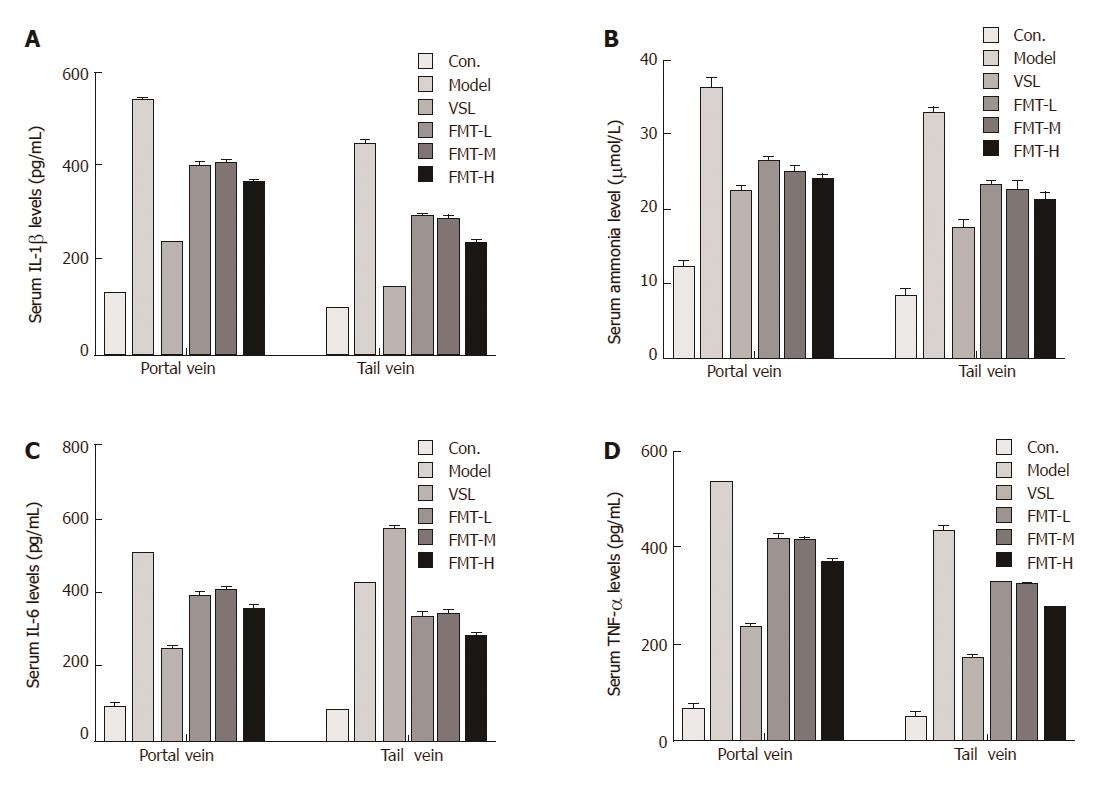
Figure 6 The changes of ammonia levels and inflammatory cytokines in plasma from the portal or tail veins.
A: Plasma ammonia levels decreased significantly upon FMT treatment. Blood samples were collected from the portal and tail veins in the indicated groups and analyzed with an automatic biochemistry analyzer; B: Decreased circulating IL-1β was observed in the FMT groups. Blood samples were collected from the portal and tail veins in the indicated groups and analyzed by ELISA; C: Serum IL-6 was reduced in the FMT-treated groups. Blood samples were collected from the portal and tail veins in the indicated groups and analyzed by ELISA; D: Serum TNF-α was downregulated in the FMT-treated groups. Blood samples were collected from the portal and tail veins in the indicated groups and analyzed by ELISA. FMT: Fecal microbiota transplantation.
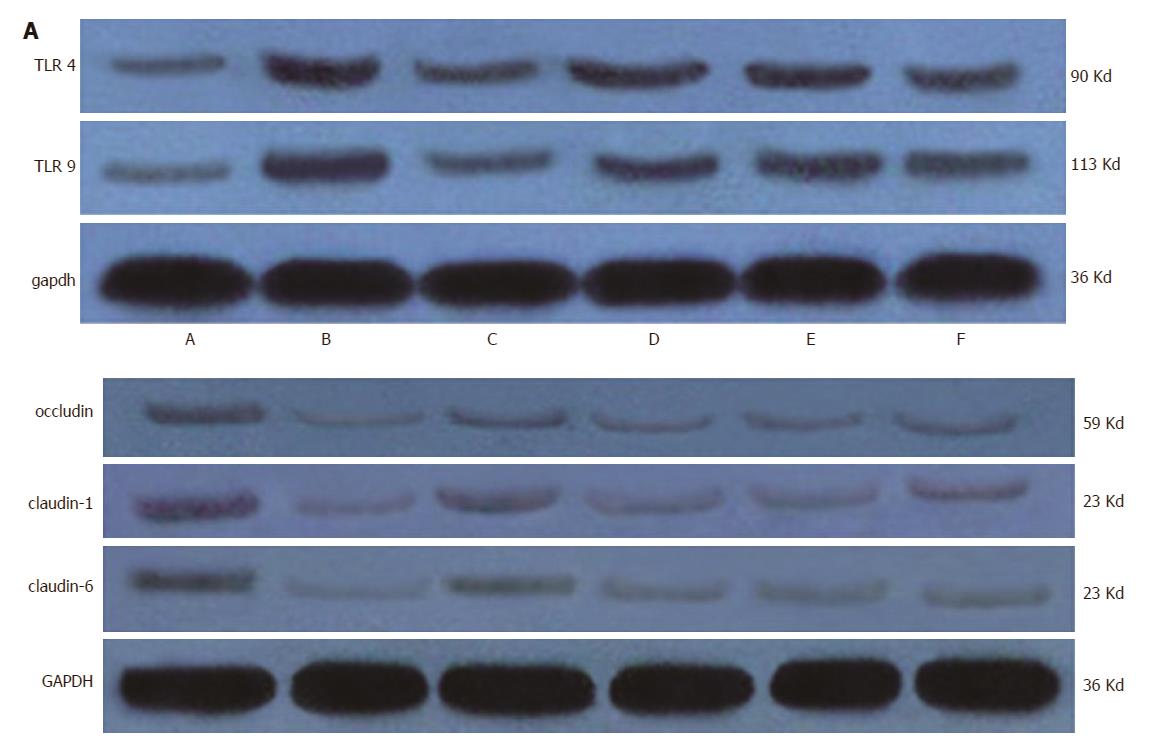
Figure 7 The expression of tight junction proteins in intestinal wall and Toll-like receptors.
A: FMT induced the downregulation of liver TLR4 and TLR9 expression in a dose-dependent manner; B: FMT improved intestinal permeability by restoring the expression of Claudin-1, Claudin-6 and Occludin. FMT: Fecal microbiota transplantation.
- Citation: Wang WW, Zhang Y, Huang XB, You N, Zheng L, Li J. Fecal microbiota transplantation prevents hepatic encephalopathy in rats with carbon tetrachloride-induced acute hepatic dysfunction. World J Gastroenterol 2017; 23(38): 6983-6994
- URL: https://www.wjgnet.com/1007-9327/full/v23/i38/6983.htm
- DOI: https://dx.doi.org/10.3748/wjg.v23.i38.6983


